


Services on Demand
Article
 English (pdf)
 Article in xml format
 Article references
Indicators

Related links
-
 Cited by Google
 -
 Similars in Google
Share

 Permalink
SA Journal of Industrial Psychology
On-line version ISSN 2071-0763
Print version ISSN 0258-5200
SA j. ind. Psychol. vol.46 n.1 Johannesburg 2020
http://dx.doi.org/10.4102/sajip.v46i0.1699
ORIGINAL RESEARCH
An investigation of gender-based differences in assessment instruments: A test of measurement invariance
Renier Steyn; Gideon P. de Bruin
Department of Industrial Psychology and People Management, University of Johannesburg, Johannesburg, South Africa
ABSTRACT
ORIENTATION: Practitioners and researchers often assume that the psychometric instruments they use are invariant and that they therefore measure similar constructs in a comparable manner across men and women respondents. This assumption is, however, rarely tested, leading to an undetected bias in research findings or an adverse impact because of the presence of non-invariance.
RESEARCH PURPOSE: After presenting essential information about measurement invariance (MI) and arguing for the testing thereof, this research aims to reveal the prevalence of MI across several frequently used psychometric instruments credulously used based on the assumption the revenant constructs are measured equivalently across gender exists.
MOTIVATION FOR THE STUDY: Firstly, this study aims to increase awareness regarding MI, a property that can be tested statistically. Secondly, the research aims to make practitioners aware of the presence of bias in psychometric instruments, specifically to identify instruments that could be included in investigations which attempt to understand gender matters in the workplace.
RESEARCH APPROACH/DESIGN AND METHOD: Cross-sectional survey data, pertaining to seven standard instruments, related to innovative work behaviour, were analysed. Pairwise, multigroup confirmatory factor analyses with robust maximum likelihood estimation were used to examine configural, metric, intercept and strict invariance, as well as the equivalence of the latent means.
MAIN FINDINGS: The findings were binary, with four of the instruments showing MI at an equal latent means level, whilst three instruments were non-invariant at the configural level. Measurement invariance was either accepted completely or rejected completely
PRACTICAL/MANAGERIAL IMPLICATIONS: The serratedness of findings, even when using well-recognised and frequently used psychometric instruments, exposes the prevalence of non-invariance in some instruments, thereby necessitating the standard testing for MI. These findings also specify the instruments that are MI (in terms of gender), which allow other researchers and practitioners to use these instruments with more confidence when measuring and comparing men and women respondents in their studies.
CONTRIBUTION/VALUE-ADD: This research demonstrates the ease with which MI testing can be performed and alerts researchers to do MI testing when conducting cross-group studies, as the prevalence of measurement non-invariance is high.
Keywords: gender; measurement invariance; bias; adverse effect; group differences; innovative work behaviour.
Introduction
Gender is a prominent, salient variable within the organisational workplace. In many studies, the perceptions of men and women are compared, or measures of perceptions are used in models to test hypotheses related to gender differences (Cropley & Cropley, 2017; Eagly, 1997; Eagly & Wood, 1999; Koch, D'Mello, & Sackett, 2015). Differential outcomes based on gender are often reported (Eagly & Karau, 2002; Ismail & Nakkache, 2015). Often, these differential outcomes are explained from a sociological perspective, where differences are attributed to gender-specific roles, attributions, stereotypical expectations, performance or attitudes (Hatlevik, Scherer, & Christophersen, 2017). In many of these studies, it is assumed that measures of perceptions are accurate and equally valid for men and women. Examples of such 'naïve' studies are plentiful (Eagly, Johannesen-Schmidt, & Van Engen, 2003; Selvarajan, Slattery, & Stringer, 2015; Tabvuma, Georgellis, & Lang, 2015; Wang & Gorenstein, 2015; Yi, Ribbens, Fu, & Cheng, 2015). In all of the aforementioned studies, it is assumed that measures of perceptions are not gender-specific. It was found that in none of these studies the authors tested for the possibility that the measurement characteristics might differ depending on gender.
When considering differences between groups (e.g. men and women), it could be meaningful to go beyond the sociological explanations (Hatlevik et al., 2017) and (firstly) question the assumption that individual test items and/or the entire scale operate equally across the groups (Millsap, 2011; Tsaousis & Kazi, 2013; Vandenberg & Lance, 2000). The concern, as raised above, is that this assumption is hardly ever tested explicitly, and according to Tsaousis and Kazi (2013), this omission renders all such comparative studies' findings highly questionable. Do different groups of respondents interpret a given measure in a conceptually similar manner? Stated more operationally, are the relationships between manifest indicator variables (scale items, subscales) and the underlying construct the same across groups (Bialosiewicz, Murphy, & Berry, 2013)? Should the construct not be measured equivalently, it will cause bias in the inferences drawn and therefore threaten the validity of the comparisons made (Hatlevik et al., 2017). These potential deviations from equivalence are referred to as measurement non-invariance (Holland & Wainer, 1993). To rule out the possibility that variations in the functioning of a scale result in biased interpretations of results, testing for measurement invariance (MI) can assist with clarity in this regard (Hatlevik et al., 2017).
The academic community is certainly not naïve with regard to the possibility of gender-based MI, and some studies do include tests of MI (Kuhn & Holling, 2009; Van Zyl, 2016; Zampetakis, Bakatsaki, Litos, Kafetsios, & Moustakis, 2017). This is a relatively new trend, however, with most studies failing to test for MI across groups of interest prior to making comparisons (Tsaousis & Kazi, 2013). This article aims to contribute to the literature and the practice of gender-based research by critically analysing the present-day call for the testing of (gender-based) measuring invariance in studies where group (gender) differences are investigated. This will firstly be done by discussing MI, the levels of analyses, as well as the analyses themselves. The most significant contribution of this article lies in the testing of MI across several scales, using the same set of respondents. Presenting tests of MI across several scales, using a common pool of respondents, is envisaged to present rich information on the prevalence, as well as the extent of MI in these scales, which all measure elements within the domain of organisational behaviour. The findings of this research allow for a critical analysis of broad statements that declare that 'investigating measurement invariance should now become a routine part of research into the structure of group differences' (Borsboom, 2006, p. 176).
Literature review
Essential to psychometric assessment is that decisions will follow from the scores created, where individuals are categorised based on cut-off scores and afforded or denied opportunities based on this categorisation (Cohen, Swerdlik, & Sturman, 2013; Gregory, 2011). It is, however, possible that the administration or the nature of a measurement results in scores that systematically prevent accurate or impartial decisions (Cohen et al., 2013), excluding specific groups of individuals. When a score is not based on individuals' standing on the construct, but rather on the individuals' group membership, the measurement is considered to be biased (Berry, 2015; Fontaine, 2008).
Group differences, bias and measurement invariance
An absence of measurement bias against distinct groups is a prerequisite for the use of a given measure in research or workplace assessment (Lee, Lee, Wells, & Sireci, 2016). The Constitution of the Republic of South Africa (Act 106 of 1996), and particularly the Bill of Rights, as well as the Employment Equity Act (Act 55 of 1998) promotes equity, equal opportunity and fair treatment, specifically referring to the fact that:
[P]sychometric testing and other similar assessments of an employee are prohibited unless the test or assessment being used has been scientifically shown to be valid and reliable, can be applied fairly to all employees, is not biased against any employee. (p. 2)
Differences in psychometric test results between groups (men and women) may be the result of substantive differences between the groups, or they may stem from biased measurements (Berry, Poortinga, Breugelmans, Chasiotis, & Sam, 2011). Three types of bias which may result in differences between groups are commonly identified, namely, construct, method and item bias:
-
Construct bias may exist when a measured construct is specific to a particular group, or when items related to the construct are underrepresented in the instrument for one group, and where identical indicators (items) cannot be used across groups, as the repertoire of behaviour associated with the construct differs substantively (Fontaine, 2008; Harzing, 2006).
-
Method bias relates to variation in the scores which results from inadequacy in the instructions of the instrument, response styles that elicit a specific way of responding in one group (e.g. more acquiescent responding) or group characteristics that differ along group lines on how to respond to the instrument (e.g. motivation to respond in line with a specific stereotype) (Fontaine, 2008; Libbrecht, Beuckelaer, Lievens, & Rockstuhl, 2014).
-
Item bias, of particular interest in this article, materialises when an item systematically has a higher or lower score than expected in a specific group, given other indicators of the construct (Fontaine, 2008). Stated differently, the scores of two persons may differ, not in terms of their standing on the latent construct but rather depending on their group status (Berry, 2015; Fontaine, 2008).
Detecting group differences based on construct heterogeneity (when the construct is not defined or when it measures in the same manner [Casper, Vaziri, Wayne, DeHauw, & Greenhaus, 2017; Van Zyl, 2016]), as well as measurement bias, can be addressed through testing for MI. Measurement invariance is concerned with identifying items or instruments to which individuals respond in a similar manner and asking whether respondents from different groups interpret a given measure in a conceptually similar manner (Vandenberg & Lance, 2000).
Observed mean score comparisons are based on the assumption of invariant or equivalent measurement across groups (Vandenberg & Lance, 2000). Although rarely tested (Tsaousis & Kazi, 2013), these assumptions are routinely and straightforwardly testable as extensions to the basic confirmatory factor analysis (CFA) framework. If not tested, violations of measurement equivalence assumptions threaten substantive interpretations of the results and equate to an inability to demonstrate reliability and validity (Bialosiewicz et al., 2013; Vandenberg & Lance, 2000).
It is the task of the researcher to ensure that the interpretation of the data is not distorted because of inequivalence (Berry et al., 2011). Having determined MI, researchers can compare the occurrence, antecedents and consequences of the latent factor scores across groups (Van de Schoot, Lugtig, & Hox, 2012). Testing for MI has important implications when decisions about individuals in a diverse workplace are to be made (Borsboom, 2006; Cheung & Rensvold, 2002). The meaningful interpretations of test scores across groups (nations, ethnic groups, age and gender) do not only serve organisational goals but also serve to safeguard against the possibility of bias or a so-called adverse impact because of non-invariance (Van Zyl, 2016; Whitman, Kraus & Van Rooy, 2014).
Measurement invariance assessment
The existing literature on MI is abundant (Van de Schoot, Schmidt, & De Beuckelaer, 2015). However, in spite of Vandenberg and Lance's (2000) seminal work, in which the authors review and synthesise MI literature, the terminology and practices are still not aligned, and some confusion in the meaning of terms and uniformity in practices prevails. Presented below is an attempt to integrate some of the MI literature.
Testing for MI usually occurs within the CFA framework (Vandenberg & Lance, 2000), and the process of assessing MI essentially involves the testing of a series of increasingly restrictive equality constraints hypotheses (Bialosiewicz et al., 2013). It makes sense to discuss the levels of MI within the context of increasingly restrictive models:
-
Conceptual equivalence (functional equivalence, construct bias) refers to a situation where the domain or trait makes sense in all the groups that are compared (Berry et al., 2011). When a measured construct is specific to a particular group, it would therefore be impossible to find a comparable operational pattern of relationships with other constructs, across the groups (Fontaine, 2008). Although no statistical tests directly test conceptual equivalence, Berry et al. (2011) stated that evidence of configural invariance supports claims regarding conceptual equivalence. Within the context of gender, postpartum depression items and the management of prostate cancer items may serve as examples of conceptual inequivalence or uniqueness.
-
Configural invariance (structural invariance, pattern invariance, the baseline model) involves testing whether or not the same items measure corresponding constructs across groups (Bialosiewicz et al., 2013). In an exploratory factor analysis, the same items would load on the same factors, across groups. It simply implies that the zero or non-zero loadings on the factors (constructs) are the same across groups (Selig, Card, & Little, 2008). This could likewise be done through fitting the same CFA model to each group separately, running the CFA for each group and comparing the fit indexes. Alternatively, and using a comprehensive statistic, running a multiple group analysis without any equality constraints will provide the requisite information regarding configural fit (Van de Schoot et al., 2012). Once this baseline model is established, further testing of invariance can follow, as these results suggest some conceptual equivalence (Berry et al., 2011). No further comparisons, or further tests of MI between groups, are warranted should this level of invariance fail to materialise (Gunn, 2016).
-
Metric invariance (weak invariance, loading invariance) builds upon configural invariance by requiring that in addition to the constructs being measured by the same items, the factor loadings of those items must be equivalent across groups (Bialosiewicz et al., 2013). Indicators (items) that are central to the construct in one group (men) should also be central in the other group (women), and those that are less central in one group (men) should also feature less prominently in the other group (women) (Selig et al., 2008). Attaining invariance of factor loadings therefore suggests that the construct has the same meaning to participants across groups (Bialosiewicz et al., 2013). To test for MI at a metric level, a model where only the factor loadings are equal across groups (although the intercepts are allowed to differ between groups) should be run (Van de Schoot et al., 2012). If there is no significant difference in model fit, then there is evidence to suggest that the factor loadings are invariant across groups. Attaining metric invariance suggests that group comparisons of factor variances and covariances are defensible. However, it does not justify the comparisons of group means (Bialosiewicz et al., 2013). (A violation of metric invariance implies non-uniform bias [Barendse, Albers, Oort, & Timmerman, 2015; Fontaine, 2008].)
-
Scalar invariance (strong, full-score equivalence) builds upon metric invariance by requiring that the item intercepts also be equivalent across groups. To assess scalar invariance, we compare the fit of the scalar model with the fit of the metric model (Bialosiewicz et al., 2013), which requires the running of a model where the loadings and intercepts are constrained to be equal (Van de Schoot et al., 2012). If there is no significant difference in model fit, then there is evidence to suggest intercept invariance. Item intercepts reflect the starting value of the scale on which the factor is based and then, given equivalent slopes (matric invariance), equivalent intercepts justify comparisons of the latent means across groups (Bialosiewicz et al., 2013; Van de Schoot et al., 2012). (Non-invariance of intercepts may be indicative of uniform bias [Barendse et al., 2015; Fontaine, 2008].) Once scalar invariance is established, there is sufficient evidence to claim that the indicators are measuring the same underlying construct and that any observed differences in the construct relate to veridical differences (Selig et al., 2008), thereby corresponding with reality or facts. This should be seen to signify that there are larger forces, such as cultural norms or developmental differences, that are influencing the way in which participants respond to items across groups and that participants are systematically rating items either higher or lower (Bialosiewicz et al., 2013).
-
Strict invariance (full-uniqueness, invariant uniqueness, strict factorial invariance) is concerned with residual error equivalence across groups (Bialosiewicz et al., 2013). It relates to the overall error in the prediction of the construct, as well as unique errors specific to particular indicator variables. When testing strict invariance, you are therefore essentially testing whether your residual error is equivalent across administrations (Bialosiewicz et al., 2013), implying a test of test reliability across groups. Strict invariance represents a highly constrained model and is rarely achieved in practice. Most agree that attaining strict invariance is unreasonable (Bialosiewicz et al., 2013; Byrne, 2009; Chen, Carolina, Curran, Bollen, & Kirby, 2009; Vandenberg & Lance, 2000).
-
Latent mean invariance (invariant factor means, latent mean analysis) builds upon the preceding levels of invariance, and refers to a test of the null hypothesis of equal factor means across groups (Vandenberg & Lance, 2000), and test for significant differences between groups on the level for the construct of interest (Gygi, Fux, Grob, & Hagmann-von Arx, 2016). Once latent mean invariance is achieved, it can be stated that not only does the different groups (e.g. men and women) perceive the items in the same manner but also their scores on the constructs are similar.
All tests for MI usually occur within a CFA framework (Vandenberg & Lance, 2000), where increasingly restrictive equality constrained hypotheses are tested (Bialosiewicz et al., 2013). The parameters for the decision-making regarding these hypotheses are integrated below.
Analysis guidelines for measurement invariance
Measurement invariance refers to the statistical property of a measurement instrument, which indicates that the same underlying construct(s) is being measured across groups. This will be evident when the relationship between the manifest variables (the observed variables such as scale items and the subscale scores) and the underlying construct (the latent variable(s)) is the same across groups (Van de Schoot et al., 2015). The aforementioned makes sense when we assume that psychometric instruments comprised a single or several sets of items, which, when combined, are intended to assess a latent construct or constructs. Within the framework of CFA, it signifies that the common factor model holds across groups (Bialosiewicz et al., 2013). The guidelines presented below align with the assessment of independent clusters CFA (IC-CFA) models.
The most commonly used test to check global model fit is the chi-square test (χ2) (Millsap, 2011; Van de Schoot et al., 2012). It is a test of perfect fit of the 'actual covariance and mean structure, and the covariance and mean structure implied by the hypothesized model' (Millsap, 2011, p. 93). The χ2-statistic is dependent on the sample size, resulting in rejections of reasonable models if the samples are large and failure to reject poor models if the samples are small (Van de Schoot et al., 2012). Although highly desirable, it can be expected that the hypothesis of perfect fit for models would be rejected in larger samples, and for this reason, the χ2-statistic is no longer relied upon as a basis for acceptance or rejection of a model fit (Schermelleh-Engel, Moosbrugger, & Müller, 2003; Vandenberg, 2006). However, a statistically significant difference in χ2 between a less constrained (e.g. metric invariance) and a more constrained model (e.g. scalar invariance) can be deemed as evident of a deteriorating model fit.
Kline (2010) suggests three more types of fit indices that can be used to assess the fit of a model:
-
Firstly, the comparative indices compare the fit of the model under consideration with the fit of the baseline model. Examples of comparative indices are the Tucker-Lewis Index (TLI) and Comparative Fit Index (CFI). Awang (2012), Hair, Black, Babin and Anderson (2010) and Van de Schoot et al. (2012) stated that the model fit is acceptable when the TLI or CFI is > 0.90, whilst others (Schreiber et al., 2006) set the margin at > 0.95. Tucker-Lewis Index or CFI values are acceptable if they are > 0.90, and better if they are > 0.95. (Van de Schoot et al., 2012). Tucker-Lewis Index can also become > 1.0, which should be interpreted as overfitting the model, making it more complex than what was initially required. When comparing less constrained models to more constrained models within the MI context, Vandenberg and Lance (2000) noted that:
[C]hanges in CFI of -0.01 or less indicate that the invariance hypothesis should not be rejected, but when the differences lie between -0.01 and -0.02, the researcher should be aware that differences exist. Definite differences between models exist when the change in CFI is greater than -0.02. (p. 46)
-
Secondly, there are absolute indices that examine closeness of fit, with the most used method being the Root Mean Square Error of Approximation (RMSEA) (Vandenberg & Lance, 2000). Some suggest that the cut-off value for RMSEA should be < 0.08, suggesting < 0.05 as better (Van de Schoot et al., 2012), whilst others suggest that the cut-off value for RMSEA should be < 0.06 (Schreiber et al., 2006). Awang (2012) and Hair et al. (2010) suggested that the model fit is acceptable when RMSEA is < 0.05. As no critical values for the change of RMSEA following the application of more constrained models could be located, the same principles as in the case of CFI could be followed where sequential model fits are compared.
-
Thirdly, there are information theoretic indices, such as the Akaike Information Criterion (AIC) and Bayesian Information Criterion (BIC). Akaike Information Criterion and BIC can be used to compare competing models (Van de Schoot et al., 2012) but should not be applied for the testing of a single model (Schreiber et al., 2006). Lower AIC or BIC values indicate a favourable trade-off between fit and complexity. Whilst the calculation of the actual AIC and BIC values is a very complex matter, the rule of thumb is to simply choose the model with the lowest AIC or BIC value as the best fitting model (Schreiber et al., 2006; Van de Schoot et al., 2012).
The indices used in this study as well as the parameters used when evaluating different models will be discussed in the 'Methods' section of this article, under the heading 'Analysis'.
Methods
The aim of this empirical study was to assess the level of MI across seven instruments, using the same pool of respondents, and then comparing the three assessments of MI of perceptions about the self (in the organisation) with the three measures on perceptions about an organisation (as an entity beyond the self). The discussion which will follow the uniformity of the presence of gender-based MI in general, as well as the possible differences in MI reporting on the self, versus reporting on organisation is presented.
Population and sampling
The target population comprised men and women who were employed within organisations with more than 60 employees and who could report on their perceptions about their own behaviour, as well as on their respective organisations. Companies with more than 60 employees were targeted, as it was presumed that such organisations would have formalised organisational features which might make reporting more uniform. Organisations were included in the study based on their managers' willingness to grant permission to participate, resulting in a convenient sample of organisations. Respondents (employees) were randomly selected from personnel lists provided by the participating organisations. The selection of respondents was therefore as random as possible, given the operational realities of recruiting respondents. The data were collected in compliance with the requirements of the research ethics committee, and standard matters such as specifying the aim of the study, anonymity, confidentiality, the right to withdraw were discussed.
Measurement instrument
In total, seven instruments were administered. These instruments were selected as they were found to be well-suited for inclusion in a predictive model of innovative work behaviour. The first three measured perceptions about organisation (as an entity beyond the self) and the rest measured perceptions about the self (in the organisation). Only brief descriptions of the instruments are provided below, so as to keep the article as concise as possible and in light of the fact that most of these instruments should be well-known to the reader:
-
Brief Corporate Entrepreneurship Assessment Instrument (Hornsby, Kuratko, & Zahra, 2002; Strydom, 2013). Hornsby et al. (2002) are important authors with regard to the conceptualisation and measurement of an organisational climate associated with innovation in the workplace. They developed a 48-item questionnaire to assess the five factors that influence innovation in the workplace: level of management support, work discretion or autonomy, rewards and reinforcement, time availability and organisational boundaries (Hornsby et al. 2002). Strydom (2013) developed a brief version of the instrument, using only 20 items - four per factor. Strydom (2013) reported alphas of 0.731, 0.825, 0.742, 0.689 and 0.574 for the subscales and a reliability coefficient of 0.810 for the entire instrument. Strydom (2013) also provided information on the predictive validity of the instrument.
-
Human Resource Practices Scale (HRPS). The HRPS (Nyawose, 2009) was developed on a rational basis by examining the literature on different human resource management practices. Seven human resource management practices (HRMP) were measured in this study, and the questionnaire consisted of 21 items. The HRPS has a hierarchical structure, with each of the seven factors consisting of three items. The factors are training and development, remuneration, performance management, supervisor support, staffing, diversity management and communication. Nyawose (2009) reported reliabilities varying from 0.74 to 0.93, whilst Steyn (2012) reported Cronbach's alphas of 0.74 to 0.88. Nyawose (2009) and Steyn (2012) reported results pertaining to the predictive validity of the HRPS.
-
Multifactor Leadership Questionnaire. The Multifactor Leadership Questionnaire (MLQ) (Avolio, Bass, & Jung, 1995, 1999) is one of the most frequently used measures of leadership styles (Lowe, Kroeck, & Sivasubramaniam, 1996) and measures transformational, transactional and laissez-faire leadership styles, using 21 items. Dumdum, Lowe and Avolio (2002) reported acceptable reliability and validity for the MLQ in their meta-analysis. Remarkably, Eagly et al. (2003) published a study entitled Transformational, Transactional, and Laissez-Faire Leadership Styles: A Meta-Analysis Comparing Women and Men, without making any reference to MI.
-
Employee Engagement (Utrecht Work Engagement Scale [UWES-9]). This nine-item instrument measures three dimensions of employee engagement, namely, vigour, dedication and absorption (Schaufeli, Bakker, & Salanova, 2006). Schaufeli and Bakker (2003) reported that the 'Cronbach's α of all nine items varies from 0.85 to 0.94 (median = 0.91) across the nine national samples. The α-value for the total database is 0.90' (p. 33). Schaufeli and Bakker (2003) also reported that the suggested -three-factor structure of engagement is confirmed (-cross-samples from different countries) and that the construct is related to other constructs in the expected manner. De Bruin and Henn (2013) could not replicate the three-factor structure and reported 'the presence of a very strong general factor and, in comparison, two weak group factors' (p. 788).
-
Organisational Commitment Scale. The Organisational Commitment Scale (OCS) was developed by Allen and Meyer (1990) to assess affective, continuance and normative commitment, with eight items per dimension. Only the items of affective commitment were used, as it is common practice to interpret the sections of the test separately, and as affective commitment is an effective predictor of many organisational variables (Lamba & Choudhary, 2013; Wright & Kehoe, 2007). Allen and Meyer (1990) reported an internal consistency coefficient of 0.86 for the affective commitment section and commented that the 'relationship between (though) commitment measures … and the antecedent variables … was, for the most part, consistent with prediction' (p. 13). This points to convergent and discriminant validity. Steyn (2012) reported a Cronbach's alpha coefficient of 0.82 for the eight items. Steyn, Bezuidenhout, and Grobler (2017) reported relationships between affective commitment and antecedent variables consistent with what was expected.
-
Innovative Work Behaviour. The 14 innovative work behaviour (IWB) items present elements descriptive of individual innovation, namely, opportunity exploration, generativity, information investigation, championing and application (Kleysen & Street, 2001). Hebenstreit (2003) reported an alpha of 0.948 when using all the items. Lu and Li (2010) could not replicate a five-factor structure and reported Cronbach's alpha values of 0.860 for the two factors they extracted. Wojtczuk-Turek and Turek (2013) also reported on a two-factor solution, with values of 0.880 and 0.890. Although empirical support for the theorised structure was mixed, Kleysen and Street (2001) suggested the use of the items as a single measure of innovation behaviour, as did Hebenstreit (2003). In this study, the original five elements were used in the measurement model, which was tested.
-
Individual Proactiveness. The 17-item instrument was developed to 'investigate a personal disposition towards proactive behavior, defined as the relatively stable tendency to effect environmental change' (Bateman & Crant, 1993, p. 103). It was established through factor analyses that the 17-item instrument is a unidimensional scale with sound psychometric properties, including coefficient alphas varying from 0.85 (Crant & Bateman, 2002) to 0.93 (Crant, 1996). Information on discriminant and predictive validity is also provided by the developers (see Bateman & Crant, 1993; Seibert, Kraimer, & Crant, 2001). Conceptually, the instrument seems well accepted by researchers as a test of proactiveness and a predictor of important organisational outcomes (see Thomas, Whitman, & Viswesvaran, 2010).
Analysis
Descriptive statistics on all seven measures were calculated using SPSS (Version 25.0) (IBM Corp, 2017). These included per gender means and standard deviations, as well as kurtosis and skewness. Within the context of SPSS, significant deviations from normality occur when the skewness/standard error of skewness or kurtosis/standard error of kurtosis has an absolute value > 2 (Weinberg & Abramowitz, 2008). Field (2009, p. 139) seemed more lenient and is comfortable with values below 3.29, also warning against using skew and kurtosis tests in large samples (N > 200), suggesting a visual inspection of the distribution rather than using significance tests because of their sensitivity. In this study, the skewness or kurtosis > 3 will be interpreted as a deviation from normality.
Measurement invariance pertaining to gender was tested for in each of the seven instruments. Following the recommendations of Vandenberg and Lance (2000), pairwise multigroup confirmatory factor analyses with robust maximum likelihood estimation (Wu, Li, & Zumbo, 2007) were used to examine configural, metric, intercept and strict invariance as well as, finally, the equivalence of the latent means. The analyses were performed using the lavaan package (Rosseel, 2012) in R (R Core Team, 2013).
As a non-significant χ2-statistic is highly unlikely given the sample size (Schermelleh-Engel et al., 2003; Vandenberg, 2006), it will not be used as a decisive indicator of model fit. The χ2-statistic will only be reported should it be non-significant. Akaike Information Criterion and BIC, CFI, RMSEA, as well as changes in CFI (∆CFI) and changes in RMSEA (∆RMSEA), were used to test for model fit. The selection of the particular indices was also informed by the standard outputs of the statistical software used.
Following on the discussion presented earlier in this text, the models with the lowest AIC and BIC values were judged as the best fitting models. Comparative Fit Index values > 0.90 were judged as adequate, and lenient RMSEA values < 0.08 as acceptable. With regard to both ∆CFI and ∆RMSEA, a change > 0.01 was seen as an indicator of a deteriorating model, with changes > 0.02 seen as a clear sign of differences between the models.
Ethical considerations
Ethical approval for the study was granted from the University of South Africa's Graduate School of Business Leadership Research Ethics Review Committee (Reference number: 2014_SBL_018_CA).
Results
Demographics
Respondents from 52 organisations participated in the study. In total, 3180 questionnaires were completed. More men (55.3%) than women (47.7%) completed the questionnaires. All the major race or ethnic groups were represented, with approximately 58% black people, 24% white people and 8% each for Asian and people of mixed ethnicity. The mean age of the respondents was 37.8 years (standard deviation 9.1). For tenure, the mean was 9.0 years (standard deviation 7.5). Because of the large number of organisations included in the study, and the diversity in terms of gender, race, age and tenure, the respondents were heterogeneous and relatively free from any particular context, which some authors (Els, Mostert, & Brouwers, 2016) deemed appropriate to assess bias and equivalence.
Descriptive statistics
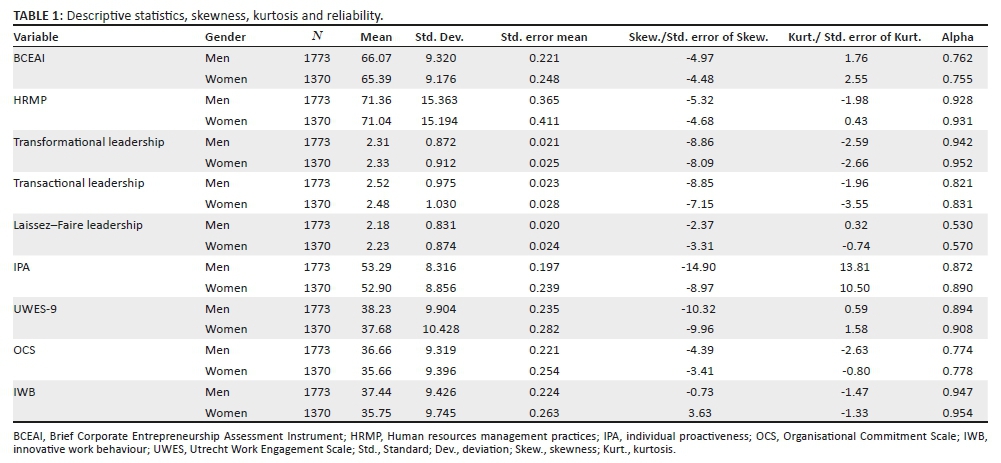
In Table 1, descriptive statistics per gender are presented. Data for 3143 respondents were available, with a split of 56.4% men and 43.6% women. In all but one instance (IWB - women), the skewness was negative, and in only one case, it fell within the threshold of being < 3 (IWB - men). Inspection of the distributions also showed high levels of negative skewness. Although skewness was found in most cases, it was not deemed as problematic, as social desirability, acquiescence and leniency are common in organisational research response patterns, with all these elements contributing to negative skewness (Spector & Brannick, 2009). Unlike skewness, several of the kurtosis values were within the normality range, with the clear exception being individual proactiveness (IPA), for both men and women. Despite these deviations, it was decided to continue with further analyses, given the appropriate and adequate sample size, and particularly the similarity in the distributions across gender.
It is noteworthy that skewness and kurtosis values were specific to particular instruments - and not to gender.
Reliability
The reliability coefficients for the instruments are presented in the last column of Table 1. Apart from the very low coefficients for the three items of the measures of Laissez-Faire leadership, the coefficients were moderate to high, with similar values across gender, and female respondents provided mostly more reliable responses.
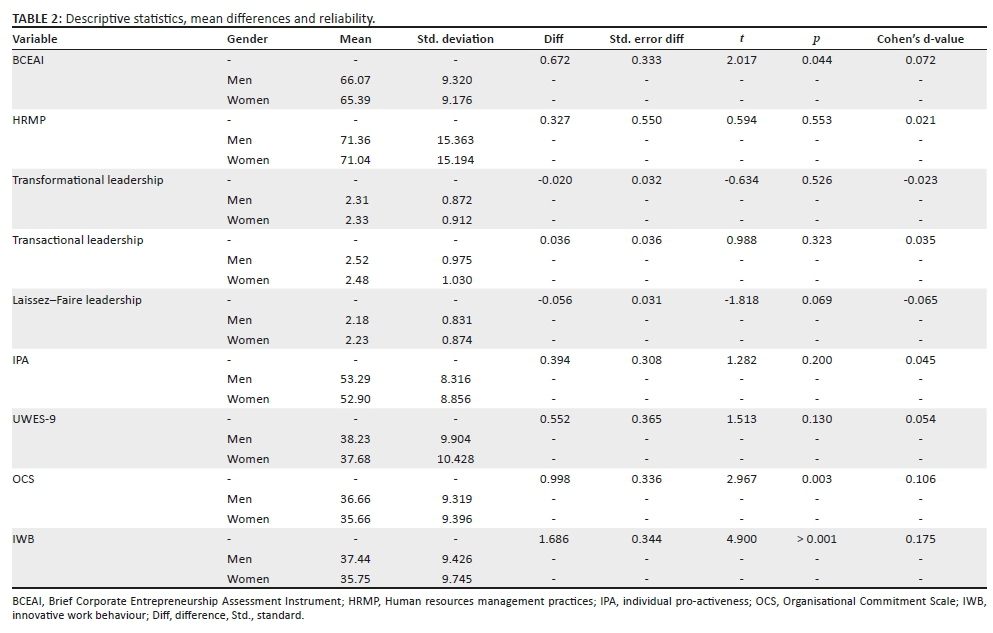
Mean differences
Mean and mean differences were calculated, whilst remaining cognisant of the fact that means may differ because of bias rather than substantive differences between men and women. These are presented in Table 2. These differences should be considered as valid only once the instruments are proven to be measurement invariant.
From Table 2, it can be observed that the mean scores differed significantly (p < 0.01) on two instruments, OCS and IWB. When considering the Cohen's d-values, which is an expression of the difference in terms of standard deviation units, the difference was 10.6% of one standard deviation for OCS and 17.5% of one standard deviation for IWB. These differences have a small practical effect size.
Gender-based measurement invariance
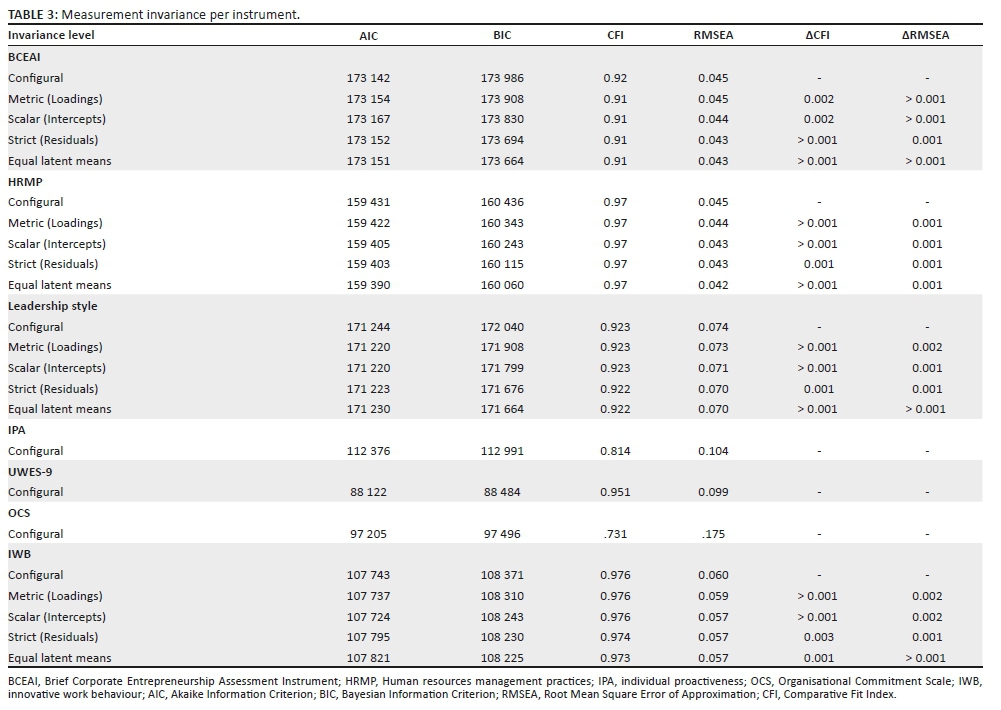
All calculated χ2-statistics were significant, necessitating the rejection of the hypotheses of perfect fit for all models, across all instruments. This result was not interpreted negatively, given the large sample size (Schermelleh-Engel et al., 2003; Vandenberg, 2006).
In Table 3, the MI results pertaining to each instrument are presented. When applying both CFI and RMSEA, four of the seven instruments showed configural MI (Brief Corporate Entrepreneurship Assessment Instrument [BCEAI], HRMP, leadership styles and IWB), whilst three instruments (IPA, UWES-9 and OCS) did not meet the CFI > 0.90 and RMSEA < 0.08 criteria. The last-mentioned three instruments were therefore deemed as non-MI and the first four instruments were deemed as MI, at a configural level.
Further analyses were therefore performed for BCEAI, HRMP, leadership styles and IWB. When considering higher levels of MI, acceptable CFI and RMSEA, as well as small ∆CFI and ∆RMSEA, were considered. All of BCEAI, HRMP, leadership styles and IWB met the CFI and RMSEA as well as small ∆CFI and ∆RMSEA criteria for metric, intercept and strict invariance, as well as ultimately the equivalence of the latent means.
For BCEAI, HRMP, leadership styles and IWB, the BIC statistic also reflects that the best fit is at the highest level, that is, equal latent means. The AIC statistic does not follow the same pattern, and only in the case of HRMP, the AIC and BIC statistics overlap. Only HRPM therefore revealed a consistent fit picture for all the selected indices. Brief Corporate Entrepreneurship Assessment Instrument, leadership styles and IWB met five of the six criteria for fit at equal latent means level.
Discussion
From the literature reviewed, it is evident that testing for MI when doing cross-group comparisons is important and that the concepts associated with MI and the measurement thereof are straightforward and performed without much effort. Although these analyses are sometimes performed, it is not a routine practice, even in journals specifically focussing on gender matters. Without denying the presence of MI in some studies focussing on gender, other fields of research have made great progress in this regard. Within cross-cultural research, for example, MI has become almost a standard reporting point at conferences such as the International Association for Cross-Cultural Psychology (Roland-Lévy, Denoux, Voyer, Boski, & Gabrenya, 2016). This article lobbies for conducting MI by those interested in making cross-gender comparisons and presents the reader with an introduction to the topic as well as with some guidelines on the interpretation of MI outputs.
The large number of organisations included in the study and the diversity of the respondents suggest a heterogeneous sample, which was relatively free from any particular context and therefore deemed appropriate to assess bias and equivalence (Els et al., 2016). More men (56.4%) than women (43.6%) respondents completed the questionnaires. This could be seen as a result of the random selection of respondents within organisations and is reflective of the workforce in South Africa (see Statistics South Africa, 2018), which comprises more men than women.
When testing for the normality of the distribution of the data, it was found that most scales showed statistically significant negative skewness, which was confirmed when inspecting the distribution curves. This was, however, not deemed problematic, as this phenomenon often occurs when surveys are used within organisations assessing positively perceived constructs (Spector & Brannick, 2009). All but one of the kurtosis values were within the normality range, and in that case, the statistic was similar for both men and women. Most telling was the fact that the distributions for males and females were similar across the different measurements, regarding both skewness and kurtosis. With regard to reliability, the coefficients ranged from low to high, with most being acceptable. As in the case of the distribution statistics, the reported coefficients for men and women were similar and mirrored each other.
When comparing observed means scores, significant differences were found for OCS and IWB, with men scoring higher than women on both measures. These differences had a small practical effect size. However, it could be asked whether these (small) differences are substantive or based on bias in the instruments?
The question of MI becomes pertinent in answering the above-mentioned question. The results of the MI tests are reported in Table 3. For three instruments, namely, UWES-9, IPA and OCS, the MI analysed showed that, at a configural level, men and women differed in their understanding of the construct. The same items did not measure corresponding constructs across groups (Bialosiewicz et al., 2013), or stated differently, the same items did not load on the same factors across groups. No further analyses are warranted (Gunn, 2016) should this level of non-invariance be detected. It should thus be concluded that the UWES-9, IPA and the OCS function in such a way that the domain or trait does not make sense in the same manner for men and women. This is a very serious 'indictment' of the integrity of these instruments, as the UWES-9 (Schaufeli et al., 2006) and the OCS (Allen & Meyer, 1990) are frequently used in research across the globe.
As stated before, in all cases, the χ2-test of perfect fit for all models was rejected. However, when considering the CFI, RMSEA, ∆CFI, ∆RMSEA and BIC, the criteria for equivalence of the latent means were met for the other four instruments, namely, BCEAI, HRMP, leadership styles and IWB. This signifies that these instruments met the MI criteria at the configural, metric, intercept and strict invariance levels. On these measures, men and women did not differ in the way they perceived the construct (configural MI), the way the items and the constructs relate (metric MI), the absolute weighting of the constructs (intercept MI), the errors associated with the measurements (strict MI) as well as their mean scores on the latent constructs (equivalence of the latent means). Regarding BCEAI, HRMP, leadership styles and IWB, users may therefore use these scales knowing that gender comparisons of factor variances and covariances are defensible (metric MI), mean differences comparison are secure (intercept MI), reliability is similar (strict MI) and scores for men and women on the latent constructs are similar (equivalence of the latent means).
Much 'neater' results would have been achieved should this reporting have excluded AIC. Akaike Information Criterion indicated - only for HRMP - that the optimal model was at the level of equivalence of the latent means. For the other qualifying instruments (BCEAI, leadership styles and IWB) scores varied, showing lower levels of fit. However, MI at equivalence of the latent means was accepted, given the overwhelming evidence to that effect. Clearly, the number and selection of parameters may also influence the reports. Cherry-picking of parameters is discouraged as this may result in falsification. Therefore, specifying parameters before analyses commence is recommended.
Interesting to note was the fact that in all the cases where configural invariance was achieved, the more constrained models were also satisfactory tested. Stated differently, in none of the cases where configural invariance was attained, it was not eventually followed by providing confirmatory information on MI at the equal latent means level. The additional constraints did not seem to influence the initially obtained statistics considerably. Future research with other instruments could explore this matter further.
Given the results of the MI tests, it could be stated that the observed mean differences (see Table 2) between men and women on OCS may be because of measurement bias, as men and women perceive the concept differently. As far as the observed differences in IWB are concerned, it can be concluded that men show more IWB than women and that they perceive the concept in the same manner. At a latent variable level, however, the means of men and women on IWB are equivalent (see Table 3). Men and women also perceive BCEAI, HRMP and leadership styles in a similar manner, and their standing on these constructs does not differ - not at an observed or a latent mean level. These instruments may be used with confidence when comparing men and women.
Conclusion
In this article, the call for testing of gender-based MI in studies where men and women are compared is answered through discussing the topic of MI and the rationale of testing in an unassuming matter, which allows for easy access to the topic. In this article, the interpretation of the different statistics created with the lavaan package (Rosseel, 2012) in R (R Core Team, 2013) is also operationalised, allying it to seven different instruments. This should make the problems associated with the interpretation of MI results clear to prospective researchers who want to test for MI. Researchers interested in the structure of group differences therefore have no reason not to investigate MI as a routine part of research, as called for by Borsboom (2006). The most significant contribution of this article is the complexity created when testing MI across several scales (using the same set of respondents). The different configurations of the results regarding MI add depth to the discussion on MI and the decision rules that are prescribed. The serratedness of results emphasised the necessity of testing for MI when comparing groups and the structures that underline such measurements. It is recommended that MI be used as a standard procedure, as these tests can be performed and interpreted with ease. Further research on how or why configural invariance 'inevitably' leads to equal latent means is encouraged. The findings also allow prospective users of instruments tested in this research to apply those instruments which showed MI confidently, knowing that these are equivalent across gender.
Acknowledgements
The authors are appreciative for the assistance of the 2014 Masters of Business Leadership class for their assistance in collecting the data.
Competing interests
The authors declare that they have no financial or personal relationships that may have inappropriately influenced them in writing this article.
Author's contributions
R.S. was the primary author and contributed to the conceptualisation of the research, data collection and writing up of the article. G.P.d.B. was the supervisor of R.S.; he guided him through the process and took a leading role in the statistical analysis.
Funding information
This research was supported by the UNISA Formal Qualifications grant (Ref No. 215037914).
Data availability statement
Data sharing is not applicable to this article, given the specifications of the ethical clearance.
Disclaimer
The views and opinions expressed in this article are that of the authors' and not an official position of the institution or the funder.
References
Allen, N.J., & Meyer, J.P. (1990). The measurement and antecedents of affective, continuance and normative commitment to the organisation. Journal of Occupational Psychology, 63(1), 1-18. https://doi.org/10.1111/j.2044-8325.1990.tb00506.x [ Links ]
Avolio, B.J., Bass, B.M., & Jung, D. (1999). Reexamining the components of transformational and transactional leadership using the multifactor leadership questionnaire. Journal of Occupational and Organizational Psychology, 72(4), 441-462. https://doi.org/10.1348/096317999166789 [ Links ]
Avolio, B.J., Bass, B.M., & Jung, D.I. (1995). Multifactor leadership questionnaire technical report. Redwood City, CA: Mind Garden. [ Links ]
Awang, Z. (2012). Structural equation modelling using AMOS graphic (1st edn.). Shah Alam: Universiti Teknologi MARA Press. [ Links ]
Barendse, M.T., Albers, C.J., Oort, F.J., & Timmerman, M.E. (2015). Measurement bias detection through Bayesian factor analysis. In R. Van de Schoot, P. Schmidt & A. De Beuckelaer (Eds.), Measurement invariance (pp. 23-31). Lausanne: Frontiers. [ Links ]
Bateman, T.S., & Crant, J.M. (1993). The proactive component of organizational behavior: A measure and correlates. Journal of Organizational Behavior, 14(2), 103-118. https://doi.org/10.1002/job.4030140202 [ Links ]
Berry, C.M. (2015). Differential validity and differential prediction of cognitive ability tests: Understanding test bias in the employment context. Annual Review of Organizational Psychology and Organizational Behavior, 2(1), 435-463. https://doi.org/10.1146/annurevorgpsych-032414-111256 [ Links ]
Berry, J.W., Poortinga, Y.H., Breugelmans, S.M., Chasiotis, A., & Sam, D.L. (2011). Cross-cultural psychology: Research and applications (3rd edn.). Cambridge: Cambridge University Press. [ Links ]
Bialosiewicz, S., Murphy, K., & Berry, T. (2013). An introduction to measurement invariance testing: Resource packet for participants (pp. 1-370). Washington, DC: American Evaluation Association. [ Links ]
Borsboom, D. (2006). When does measurement invariance matter? Medical Care, 44(3/3), S176-181. https://doi.org/10.1097/01.mlr.0000245143.08679.cc [ Links ]
Byrne, B. M. (2009). Structural equation modeling: Testing for multigroup invariance using AMOS graphics: A road less traveled. Structural Equation Modeling: A Multidisciplinary Journal, 11(2), 272-300. https://doi.org/10.1207/s15328007sem1102_8 [ Links ]
Casper, W.J., Vaziri, H., Wayne, J.H., DeHauw, S., & Greenhaus, J. (2017). The jingle-jangle of work-nonwork balance: A comprehensive and meta-analytic review of its meaning and measurement. Journal of Applied Psychology, 103(2), 182-214. https://doi.org/10.1037/apl0000259 [ Links ]
Chen, F., Carolina, N., Curran, P.J., Bollen, K.A., & Kirby, J. (2009). An empirical evaluation of the use of fixed cutoff points in RMSEA test statistic in structural equation models. Social Methods Research, 36(4), 1-31. https://doi.org/10.1177/0049124108314720.An [ Links ]
Cheung, G.W., & Rensvold, R.B. (2002). Evaluating goodness-of-fit indexes for testing measurement invariance. Structural Equation Modeling, 9(2), 233-255. https://doi.org/10.1207/S15328007SEM0902_5 [ Links ]
Cohen, R.J., Swerdlik, M.E., & Sturman, E.D. (2013). Psychological testing and assessment: An introduction to tests and measurement (8th edn.). New York, NJ: McGraw-Hill. [ Links ]
Crant, J.M. (1996). The proactive personality scale as a predictor of entrepreneurial intentions. Journal of Small Business Management, 34(3), 8-42. https://doi.org/10.1287/isre.13.2.205.83 [ Links ]
Crant, J.M., & Bateman, T.S. (2002). Charismatic leadership from above: The impact of proactive personality. Journal of Organizational Behavior, 21(1), 63-75. https://doi.org/10.1002/(SICI)1099-1379(200002)21 [ Links ]
Cropley, D., & Cropley, A. (2017). Innovation capacity, organisational culture and gender. European Journal of Innovation Management, 20(3), 493-510. https://doi.org/10.1108/EJIM-12-2016-0120 [ Links ]
De Bruin, G.P., & Henn, C.M. (2013). Dimensionality of the 9-item Utrecht work engagement scale (UWES-9). Psychological Reports, 112(3), 788-799. https://doi.org/10.2466/01.03.PR0.112.3.788-799 [ Links ]
Dumdum, U.R., Lowe, K.B., & Avolio, B.J. (2002). A meta-analysis of transformational and transactional leadership correlates of effectiveness and satisfaction: An update and extension. In B.J. Avolio & F.J. Yammarino (Eds.), Transformational and charismatic leadership: The road ahead (pp. 35-66). Oxford: Elsevier Science. [ Links ]
Eagly, A.H. (1997). Sex differences in social behavior: Comparing social role theory and evolutionary psychology. American Psychologist, 52(12), 1380-1383. https://doi.org/10.1037/0003-066X.52.12.1380.b [ Links ]
Eagly, A.H., & Karau, S.J. (2002). Role congruity theory of prejudice toward female leaders. Psychological Review, 109(3), 573-598. https://doi.org/10.1037/0033-295X.109.3.573 [ Links ]
Eagly, A.H., & Wood, W. (1999). The origins of sex differences in human behavior: Evolved dispositions versus social roles. American Psychologist, 54(6), 408-423. https://doi.org/10.1037/0003-066X.54.6.408 [ Links ]
Eagly, A.H., Johannesen-Schmidt, M.C., & Van Engen, M.L. (2003). Transformational, transactional, and laissez-faire leadership styles: A meta-analysis comparing women and men. Psychological Bulletin, 129(4), 569-591. https://doi.org/10.1037/0033-2909.129.4.569 [ Links ]
Els, C., Mostert, K., & Brouwers, S. (2016). Bias and equivalence of the strengths use and deficit correction questionnaire. SA Journal of Industrial Psychology, 42(1), 1-11. https://doi.org/10.4102/sajip.v42i1.1365 [ Links ]
Field, A. (2009). Discovering statistics using SPSS (3rd edn.). London: Sage. [ Links ]
Fontaine, J.R.J. (2008). Traditional and multilevel approaches in cross-cultural research: An integration of methodological frameworks. In F.J.R. Van de Vijver, D.A. Van Hemert & Y.H. Poortinga (Eds.), Multilevel analysis of individuals and cultures (pp. 65-92). Mahwah, NJ: Lawrence Erlbaum. [ Links ]
Gregory, R.J. (2011). Psychological testing: History, principles, and applications (6th edn.). Boston, MA: Pearson. [ Links ]
Gunn, H. (2016). Approaches to studying measurement invariance in multilevel data with a level-1 grouping variable. Unpublished thesis, Arizona State University, Phoenix, AZ. [ Links ]
Gygi, J.T., Fux, E., Grob, A., & Hagmann-von Arx, P. (2016). Measurement invariance and latent mean differences in the Reynolds intellectual assessment scales (RIAS): Does the German version of the RIAS allow a valid assessment of individuals with a migration background? PLoS One, 11(11), 1-13. https://doi.org/10.1371/journal.pone.0166533 [ Links ]
Hair, J.F., Black, W.C., Babin, B.J., & Anderson, R.E. (2010). Multivariate data analysis. Upper Saddle River, NJ: Prentice Hall. [ Links ]
Harzing, A.W. (2006). Response styles in cross-national survey research: A 26-country study. International Journal of Cross Cultural Management, 6(2), 243-266. https://doi.org/10.1177/1470595806066332 [ Links ]
Hatlevik, O.E., Scherer, R., & Christophersen, K. (2017). Moving beyond the study of gender differences: An analysis of measurement invariance and differential item functioning of an ICT literacy scale. Computers & Education, 113, 280-293. https://doi.org/10.1016/j.compedu.2017.06.003 [ Links ]
Hebenstreit, J.J. (2003). Nurse educator perceptions of structural empowerment and innovative behaviour. Structural Empowerment / Nursing Education Research, 33(3), 297-301. https://doi.org/10.5480/1536-5026-33.5.297 [ Links ]
Holland, P.W., & Wainer, H. (1993). Differential item functioning. Hillsdale, NJ: Lawrence Erlbaum. [ Links ]
Hornsby, J.S., Kuratko, D.F., & Zahra, S.A. (2002). Middle managers' perception of the internal environment for corporate entrepreneurship: Assessing a measurement scale. Journal of Business Venturing, 17(3), 253-273. https://doi.org/10.1016/S0883-9026(00)00059-8 [ Links ]
IBM Corp. (2017). IBM SPSS statistics for Windows, Version 25.0. Armonk, NY: IBM Corp [ Links ]
Ismail, H.N., & Nakkache, L. (2015). Gender differences at work: Experiencing human resource management policies in Lebanese Firms. Global Business Review, 16(6), 907-919. https://doi.org/10.1177/0972150915597592 [ Links ]
Kleysen, R.F., & Street, C.T. (2001). Toward a multi-dimensional measure of individual innovative behavior. Journal of Intellectual Capital, 2(3), 284-296. https://doi.org/10.1108/EUM0000000005660 [ Links ]
Kline, R.B. (2010). Principles and practice of structural equation modeling (3rd edn.). New York: Guilford Press. [ Links ]
Koch, A.J., D'Mello, S.D., & Sackett, P.R. (2015). A meta-analysis of gender stereotypes and bias in experimental simulations of employment decision making. Journal of Applied Psychology, 100(1), 128. https://doi.org/10.1037/a0036734 [ Links ]
Kuhn, J.T., & Holling, H. (2009). Measurement invariance of divergent thinking across gender, age, and school forms. European Journal of Psychological Assessment, 25(1), 1-7. https://doi.org/10.1027/1015-5759.25.1.1 [ Links ]
Lamba, S., & Choudhary, N. (2013). Impact of HRM services on organizational commitment of employees. International Journal of Advancements in Research & Technology, 2(4), 407-423. [ Links ]
Lee, M.K., Lee, J.J., Wells, C.S., & Sireci, S.G. (2016). A unified factor-analytic approach to the detection of item and test bias: Illustration with the effect of providing calculators to students with dyscalculia. The Quantitative Methods for Psychology, 12(1), 9-29. https://doi.org/10.20982/tqmp.12.1.p009 [ Links ]
Libbrecht, N., De Beuckelaer, A., Lievens, F., & Rockstuhl, T. (2014). Measurement invariance of the Wong and Law Emotional Intelligence Scale scores: Does the measurement structure hold across far Eastern and European countries? Applied Psychology, 63(2), 223-237. https://doi.org/10.1111/j.1464-0597.2012.00513.x [ Links ]
Lowe, K.B., Kroeck, K.G., & Sivasubramaniam, N. (1996). Effectiveness correlates of transformational and transactional leadership: A meta-analytic review of the MLQ literature. The Leadership Quarterly, 7(3), 385-425. https://doi.org/10.1016/S1048-9843(96)90027-2 [ Links ]
Lu, X., & Li, P. (2010). The impact of learning culture on individual innovative behavior. 2010 International Conference on Management and Service Science, 24 - 26 April 2010. (pp. 1-4). Wuhan, China: Institute of Electrical and Electronics Engineers (IEEE). https://doi.org/10.1109/ICMSS.2010.5577177 [ Links ]
Millsap, R.E. (2011). Statistical approaches to measurement invariance. New York: Routledge. [ Links ]
Nyawose, M. (2009). The relationship between human resources management practices, organisational commitment and turnover intentions amongst engineering professionals. Unpublished thesis, University of South Africa, Pretoria. [ Links ]
R Core Team. (2013). R: A language and environment for statistical computing. Vienna: R Foundation for statistical computing. Retrieved from https://www.R-project.org/ [ Links ]
Roland-Lévy, C., Denoux, P., Voyer, B., Boski, P, & Gabrenya, W.K. (Eds.). (2016). Unity, diversity and culture: Research and scholarship selected from the 22nd Congress of the International Association for cross-cultural psychology. Melbourne, FL: International Association for Cross-Cultural Psychology. [ Links ]
Rosseel, Y. (2012). Lavaan: An R package for structural equation modeling. Journal of Statistical Software, 48(2), 1-36. Retrieved from https://www.jstatsoft.org/v48/i02/ [ Links ]
Schaufeli, W., & Bakker, A. (2003). Utrecht work engagement scale: Preliminary manual. Utrecht: Occupational Health Psychology Unit, Utrecht University. [ Links ]
Schaufeli, W., Bakker, A.B., & Salanova, M. (2006). The measurement of work engagement with a short questionnaire: A cross-national study. Educational and Psychological Measurement, 66(4), 701-716. https://doi.org/10.1177/0013164405282471 [ Links ]
Schermelleh-Engel, K., Moosbrugger, H., & Müller, H. (2003). Evaluating the fit of structural equation models: Tests of significance and descriptive goodness-of-fit measures. Methods of Psychological Research Online, 8(2), 23-74. [ Links ]
Schreiber, J.B., Stage, F.K., King, J., Nora, A., & Barlow, E.A. (2006). Modeling and confirmatory factor analysis results: A review. Journal of Educational Research, 99(6), 323-337. https://doi.org/10.3200/JOER.99.6.323-338 [ Links ]
Seibert, S.E., Kraimer, M.L., & Crant, J.M. (2001). What do proactive people do? A longitudinal model linking proactive personality and career success. Personnel Psychology, 54(4), 845-874. https://doi.org/10.1111/j.1744-6570.2001.tb00234.x [ Links ]
Selig, J.P., Card, N.A., & Little, T.D. (2008). Latent variable structural equation modelling in cross- cultural research: Multigroup and multilevel approaches. In F.J.R. Van de Vijver, D.R. Van Hemert & A. Poortinga (Eds.), Multilevel analysis of individuals and cultures (pp. 93-119). New York, NY: Psychology Press. [ Links ]
Selvarajan, T.T., Slattery, J., & Stringer, D.Y. (2015). Relationship between gender and work related attitudes: A study of temporary agency employees. Journal of Business Research, 68(9), 1919-1927. https://doi.org/10.1016/j.jbusres.2015.01.001 [ Links ]
Spector, P.E., & Brannick, M.T. (2009). Common method variance or measurement bias? The problem and possible solutions. In D. Buchanan & A. Bryman (Eds.), The Sage handbook of organizational research methods (pp. 346-362). Thousand Oaks, CA: Sage. [ Links ]
Statistics South Africa. (2018). Quarterly labour force survey. Retrieved from www.statssa.gov.za/publications/P0211/P02112ndQuarter2018.pdf [ Links ]
Steyn, R. (2012). Human resource practices and employee attitudes: A study of individuals in ten South African companies. Alternation: Interdisciplinary Journal for the Study of the Arts and Humanities in Southern Africa, 5, 167-184. [ Links ]
Steyn, R., Bezuidenhout, M.L., & Grobler, A. (2017). Human resource practices and affective organisational commitment: A sectoral comparative study. SA Journal of Human Resource Management, 15, 1-9. https://doi.org/10.4102/sajhrm.v15i0.841 [ Links ]
Strydom, A.S. (2013). The influence of organizational behaviour variables on corporate entrepreneurship. Doctor of Business Leadership, University of South Africa. [ Links ]
Tabvuma, V., Georgellis, Y., & Lang, T. (2015). Orientation training and job satisfaction: A sector and gender analysis. Human Resource Management, 54(2), 303-321. https://doi.org/10.1002/hrm.21650 [ Links ]
Thomas, J.P., Whitman, D.S., & Viswesvaran, C. (2010). Employee proactivity in organizations: A comparative meta-analysis of emergent proactive constructs. Journal of Occupational and Organizational Psychology, 83(2), 275-300. https://doi.org/10.1348/096317910X502359 [ Links ]
Tsaousis, I., & Kazi, S. (2013). Factorial invariance and latent mean differences of scores on trait emotional intelligence across gender and age. Personality and Individual Differences, 54(2), 169-173. https://doi.org/10.1016/j.paid.2012.08.016 [ Links ]
Van de Schoot, R., Lugtig, P., & Hox, J. (2012). A checklist for testing measurement invariance. European Journal of Developmental Psychology, 9(4), 486-492. https://doi.org/10.1080/17405629.2012.686740 [ Links ]
Van de Schoot, R., Schmidt, P., & De Beuckelaer, A. (2015). Editorial: Measurement invariance. In R. Van den Schoot, P. Schmidt & A. De Beuckelaer (Eds.), Measurement invariance. Lausanne: Frontiers. Retrieved from https://doi.org/10.3389/978-2-88919-650-0 [ Links ]
Van Zyl, C.J.J. (2016). Measurement invariance across gender and ethnicity on the Emotional Quotient Inventory 2.0. Journal of Psychology in Africa, 26(2), 141-148. https://doi.org/10.1080/14330237.2016.1163898 [ Links ]
Vandenberg, R.J. (2006). Statistical and methodological myths and urban legends. Organizational Research Methods, 9(2), 94-201. https://doi.org/10.1177/1094428105285506 [ Links ]
Vandenberg, R.J., & Lance, C.E. (2000). A review and synthesis of the measurement invariance literature: Suggestions, practices, and recommendations for organizational research. Organizational Research Methods, 3(1), 4-70. https://doi.org/10.1177/109442810031002 [ Links ]
Wang, Y.-P., & Gorenstein, C. (2015). Gender differences and disabilities of perceived depression in the workplace. Journal of Affective Disorders, 176, 48-55. https://doi.org/10.1016/j.jad.2015.01.058 [ Links ]
Weinberg, S.L., & Abramowitz, S.K. (2008). Statistics using SPSS (2nd edn.). New York, NJ: Cambridge University Press. [ Links ]
Whitman, D.S., Kraus, E., & Van Rooy, D.L. (2014). Emotional intelligence among Black and White applicants: Examining differences in test performance and test reactions. International Journal of Selection and Assessment, 22(2), 199-210. https://doi.org/10.1111/ijsa.12069 [ Links ]
Wojtczuk-Turek, A., & Turek, D. (2013). Innovativeness in organizations: The role of LMX and organizational justice: The case of Poland. Synergia International Journal of Synergy and Research, 2(1), 41-55. [ Links ]
Wright, P.M., & Kehoe, R.R. (2007). Human resource services and organizational commitment: A deeper examination. Human resource services and organizational commitment, CAHRS WP07-15. Retrieved from https://digitalcommons.ilr.cornell.edu/cgi/viewcontent.cgi?article=1473&context=cahrswp [ Links ]
Wu, A.D., Li, Z., & Zumbo, B.D. (2007). Decoding the meaning of factorial invariance and updating the practice of multi-group confirmatory factor analysis: A demonstration with TIMSS data. Practical Assessment Research & Evaluation, 12(3), 1-26. Retrieved from https://pareonline.net/getvn.asp?v=12&n=3 [ Links ]
Yi, X., Ribbens, B., Fu, L., & Cheng, W. (2015). Variation in career and workplace attitudes by generation, gender,and culture differences in career perceptions in the United States and China. Employee Relations, 37(1), 66-82. https://doi.org/10.1108/ER-01-2014-0005 [ Links ]
Zampetakis, L.A., Bakatsaki, M., Litos, C., Kafetsios, K.G., & Moustakis, V. (2017). Gender-based differential item functioning in the application of the theory of planned behavior for the study of entrepreneurial intentions. Frontiers in Psychology, 8(MAR), 1-8. https://doi.org/10.3389/fpsyg.2017.00451 [ Links ]
 Correspondence:
Renier Steyn
steynr@unisa.ac.za
Received: 01 June 2019
Accepted: 02 Nov. 2019
Published: 18 Mar. 2020

