


Services on Demand
Article
 English (pdf)
 Article in xml format
 Article references
Indicators

Related links
-
 Cited by Google
 -
 Similars in Google
Share

 Permalink
SA Journal of Industrial Psychology
On-line version ISSN 2071-0763
Print version ISSN 0258-5200
SA j. ind. Psychol. vol.45 n.1 Johannesburg 2019
http://dx.doi.org/10.4102/sajip.v45i0.1552
ORIGINAL RESEARCH
Do wage and wage satisfaction compensate for the effects of a dissatisfying job on life satisfaction?
Jacob A. de ConingI; Sebastiaan RothmannI; Marius W. StanderII
IOptentia Research Focus Area, North-West University, South Africa
IISchool of Industrial Psychology and Human Resource Management, North-West University, South Africa
ABSTRACT
ORIENTATION: Research regarding subjective well-being (including life satisfaction and domain-specific satisfaction) is necessary, given the effects thereof on health, work performance, social relationships and ethical behaviour of employees
RESEARCH PURPOSE: This study aimed to investigate the relationships among life satisfaction, job satisfaction and wage satisfaction, as well as how these relationships related to gross wage category in a South African sample.
MOTIVATION FOR THE STUDY: While research has shown that wage level and wage satisfaction are positively associated with both job and life satisfaction, the question arises whether wage level and satisfaction would compensate for the negative effect of a dissatisfying job on life satisfaction.
RESEARCH APPROACH/DESIGN AND METHOD: A cross-sectional design was used. A non-probability convenience sample (N = 763) in the form of the WageIndicator data set was obtained. Hierarchical log-linear analyses and cross-tabulations were carried out to determine the relationships that existed among the constructs.
MAIN FINDINGS: Although job satisfaction and wage satisfaction were strongly related at a low level of wage satisfaction, fewer people were satisfied with their jobs at a high level of wage satisfaction level. Moreover, while job and life satisfaction were strongly related at a low level of job satisfaction level, relatively fewer people were satisfied with their lives at a high level of job satisfaction level. Wage dissatisfaction was associated with dissatisfaction with life but was more strongly associated with life satisfaction at a high level of wage satisfaction. Wage category and wage satisfaction did not interact with the job satisfaction level in affecting life satisfaction.
PRACTICAL/MANAGERIAL IMPLICATIONS: Managers should attend to the perceptions of wage dissatisfaction at low wage and wage satisfaction levels. Such dissatisfaction may have a negative impact on the job and life satisfaction of employees and result in detrimental effects on employees and organisations.
CONTRIBUTION/VALUE-ADD: This study contributes to scientific knowledge regarding the relationships between wage, wage satisfaction, job dissatisfaction and life satisfaction.
Introduction
Subjective well-being captures an individual's subjective assessment of his or her own life (Diener & Seligman, 2004). Such assessment includes satisfaction with one's life, satisfaction with specific domains of one's life (e.g. one's job) and levels of positive and negative affect. High levels of subjective well-being lead to better health, better work performance, better social relationships and more ethical behaviour (Lyubomirsky, King, & Diener, 2005).
Financial concerns have a strong influence on employees' work behaviour (Chapman, Uggerslev, Carroll, Piasentin, & Jones, 2005). There has been a debate about the link between wages, wage satisfaction, job satisfaction and satisfaction with life. Research has shown that income may increase overall life satisfaction (Stevenson & Wolfers, 2008), rather than day-to-day feelings of happiness (Kahneman & Deaton, 2010). Furthermore, various theories and models, for example, equity theory (Al-Zawahreh & Al-Madi, 2012), the neoclassical utility model (Devereux & Engel, 2003) and the income inequality model (Hagerty & Veenhoven, 2003), support the association between job and life satisfaction. However, there are conflicting views regarding the effect of wages on life satisfaction. Some authors claim that wages do not significantly increase life satisfaction after a set amount (Kahneman & Deaton, 2010), while others claim that wages raise life satisfaction without bound (Stevenson & Wolfers, 2008).
Past research focused primarily on the impact of pay on job satisfaction (Clark, Kristensen, & Westergård-Nielsen, 2009; Danish & Usman, 2010) and the relationship between job and life satisfaction (Judge, Bono, Erez, & Locke, 2005; Judge, Locke, Durham, & Kluger, 1998). Few studies include an examination of the three constructs simultaneously. Furthermore, interactions between these constructs might exist. More specifically, while it seems that wage level and wage satisfaction are positively associated with both job and life satisfaction, the question arises whether wage level and satisfaction would compensate for the negative effect of low job satisfaction on life satisfaction. This study investigated the complex relationships among wage category (derived from a gross wage), wage satisfaction, job satisfaction and life satisfaction and examined the interactions between these constructs.
Life satisfaction, job satisfaction, wage satisfaction and wage level
Life satisfaction refers to an overall positive evaluation of the quality of one's life (Saris, Veenhoven, Scherpenzeel, & Bunting, 1996) or the subjective enjoyment of life (Veenhoven, 2014). Overall evaluations of one's life, as well as day-to-day feelings of happiness, both independently contribute to overall life satisfaction (Rojas & Veenhoven, 2013). Satisfaction with life is a broad concept that goes beyond satisfaction with individual life domains, although it may be affected by these domains. Satisfaction with one's job and wages, for example, may contribute to life satisfaction, but it does not automatically indicate its existence (Saris et al., 1996). Employees' satisfaction with life seems to be a result of their expectations and the fulfilment of these expectations, which are affected by a socialisation process (Rojas & Veenhoven, 2013).
Job satisfaction is more closely related to satisfaction with one's job or aspects of that job, and this may vary at different points in time (Diener, Suh, Lucas, & Smith, 1999). Research has established a strong link between job and life satisfaction (Mafini & Dlodlo, 2014). Spector (1997, p. 2) defines job satisfaction as 'the degree to which an individual likes or is content with his or her job'. Moreover, job satisfaction can be viewed and measured based on an individual's feelings towards his or her job (Thompson & Phua, 2012), as well as the individual's thoughts regarding his or her job (Moorman, 1993). Research has shown that job satisfaction contributes to life satisfaction (Dogan & Çelik, 2014). While wage is often seen as a predictor of job satisfaction, its effects may depend on contextual factors (Carr & Mellizo, 2013).
In terms of direct income, the concept of utility is often used to explain the link between income and satisfaction. Utility, in an economic sense, refers to the perceived ability of an item to satisfy an individual's needs or wants (Oxford University Press, 2015). The neoclassical utility model states that individuals are driven to maximise their utility (Devereux & Engel, 2003), which can be done, in part, by increasing their wage. The assumption is that the higher an individual's wage, the more he or she can spend on satisfying his or her needs, which would result in increased satisfaction. Research suggests that life satisfaction coincides well with utility (Silva, De Keulenaer, & Johnstone, 2012).
The theory of compensating wage differentials is based on utility theory and represents another attempt to explain the link between wages and satisfaction. According to this theory, individual utility is derived from both wages and non-financial job aspects (Böckerman, Ilmakunnas, & Johansson, 2011). This approach explains the existence of wage differentials where a firm pays a higher wage and/or allowance to compensate for less favourable non-financial job aspects.
Not all researchers agree with the wages and life satisfaction link. Easterlin found that increasing individuals' income did not necessarily increase their life satisfaction (Clark, Frijters, & Shields, 2008; Easterlin & Angelescu, 2009). Several studies have since contradicted Easterlin's paradox (Sacks, Stevenson, & Wolfers, 2010, 2012; Stevenson & Wolfers, 2013). Stevenson and Wolfers (2008) found that the effect of wage on life satisfaction was stronger for absolute income and that income comparisons played a more limited role. Comparison income still appeared to play a role, however. Paul and Guilbert (2013) found that peer group income had a significant negative effect on life satisfaction.
Research indicates that wage satisfaction involves both satisfaction with wage amount and the wage process (Brown & Huber, 1992). The social sciences often view wages in terms of a comparison among individuals. This implies that an individual's satisfaction with his or her wages is based on his or her perception of how well or poorly these compare to the income of others (Clark et al., 2009). Research has shown that reference-group pay is as important as own pay (Ferrer-i-Carbonell, 2005) and that life satisfaction is gained partly from how well one's income compares to that of a reference group (Welsch & Kühling, 2014). Miceli and Lane (1990) found that wage satisfaction was associated with the number of positive or negative feelings that individuals had towards their wages; this has been proven to significantly contribute to job enthusiasm (Lee & Lin, 2014).
The link between wages and job satisfaction is well researched, with wages generally being a predictor of job satisfaction (Carr & Mellizo, 2013; Schweitzer et al., 2013). Given the interrelatedness of job and life satisfaction, it is not surprising that research has also found life satisfaction affecting gross wage, and vice versa (Dogan & Çelik, 2014). Boodoo, Gomez and Gunderson (2014) found that comparison wage, in particular, played a role in improving the life satisfaction of working individuals, while Haushofer and Fehr (2014) found that long-lasting inadequate wages could lead to a state of anxiety. Utility theory explains that higher wages may lead to higher overall satisfaction (Devereux & Engel, 2003), a sentiment that is mirrored by the income inequality theory (Hagerty & Veenhoven, 2003). Another study showed that the reverse was also true, in that higher life satisfaction was correlated with higher income later in life (De Neve & Oswald, 2012).
Studies have shown that employed individuals (given that they receive a wage) experience higher life satisfaction than unemployed individuals, even those employed in 'bad' jobs, that is, jobs with low job quality (Arampatzi, Burger, & Veenhoven, 2015; Grün, Hauser, & Rhein, 2010; Luhmann, Weiss, Hosoya, & Eid, 2014). Given the relationship between wages and job satisfaction (Duffy, Autin, & Bott, 2015) and the prevalence of wage practices that provide allowances for uncomfortable or dangerous work, high wage satisfaction might compensate for lower job satisfaction in affecting life satisfaction.
Aim of the study
This study aimed to investigate the relationships among wage category (derived from a gross wage), wage satisfaction, job satisfaction and life satisfaction and to determine whether gross wage category and wage satisfaction compensate for the effect of low job satisfaction on life satisfaction.
Method
Participants
This study utilised the South African WageIndicator (WI) survey data set and focused on individuals who were actively employed. As the data set contains data on a large spectrum of variables related to respondents' work experiences, it was necessary to determine which variables were best suited to answering the research questions. The following variables were identified: job satisfaction, life satisfaction, wage satisfaction and gross wage. The data set was then cleaned to ensure that missing and indolent responses within the four variables under study were removed. Data cleaning resulted in a final sample of 763. The sample was not limited to a single organisation or geographic region and represented different genders, marital statuses, education levels, income levels, ages and racial groups.
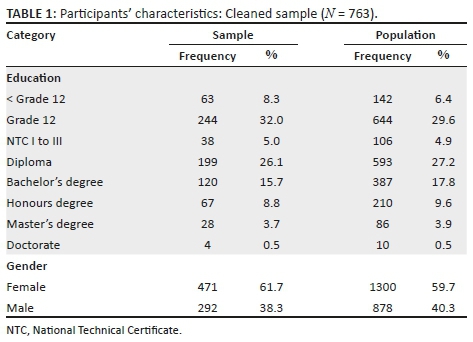
Regarding wage distribution in the population (N = 2178), a total of 557 individuals (25.57% of the population) were in the low wage category (R18 to R7519 per month), 1069 (49.08% of the population) were in the medium category (R7521 to R21 949 per month) and 552 individuals (25.34% of the population) were in the high category (R22 000 to R749 000 per month). In the cleaned sample (N = 763), a total of 239 individuals (31.3% of the sample) were in the low wage category (R18 to R7519 per month), 338 (44.3% of the sample) were in the medium category (R7521 to R21 949 per month) and 186 individuals (24.4% of the sample) were in the high category (R22 000 to R749 000 per month).
Table 1 shows that females comprised the majority of the sample (61.7%). The highest percentage of subjects had a Grade 12 qualification (32%), followed by those with a diploma (26.1%). The percentages regarding education and gender of the sample were close to the percentages in the population.
Measuring instruments
The WI data set contains both cross-sectional and longitudinal data regarding working conditions and wages across 65 countries. The WI survey has been active in South Africa since 2005, with the 2013 data set being the most recent available at the time of access. Access to the data set can only be obtained through a formal application process made to the International Data Service Centre (IDSC), and access is restricted to universities and research institutions.
Data collection for the WI data set takes place via an online multilingual survey hosted on dedicated sites in each of the countries covered by the survey. These dedicated sites provide users with a salary comparison tool and job-related information tailored to the specific country that the site covers. Visitors to these sites are invited to complete the WI survey. An incentive is offered for completion. The WI survey measures life satisfaction using a Likert scale, ranging from 1 (dissatisfaction) to 10 (satisfaction). Researchers have found that single-item life satisfaction measures exhibit similar criterion validity to multiple-item measures and do not produce systematically different correlations (Cheung & Lucas, 2014). Furthermore, Lucas and Donnellan (2012) indicate that single-item measures may be more reliable than previously thought. This provides support for the use of single-item measures to measure life satisfaction.
Job satisfaction is measured with a direct evaluation ('How satisfied are you with your job?'). The survey utilises one item to evaluate an individual's gross wage ('What is your gross income?') and how this is structured. The survey contains one item directly related to wage satisfaction ('How satisfied are you with your pay?'). Both wage satisfaction and job satisfaction are measured using a five-point Likert rating scale, ranging from 1 (highly dissatisfied) to 5 (highly satisfied). Dolbier, Webster, McCalister, Mallon and Steinhardt (2005) found strong evidence for the reliability and validity of a single-item measure of job satisfaction (and by implication wage satisfaction, which is an element of job satisfaction).
To protect the confidentiality and privacy of respondents, no names, addresses or other direct identifiers were requested from respondents (Tijdens, Van Zijl, Hughie-Williams, Van Klaveren, & Steinmetz, 2010). The WI data set is specifically designed to collect detailed information concerning people's earnings, benefits, working conditions, employment contracts and training. It is not tailored to one individual study. The purpose is to provide a large high-quality data set to universities and research institutions.
Research procedure
Access to the WI data set was obtained through a formal application process to the IDSC. On approval, the data set was downloaded in the form of an SPSS input file and stored locally. The latest available data set (2013) was selected and cleaned to remove missing or incomplete values. This was done using IBM SPSS 23 (IBM Corporation, 2015). Next, the data was filtered to include only respondents who were actively employed and working; the resulting sample included 8254 respondents (original sample and/or population size).
The data set was reviewed to determine the variables that had to be included in the study to answer the research question: Do wage category and wage satisfaction compensate for a dissatisfying job? The reasoning was to examine whether participants who received a high gross wage and were satisfied with their jobs would experience low job satisfaction and high life satisfaction; this would be most suited to answering the primary research question. This reasoning was supported by research indicating that two-way interactional relationships existed among wages (and wage satisfaction), job satisfaction and life satisfaction, with life satisfaction being a broader overarching concept (Boodoo et al., 2014). The following variables were used: gross wage category, wage satisfaction, job satisfaction and life satisfaction.
For the wage satisfaction, job satisfaction and life satisfaction variables, the decision was made to focus on contrast groups (high and low). Average scores were removed from the analyses to obtain more accurate estimates of the relations between variables when scores on the four variables were high and low. Groups were selected that scored either high or low (in terms of the upper and lower percentile) on wage satisfaction, job satisfaction or life satisfaction. These contrast groups were studied in relation to gross wage category. Four new variables were created in IBM SPSS, which divided the selected variables into three categories, namely, low (1), medium (2) or high (3). The medium group was removed for the satisfaction variables, leaving the following categories: high, medium and low gross wage category; high and low wage satisfaction; high and low job satisfaction; and high and low life satisfaction.
This allowed for the comparison of contrast groups among the different variables, for example, comparing gross wage with job satisfaction. The rationale for using contrast groups is that three categories of gross wages (high, medium, low) were retained, as these would allow the exploration of interactions between satisfaction and medium wage if the need were to arise. Gross wage was the only variable that contained continuous data, as individuals could enter any amount rather than select from a scale.
Statistical analysis
IBM SPSS 23 (IBM Corporation, 2015) was utilised to clean the initial data set. Statistical analysis was then carried out using SPSS 23 (IBM Corporation, 2015). Firstly, frequencies were calculated to describe the sample. During this process, IBM SPSS removed missing and incomplete values, leaving a total of 2178 responses across three categories. Removal of the medium (2) category for the satisfaction variables resulted in a total sample of 763 (final sample).
Cross-tabulation was used to produce a contingency table of the data. Therefore, the contingency table contained the number of cases that fell into each of the categories. This table was used to test whether the assumptions required for hierarchical log-linear analysis had been met, namely, no counts less than one and not more than 20% less than five (Field, 2013). As these conditions had been met, the study moved on to log-linear analysis.
Hierarchical log-linear analysis was used to construct a model that predicted the data. Log-linear analysis allows for the expression of categorical data in the form of a linear model, provided that logarithmic values are used (Field, 2013). The analysis constructs a model containing all possible interactions among the variables under study. This model fits the data; however, it is usually very complex. Using a process of backward elimination, log-linear analysis removes interactions until the removal of an interaction significantly affects the model fit (Field, 2013). In this study, removal of interactions followed a hierarchical progression, moving from highest-order interaction (three-way) to lower-order interactions (two-way). The purpose of this process was to end with the simplest model that best fit the data. Cross-tabulations were used to interpret significant effects. The frequencies across different categories were plotted and graphically displayed.
Results
Preliminary model screening
The full model was proposed because there was no prior reason to remove any associations. Screening and model building were used to eliminate associations that did not contribute to observed cell frequencies (Field, 2013). Table 2 contains the information needed to start the model-building procedure: the simultaneous tests for the effects of each order, each order and higher, and the test of individual association. The likelihood ratio and Pearson criteria were used to evaluate the K-way and higher-order effects. The K-way and higher-order effects are reported in Table 2.
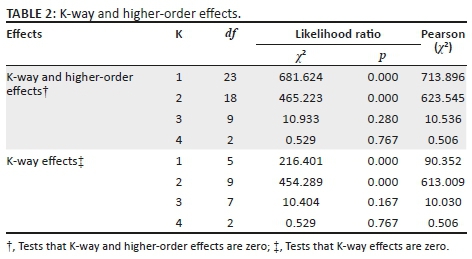
According to Tabachnick and Fidell (2014), it is necessary to test all four-way effects combined and three- and four-way effects combined because combined effects take precedence over individual effects. If both combined tests are non-significant, the three- and four-way associations are deleted, regardless of their partial test. If the combined test is significant and the three- or four-way effects are significant, the three- or four-way effects are retained in the model. Table 3 shows that the model fit could be improved by removing the four-way and three-way interactions. Thus, the model did not need to contain associations greater than two-way.
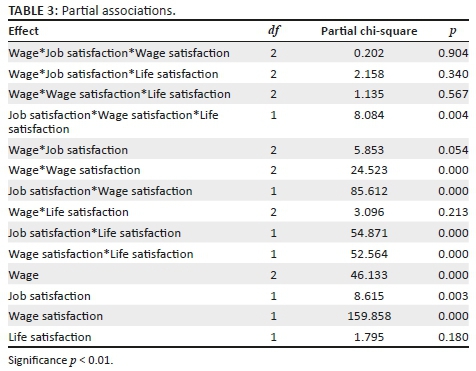
Table 3 provides the basis of a search for the best model of one- and two-way effects.
Table 3 shows that various associations were statistically significant (p < 0.01): job satisfaction by wage satisfaction (partial χ2 = 85.612, p < 0.001), job satisfaction by life satisfaction (partial χ2 = 54.871, p < 0.001), wage satisfaction by life satisfaction (partial χ2 = 52.564, p < 0.001) and wage by wage satisfaction (partial χ2 = 24.523, p < 0.001). Two of the two-way associations were non-significant: wage by job satisfaction (partial χ2 = 5.853, p > 0.01) and wage by life satisfaction (partial χ2 = 3.096, p > 0.001). All first-order effects needed to be included in the final hierarchical model because they were highly significant or part of a significant two-way interaction. Although one three-way effect, job satisfaction by wage satisfaction by life satisfaction, was statistically significant (partial χ2 = 8.084, p < 0.01), the three-way associations were not considered for inclusion because the simultaneous tests took precedence over the component associations (Tabachnick & Fidell, 2014).
Stepwise model selection
Stepwise selection by simple deletion of the model with six two-way terms was conducted with IBM SPSS HILOGLINEAR. The selection process stopped after the second step because the criterion probability (0.01) was reached. Each potential model generates a set of expected frequencies. The goal of the model selection is to find the smallest number of effects that still provides a fit between expected and observed frequencies. Criteria for the optimal model are that (1) it must have a non-significant likelihood ratio chi-square value and (2) the selected model should not be significantly worse than the next more complicated model (Tabachnick & Fidell, 2014).
The first model (Step 0) included six effects. The model was not significant, meaning that it provided an acceptable fit between expected and observed frequencies: χ2 = 10.934, df = 9, p = 0.280. In Step 1, effects were deleted one at a time. Wage by job satisfaction (p = 0.054) and wage by life satisfaction (p = 0.213) were deleted in this step because these effects produced the smallest chi-square change from Step 0. This model was also statistically non-significant (χ2 = 14.030, df = 11, p = 0.231). The second criterion for model selection is that the model should not be significantly different from the next more complicated model. Deletion of the two effects (wage by job satisfaction and wage by life satisfaction) did not result in a significant difference between the models: χ2(1) = (14.030 - 10.934) = 3.096, ∆df = 3, p = 0.213. Therefore, the model in Step 1 was retained because it was not significantly worse than the next more complicated model. The model of choice for explaining the observed frequencies included all first-order effects and the two-way associations between job satisfaction and wage satisfaction, job satisfaction and life satisfaction, wage satisfaction and life satisfaction, and wage and wage satisfaction.
Adequacy of fit
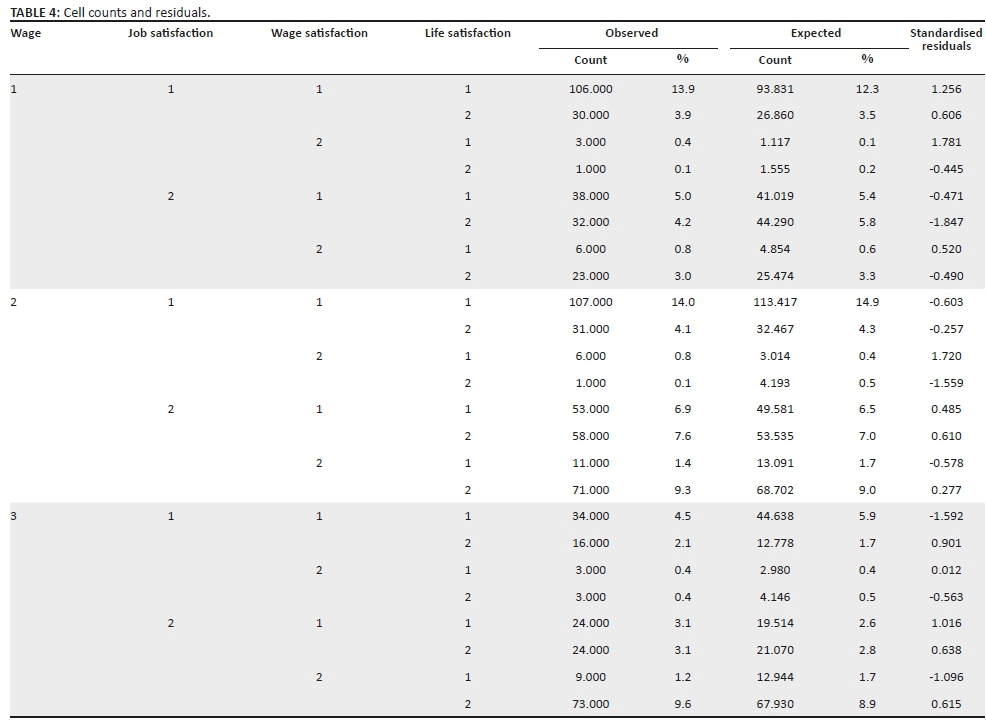
The likelihood ratio χ2 (14.030, p = 0.231) indicated a good fit between observed and expected frequencies. Confidence limits for χ2 were found by using an IBM SPSS syntax developed by Smithson (2003). Confidence limits (90%) were 0-16.861. The upper level was slightly higher than the critical value of 14.030 (df = 18, α = 0.05). Assessment of fit of the model in individual cells proceeded through inspection of the standardised residuals for each cell. The cell counts and residuals are reported in Table 4.
Table 4 shows the observed and expected frequencies for each cell and the standardised residual values from which discrepancies were evaluated. Most of the standardised residual values were quite small. None of the cells had values that exceeded the critical value of 1.96. Therefore, the model fit in individual cells was acceptable.
Figure 1 shows a normalised probability plot of residuals.
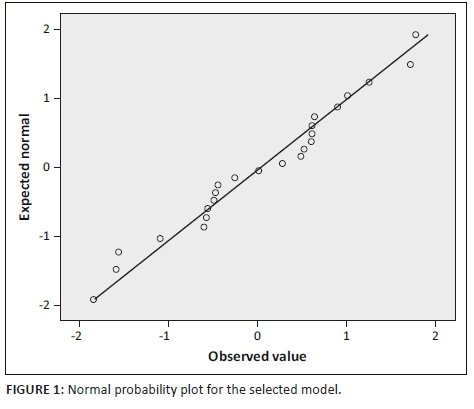
Figure 1 shows that the observed standardised residuals were close to those that were expected (the diagonal line). The closer the observed frequencies are to the expected frequencies, the better the specified model fits the data.
Interpretation of the selected model
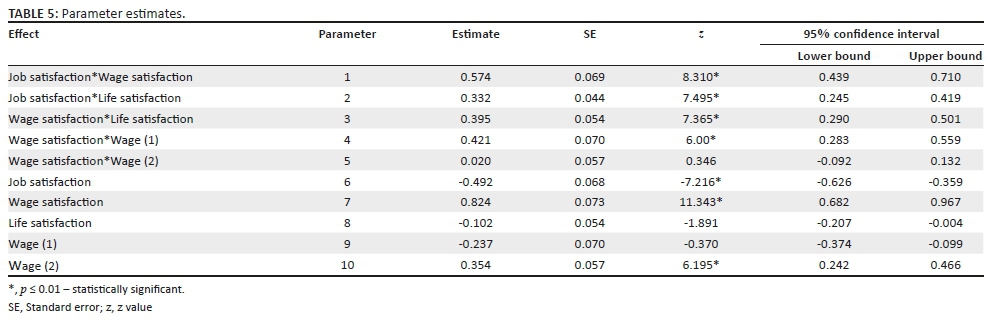
Two types of information were useful in interpreting the model, namely, parameter estimates for the model and marginal observed frequency tables for all included effects. The log-linear parameter estimate, the z-value (coefficient divided by standard error) and confidence intervals for estimates are reported in Table 5. Because life satisfaction, job satisfaction and wage satisfaction had only two levels of each variable, each effect was summarised by a single parameter value where one level of the effect had the positive value of the parameter and the other the negative value of the parameter. Effects with the largest standardised parameter estimates (z) held the most importance in influencing frequency in a cell (Field, 2013; Tabachnick & Fidell, 2014).
The strongest predictor of cell size was wage satisfaction (z = 11.343). The least predictive of all the effects in the model was the interaction between wage satisfaction and wage category. Parameter estimates indicated the relative strength of the effects.
Table 6 summarises significance tests and their confidence intervals (see Smithson, 2003). Note that the expected value of chi-square when the null hypothesis is true is equal to the degrees of freedom.
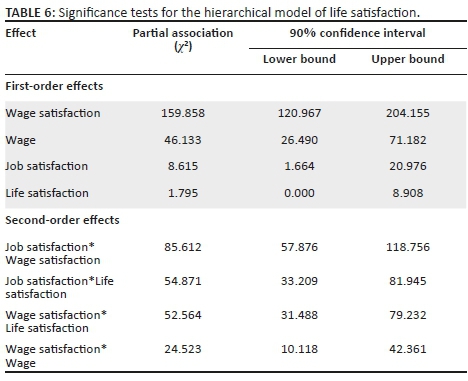
While Table 2 gave us an indication that one- and two-way interactions significantly affected model fit, partial associations could show which interactions affected the model. Firstly, from Table 6, it was clear that removing the variables being studied would significantly affect the data. Secondly, the table showed that job satisfaction and wage satisfaction, job satisfaction and life satisfaction, and wage satisfaction and life satisfaction significantly affected the model. The relation between wage satisfaction and wages was the only direct income relationship that affected the data. From the c2 values, it was also clear that the satisfaction interactions had a much greater effect on the model than the wage interaction.
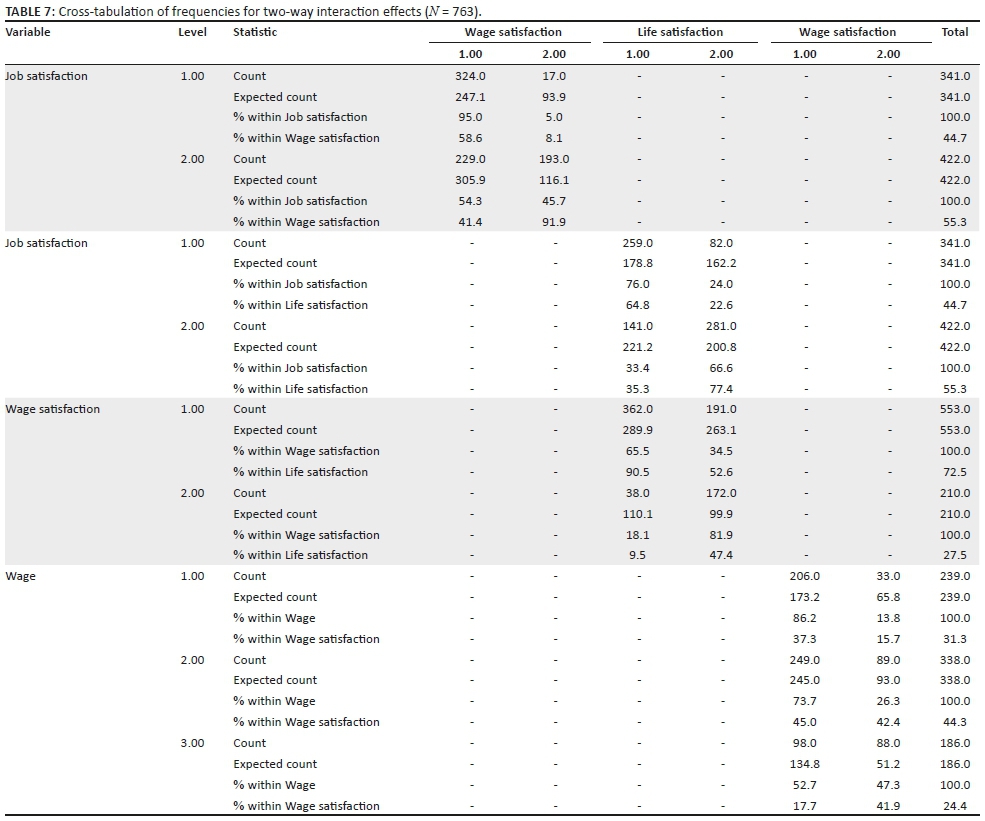
Table 7 shows cross-tabulations among the significant associations in the model.
As far as the association between job satisfaction and wage satisfaction was concerned, most of the participants who reported job dissatisfaction (95%) also reported dissatisfaction with their wages. A slight majority of those who were satisfied with their jobs (54.3%) were dissatisfied with their wages. If wage satisfaction was high, only 45.7% of the participants showed high job satisfaction. Therefore, although job satisfaction and wage satisfaction were strongly related at a low level of wage satisfaction, fewer people were satisfied with their jobs at a high (compared to a low) wage satisfaction level.
Regarding the association between job satisfaction and life satisfaction, most participants who reported low job satisfaction (76%) also reported dissatisfaction with their lives. Although most of the participants (66.6%) who reported job satisfaction also reported satisfaction with their lives, 33.4% of those who were satisfied with their jobs were not satisfied with their lives. Therefore, although job and life satisfaction were strongly related at a low job satisfaction level, relatively fewer people were satisfied with their lives at a high job satisfaction level.
Concerning the association between wage satisfaction and life satisfaction, 65.5% of the participants who were dissatisfied with their wages were dissatisfied with their lives. At a high level of wage satisfaction, 81.9% of the participants were satisfied with their lives. Therefore, wage dissatisfaction was associated with dissatisfaction with life, but wage satisfaction was even more strongly associated with life satisfaction at a high level of wage satisfaction.
With regard to the relation between wage category and wage satisfaction, most of the participants in the low gross wage category (86.19%) reported low wage satisfaction. Only 13.8% of the participants in the low gross wage category reported high wage satisfaction. Furthermore, in the high wage category, 47.3% of the participants reported high wage satisfaction. However, it should be noted that 52.7% of the participants in the high wage category were dissatisfied with their wage.
The results of this study showed that gross wage was associated with dissatisfaction with wage at a low wage level. However, at a high wage level, this association was much weaker. Job dissatisfaction was associated with dissatisfaction with life at a low level of job satisfaction. However, at a high level of job satisfaction, the association between job and life satisfaction was substantially lower. Wage satisfaction was strongly associated with life satisfaction. Wage dissatisfaction was strongly associated with job dissatisfaction when the wage satisfaction level was low. However, at a high wage satisfaction level, job satisfaction was less strongly associated with wage satisfaction.
High wage and high wage satisfaction did not compensate for lower job satisfaction in affecting life satisfaction. The results showed that of the people who experienced low job satisfaction, 19 (of the expected 26 cases) experienced high life satisfaction when gross wage was high. A total of 31 people (compared to an expected number of 19 cases) who experienced low job satisfaction experienced high life satisfaction when gross wage was low. The hierarchical log-linear analysis also confirmed that interaction did not exist among gross wage, wage satisfaction, job satisfaction and life satisfaction.
Discussion
This study aimed to examine the relationships among gross wage, wage satisfaction, job satisfaction and life satisfaction. The results provided support for the expected relationships between wage category and wage satisfaction (at a low wage category), wage satisfaction and job satisfaction (at a low level of job satisfaction), job satisfaction and life satisfaction (at a low level of job satisfaction) and wage satisfaction and life satisfaction (at a high level of life satisfaction). These results are not surprising, as previous studies found a link between wages, wage satisfaction, job satisfaction and life satisfaction (Boodoo et al., 2014; Brown, Gardner, Oswald, & Qian, 2008; Cheung & Lucas, 2015; Lucas & Schimmack, 2009). Several studies indicated that an individual's wages compared to others contributed more to his or her life satisfaction than an absolute value, as measured in this study. However, various interaction effects were found.
There is a gap in research examining the relationship between job satisfaction and wage satisfaction. Schreurs, Guenter, Van Emmerik, Notelaers and Schumacher (2015) found that a relationship existed between wage satisfaction and job satisfaction. Given that wages are linked to both wage satisfaction (Smith, 2015) and job satisfaction (Duffy et al., 2015) in the literature, it stands to reason that a relationship may exist between these two constructs. Our results confirmed the hypothesis that job satisfaction and wage satisfaction are strongly associated but specifically at a low level of wage satisfaction. However, this association was significantly less at a high level of wage satisfaction: Employees who earned more were not necessarily also satisfied with their jobs. Only 45.7% of the participants showed high job satisfaction when wage satisfaction was high, while 95% showed dissatisfaction with their jobs when their wage satisfaction was low.
The level of gross wage did play an important role in the statistical model but specifically in terms of its interaction with wage satisfaction. The results indicated that wages and wage satisfaction were related; therefore, wage satisfaction was likely to rise if wages increased. Lawler's model supports the link between wages and wage satisfaction by conceptualising wage satisfaction as the discrepancy between the perceived wage that one should receive and the wage one receives (Dyer & Theriault, 1976; Porter & Lawler, 1968). A low wage relates to low wage dissatisfaction, but a high wage does not guarantee high wage satisfaction. Our results showed that most of the participants in the low gross wage category (86.19%) reported low wage satisfaction. Only 13.8% of the participants in the low gross wage category reported high wage satisfaction. However, 52.7% of the participants in the high wage category were dissatisfied with their wage.
It is unlikely that an individual would be more satisfied with his or her job purely because he or she is paid a higher wage. This relationship was based on the argument that wages predicted job satisfaction (Carr & Mellizo, 2013; Duffy et al., 2015; Meyerding, 2015; Ross, Young, Sturts, Kim, & Ross, 2014). Several authors assert that wages are the most important predictor of job satisfaction (Lydon & Chevalier, 2002; Schweitzer et al., 2013). Miller (2014) states that wages are consistently rated as the top or second most important aspect of job satisfaction across generations. Yang and Wang (2013) did not necessarily view wages as a predictor but still found that wages had a significant impact on job satisfaction. Research has also shown that individuals report lower job satisfaction in low wage categories (Kara & Murrmann, 2011). It seems that job satisfaction is not only related to current wages.
In terms of the two-factor theory of job satisfaction, wages are particularly linked to extrinsic job satisfaction, which reduces job dissatisfaction rather than promotes job satisfaction (Goetz et al., 2012). The results showed a decrease in job dissatisfaction as wages increased (from 42.1% in the low wage category to 14.3% in the high wage category). However, on closer inspection, the percentage of people in the high wage category was low, regardless of job satisfaction (23.4% in the high wage category when job satisfaction was high), when life satisfaction was low.
Judge et al. (2005) showed that a relationship exists between job satisfaction and life satisfaction. This study confirmed that most participants who reported low job satisfaction (76%) also reported dissatisfaction with their lives. However, an interaction between job satisfaction and life satisfaction was found: While most participants (66.6%) who reported job satisfaction also reported life satisfaction, more than a third of the participants who were satisfied with their jobs were not satisfied with their lives. Fewer people than expected who were satisfied with their jobs were also satisfied with their lives when their job satisfaction level was high.
Life satisfaction among employees refers to their expectations and how well these are fulfilled, which again gives credence to the idea that an increase in wage satisfaction should result in an increase in life satisfaction (Clark et al., 2008; Easterlin & Angelescu, 2009; Rojas & Veenhoven, 2013). Other studies suggested that there was no direct link between life satisfaction and wages. While dealing primarily with interactions at a national level, the Easterlin paradox is perhaps the best known and most contested of such studies (Sacks et al., 2010, 2012; Stevenson & Wolfers, 2013). Our results showed a direct link between wage satisfaction and life satisfaction, indicating that one's wage satisfaction affected one's satisfaction with one's life (Rojas, 2006). A total of 65.5% of the participants who were dissatisfied with their wages were dissatisfied with their lives. However, even more participants (81.9%) with a high level of wage satisfaction were satisfied with their lives. Our results revealed that wage satisfaction was related to job satisfaction.
This study could not find evidence for three- or four-way effects between wage category, wage satisfaction, job satisfaction and life satisfaction. Inspection of the results confirmed that no such interaction effect exists, even when only wage category was included (i.e. when we did not consider wage satisfaction). Therefore, it seems that a high wage and wage satisfaction did not compensate for job dissatisfaction in impacting life satisfaction.
Conclusion
Implications for management
The results of this study showed that wage satisfaction, job satisfaction and life satisfaction were related. Therefore, if organisations want to reap the benefits of a satisfied workforce, they must focus on all three of these areas. This study, furthermore, showed that a wage that satisfied employees might affect employees' life satisfaction. The findings of this study have implications for managers in organisations. Firstly, managers should attend to the perceptions of wage dissatisfaction at low wage levels. Such dissatisfaction may have a negative impact on the job and life satisfaction of employees. Secondly, managers should realise that employees in the high wage category are not necessarily satisfied with their wages.
Limitations of the study and recommendations for future research
The study utilised convenience sampling methods, and as such its results might not be generalisable to the general population. It did not examine how biographical factors might affect the specified model; future studies could focus on factors such as age, gender, education or geographic region that might affect the relationships among gross wage, job satisfaction and life satisfaction. Furthermore, this study did not consider job type or situational factors; it might be useful to examine whether the position an employee holds in a company would affect the relationship between gross wage and satisfaction. As with most studies examining wages and life satisfaction, this study could only comment on the correlations among variables. Future studies should make use of longitudinal designs to assess whether wage and wage satisfaction interact with job satisfaction to affect life satisfaction.
Acknowledgements
Competing interests
The author declares that they have no financial or personal relationships that may have inappropriately influenced them in writing this article.
Authors' contribution
J.A.D.C. wrote the literature review and interpreted the results. S.R. conducted the statistical analyses, reported the results and edited the manuscript. M.W.S. provided inputs for the literature study and the interpretation of the findings.
References
Al-Zawahreh, A., & Al-Madi, F. (2012). The utility of equity theory in enhancing organizational effectiveness. European Journal of Economics, Finance and Administrative Sciences, 46, 158-170. [ Links ]
Arampatzi, E., Burger, M. J., & Veenhoven, R. (2015). Financial distress and happiness of employees in times of economic crisis. Applied Economics Letters, 22(3), 173-179. https://doi.org/10.1080/13504851.2014.931916 [ Links ]
Böckerman, P., Ilmakunnas, P., & Johansson, E. (2011). Job security and employee well-being: Evidence from matched survey and register data. Labour Economics, 18(4), 547-554. https://doi.org/10.1016/j.labeco.2010.12.011 [ Links ]
Boodoo, U., Gomez, R., & Gunderson, M. (2014). Relative income, absolute income and the life satisfaction of older adults: Do retirees differ from the non-retired? Industrial Relations Journal, 45(4), 281-299. https://doi.org/10.1111/irj.12052 [ Links ]
Brown, G. D., Gardner, J., Oswald, A. J., & Qian, J. (2008). Does wage rank affect employees' well-being? Industrial Relations: A Journal of Economy and Society, 47(3), 355-389. https://doi.org/10.1111/j.1468-232X.2008.00525.x [ Links ]
Brown, K. A., & Huber, V. L. (1992). Lowering floors and raising ceilings: A longitudinal assessment of the effects of an earnings-at-risk plan on pay satisfaction. Personnel Psychology, 45(2), 279-311. [ Links ]
Carr, M. D., & Mellizo, P. (2013). The relative effect of voice, autonomy, and the wage on satisfaction with work. The International Journal of Human Resource Management, 24(6), 1186-1201. https://doi.org/10.1080/09585192.2012.706818 [ Links ]
Chapman, D. S., Uggerslev, K. L., Carroll, S. A., Piasentin, K. A., and Jones, D. A. (2005). Applicant attraction to organizations and job choice: A meta-analytic review of the correlates of recruiting outcomes. Journal of Applied Psychology, 90, 928-944. https://doi.org/10.1037/0021-9010.90.5.928 [ Links ]
Cheung, F., & Lucas, R. E. (2014). Assessing the validity of single-item life satisfaction measures: Results from three large samples. Quality of Life Research, 23(10), 2809-2818. [ Links ]
Cheung, F., & Lucas, R. E. (2015). When does money matter most? Examining the association between income and life satisfaction over the life course. Psychology and Aging, 30(1), 120-135. https://doi.org/10.1007/s11136-014-0726-4 [ Links ]
Clark, A. E., Frijters, P., & Shields, M. A. (2008). Relative income, happiness, and utility: An explanation for the Easterlin paradox and other puzzles. Journal of Economic Literature, 46(1), 95-144. https://doi.org/10.1257/jel.46.1.95 [ Links ]
Clark, A. E., Kristensen, N., & Westergård-Nielsen, N. (2009). Job satisfaction and co-worker wages: Status or signal? The Economic Journal, 119(536), 430-447. https://doi.org/10.1111/j.1468-0297.2008.02236.x [ Links ]
Danish, R. Q., & Usman, A. (2010). Impact of reward and recognition on job satisfaction and motivation: An empirical study from Pakistan. International Journal of Business and Management, 5(2), 159-167. https://doi.org/10.5539/ijbm.v5n2p159 [ Links ]
De Neve, J. E., & Oswald, A. J. (2012). Estimating the influence of life satisfaction and positive affect on later income using sibling fixed effects. Proceedings of the National Academy of Sciences, 109(49), 19953-19958. https://doi.org/10.1073/pnas.1211437109 [ Links ]
Devereux, M. B., & Engel, C. (2003). Monetary policy in the open economy revisited: Price setting and exchange-rate flexibility. The Review of Economic Studies, 70(4), 765-783. https://doi.org/10.1111/1467-937X.00266 [ Links ]
Diener, E., & Seligman, M. (2004). Beyond money: Toward an economy of well-being. Psychological Science in the Public Interest, 5, 1-31. https://doi.org/10.1111/j.0963-7214.2004.00501001.x [ Links ]
Diener, E., Suh, E. M., Lucas, R. E., & Smith, H. L. (1999). Subjective well-being: Three decades of progress. Psychological Bulletin, 125, 276-302. https://doi.org/10.1037/0033-2909.125.2.276 [ Links ]
Dogan, U., & Çelik, E. (2014). Examining the factors contributing to students' life satisfaction. Educational Sciences: Theory & Practice, 14(6), 2121-2128. [ Links ]
Dolbier, C. L., Webster, J. A., McCalister, K. T., Mallon, M. W., & Steinhardt, M. A. (2005). Reliability and validity of a single-item measure of job satisfaction. American Journal of Health Promotion, 19(3), 194-198. https://doi.org/10.4278/0890-1171-19.3.194 [ Links ]
Dyer, L., & Theriault, R. (1976). The determinants of pay satisfaction. Journal of Applied Psychology, 61(5), 596-604. https://doi.org/10.1037/0021-9010.61.5.596 [ Links ]
Duffy, R. D., Autin, K. L., & Bott, E. M. (2015). Work volition and job satisfaction: Examining the role of work meaning and person-environment fit. The Career Development Quarterly, 63(2), 126-140. https://doi.org/10.1002/cdq.12009 [ Links ]
Easterlin, R. A., & Angelescu, L. (2009). Happiness and growth the world over: Time series evidence on the happiness-income paradox. Econstor.eu. Retrieved from http://www.econstor.eu/bitstream/10419/35652/1/597845883.pdf [ Links ]
Ferrer-i-Carbonell, A. (2005). Income and well-being: An empirical analysis of the comparison income effect. Journal of Public Economics, 89(5), 997-1019. https://doi.org/10.1016/j.jpubeco.2004.06.003 [ Links ]
Field, A. (2013). Discovering statistics using SPSS. Thousand Oaks, CA: Sage. [ Links ]
Goetz, K., Campbell, S. M., Broge, B., Dörfer, C. E., Brodowski, M., & Szecsenyi, J. (2012). The impact of intrinsic and extrinsic factors on the job satisfaction of dentists. Community Dentistry and Oral Epidemiology, 40(5), 474-480. https://doi.org/10.1111/j.1600-0528.2012.00693.x [ Links ]
Grün, C., Hauser, W., & Rhein, T. (2010). Is any job better than no job? Life satisfaction and re-employment. Journal of Labor Research, 31(3), 285-306. https://doi.org/10.1007/s12122-010-9093-2 [ Links ]
Hagerty, M. R., & Veenhoven, R. (2003). Wealth and happiness revisited - Growing national income does go with greater happiness. Social Indicators Research, 64(1), 1-27. https://doi.org/10.1023/A:1024790530822 [ Links ]
Haushofer, J., & Fehr, E. (2014). On the psychology of poverty. Science, 344(6186), 862-867. https://doi.org/10.1126/science.1232491 [ Links ]
IBM Corporation. (2015). IBM SPSS statistics: Version 23. Chicago, IL: IBM Corporation. [ Links ]
Judge, T. A., Bono, J. E., Erez, A., & Locke, E. A. (2005). Core self-evaluations and job- and life satisfaction: The role of self-concordance and goal attainment. Journal of Applied Psychology, 90(2), 257-268. https://doi.org/10.1037/0021-9010.90.2.257 [ Links ]
Judge, T. A., Locke, E. A., Durham, C. C., & Kluger, A. N. (1998). Dispositional effects on job- and life satisfaction: The role of core evaluations. Journal of Applied Psychology, 83(1), 17-34. https://doi.org/10.1037/0021-9010.83.1.17 [ Links ]
Kahneman, D., & Deaton, A. (2010). High income improves evaluation of life, but not emotional well-being. Proceedings of the National Academy of Sciences, 107(38), 16489-16493. https://doi.org/10.1073/pnas.1011492107 [ Links ]
Kara, D., & Murrmann, S. K. (2011). The effects of wage differences on employee job satisfaction in the lodging industry. Retrieved from Scholarworks.umass.edu: http://scholarworks.umass.edu/cgi/viewcontent.cgi?article=1117&context=gradconf_hospitality [ Links ]
Lee, H., & Lin, M. (2014). A study of salary satisfaction and job enthusiasm: Mediating effects of psychological contract. Applied Financial Economics, 24(24), 1577-1583. https://doi.org/10.1080/09603107.2013.829197 [ Links ]
Lucas, R. E., & Donnellan, M. B. (2012). Estimating the reliability of single-item life satisfaction measures: Results from four national panel studies. Social Indicators Research, 105(3), 323-331. https://doi.org/10.1007/s11205-011-9783-z [ Links ]
Lucas, R. E., & Schimmack, U. (2009). Income and well-being: How big is the gap between the rich and the poor? Journal of Research in Personality, 43(1), 75-78. https://doi.org/10.1016/j.jrp.2008.09.004 [ Links ]
Luhmann, M., Weiss, P., Hosoya, G., & Eid, M. (2014). Honey, I got fired! A longitudinal dyadic analysis of the effect of unemployment on life satisfaction in couples. Journal of Personality and Social Psychology, 107(1), 163-180. https://doi.org/10.1037/a0036394 [ Links ]
Lydon, R., & Chevalier, A. (2002). Estimates of the effect of wages on job satisfaction. London, United Kingdom: Centre for Economic Performance. [ Links ]
Lyubomirsky, S., King, L. A., & Diener, E. (2005). The benefits of frequent positive affect. Psychological Bulletin, 131, 803-855. https://doi.org/10.1037/0033-2909.131.6.803 [ Links ]
Mafini, C., & Dlodlo, N. (2014). The relationship between extrinsic motivation, job satisfaction and life satisfaction amongst employees in a public organisation. SA Journal of Industrial Psychology, 40(1), 1-13. https://doi.org/10.4102/sajip.v40i1.1166 [ Links ]
Meyerding, S. G. (2015). Job characteristics and job satisfaction: A test of Warr's vitamin model in German horticulture. The Psychologist-Manager Journal, 18(2), 86-107. https://doi.org/10.1037/mgr0000029 [ Links ]
Miceli, M. P., & Lane, M. C. (1990). Antecedents of pay satisfaction: A review and extension. Columbus, OH: College of Business, Ohio State University. [ Links ]
Miller, S. (2014). Why pay is driving employee satisfaction. Shrm.org. Retrieved from http://www.shrm.org/hrdisciplines/compensation/articles/pages/pay-drives-satisfaction.aspx [ Links ]
Moorman, R. H. (1993). The influence of cognitive and affective based job satisfaction measures on the relationship between satisfaction and organizational citizenship behavior. Human Relations, 46(6), 759-776. https://doi.org/10.1177/001872679304600604 [ Links ]
Oxford University Press. (2015). Utility definition. Oxford Learners Dictionaries.com. Retrieved from http://www.oxforddictionaries.com/definition/english/utility [ Links ]
Paul, S., & Guilbert, D. (2013). Income-happiness paradox in Australia: Testing the theories of adaptation and social comparison. Economic Modeling, 30, 900-910. [ Links ]
Porter, L. W., & Lawler, E. E. (1968). Managerial attitudes and performances. Homewood, IL: Dorsey Press. [ Links ]
Rojas, M. (2006). Life satisfaction and satisfaction in domains of life: Is it a simple relationship? Journal of Happiness Studies, 7(4), 467-497. https://doi.org/10.1007/s10902-006-9009-2 [ Links ]
Rojas, M., & Veenhoven, R. (2013). Contentment and affect in the estimation of happiness. Social Indicators Research, 110(2), 415-431. https://doi.org/10.1007/s11205-011-9952-0 [ Links ]
Ross, C. M., Young, S. J., Sturts, J. R., Kim, K. T., & Ross, C. M. (2014). Personal correlates impacting job satisfaction among campus recreational sport employees. International Journal of Sport Management, Recreation and Tourism, 14, 68-96. https://doi.org/10.5199/ijsmart-1791-874X-14d [ Links ]
Sacks, D. W., Stevenson, B., & Wolfers, J. (2010). Subjective well-being, income, economic development and growth (Working Paper No. 16441). Munich, Germany: National Bureau of Economic Research. [ Links ]
Sacks, D. W., Stevenson, B., & Wolfers, J. (2012). The new stylized facts about income and subjective well-being. Emotion, 12(6), 1181-1187. https://doi.org/10.1037/a0029873 [ Links ]
Saris, W. E., Veenhoven, R., Scherpenzeel, A. C., & Bunting, B. (1996). A comparative study of satisfaction with life in Europe. Budapest, Hungary: Eötvös University Press. [ Links ]
Schreurs, B., Guenter, H., van Emmerik, I. H., Notelaers, G., & Schumacher, D. (2015). Pay level satisfaction and employee outcomes: The moderating effect of autonomy and support climates. The International Journal of Human Resource Management, 26(12), 1-24. https://doi.org/10.1080/09585192.2014.940992 [ Links ]
Schweitzer, D., Chianello, T., & Kothari, B. (2013). Compensation in social work: Critical for satisfaction. Administration in Social Work, 37(2), 147-157. https://doi.org/10.1080/03643107.2012.669335 [ Links ]
Silva, J., de Keulenaer, F., & Johnstone, N. (2012). Environmental quality and life satisfaction: Evidence based on micro-data. OECD Environment Working Papers No. 44. Luxembourg: OECD Publishing, Institute for Advanced Behavioural Studies, Rue Willy Goergen. [ Links ]
Smith, J. C. (2015). Pay growth, fairness and job satisfaction: Implications for nominal and real wage rigidity. Scandinavian Journal of Economics, 117(3), 852-877. https://doi.org/10.1111/sjoe.12091 [ Links ]
Smithson, M. J. (2003). Confidence intervals. Thousand Oaks, CA: Sage. [ Links ]
Spector, P. E. (1997). Job satisfaction: Application, assessment, causes, and consequences. Thousand Oaks, CA: Sage. [ Links ]
Stevenson, B., & Wolfers, J. (2008). Economic growth and subjective well-being: Reassessing the Easterlin paradox, NBER Working Paper No. 14282. Cambridge, MA: National Bureau of Economic Research. [ Links ]
Stevenson, B., & Wolfers, J. (2008). Economic growth and subjective well-being: Reassessing the Easterlin paradox, NBER Working Paper No. 14282. Cambridge, MA: National Bureau of Economic Research. [ Links ]
Tabachnick, B. G., & Fidell, L. S. (2014). Using multivariate statistics. Essex, United Kingdom: Pearson Education. [ Links ]
Thompson, E. R., & Phua, F. T. (2012). A brief index of affective job satisfaction. Group & Organization Management, 37(3), 275-307. https://doi.org/10.1177/1059601111434201 [ Links ]
Tijdens, K., van Zijl, S., Hughie-Williams, M., van Klaveren, M., & Steinmetz, S. (2010). Codebook and explanatory note on the Wage Indicator dataset. WageIndicator.org. Retrieved from http://www.wageindicator.org/main/Wageindicatorfoundation/publications/2010/codebook-and-explanatory-notes-on-the-wageindicator-dataset [ Links ]
Veenhoven, R. (2014). The overall satisfaction with life: Subjective approaches (1). In W. Glatzer, L. Camfield, V. Møller, & M. Rojas (Eds.), Global handbook of quality of life: Exploration of well-being of nations and continents (pp. 207-238). Dordrecht, Netherlands: Springer Netherlands. [ Links ]
Welsch, H., & Kühling, J. (2014). Income comparison, income formation, and subjective well-being: New evidence on envy versus signaling. Journal of Behavioral and Experimental Economics, 59, 21-31. https://doi.org/10.1016/j.socec.2015.09.004 [ Links ]
Yang, X., & Wang, W. (2013). Exploring the determinants of job satisfaction of civil servants in Beijing, China. Public Personnel Management, 42(4), 566-587. [ Links ]
 Correspondence:
Sebastiaan Rothmann
ian@ianrothmann.com
Received: 20 May 2018
Accepted: 03 Sept. 2018
Published: 10 Jan. 2019
Note: This article is partially based on the author's dissertation for the Bachelor of Commerce Honours at the North-West University, South Africa with supervisor Prof. Marius Stander and co-supervisors Prof. Ian Rothmann and Prof. Ruut Veenhoven, received May 2016, available here: http://dspace.nwu.ac.za/bitstream/handle/10394/17115/De%20Coning_JA.pdf ?isAllowed=y&sequence=1

