


Services on Demand
Article
 English (pdf)
 Article in xml format
 Article references
Indicators

Related links
-
 Cited by Google
 -
 Similars in Google
Share

 Permalink
SA Journal of Industrial Psychology
On-line version ISSN 2071-0763
Print version ISSN 0258-5200
SA j. ind. Psychol. vol.42 n.1 Johannesburg 2016
http://dx.doi.org/10.4102/sajip.v42i1.1365
ORIGINAL RESEARCH
Bias and equivalence of the Strengths Use and Deficit Correction Questionnaire
Crizelle Els; Karina Mostert; Symen Brouwers
Work Well Research Unit, Faculty of Economic and Management Sciences, North-West University, Potchefstroom Campus, South Africa
ABSTRACT
ORIENTATION: For optimal outcomes, it is suggested that employees receive support from their organisation to use their strengths and improve their deficits. Employees also engage in proactive behaviour to use their strengths and improve their deficits. Following this conversation, the Strengths Use and Deficit Correction Questionnaire (SUDCO) was developed. However, the cultural suitability of the SUDCO has not been confirmed.
RESEARCH PURPOSE: The purpose of this study was to examine the bias and structural equivalence of the SUDCO.
MOTIVATION FOR THE STUDY: In a diverse cultural context such as South Africa, it is important to establish that a similar score on a psychological test has the same psychological meaning across ethnic groups.
RESEARCH DESIGN, APPROACH AND METHOD: A cross-sectional survey design was followed to collect data among a convenience sample of 858 employees from various occupational sectors in South Africa.
MAIN FINDINGS: Confirmatory multigroup analysis was used to test for item and construct bias. None of the items were biased, neither uniform nor non-uniform. The most restrictive model accounted for similarities in weights, intercepts and means; only residuals were different
PRACTICAL/MANAGERIAL IMPLICATIONS: The results suggest that the SUDCO is suitable for use among the major ethnic groups included in this study. These results increase the probability that future studies with the SUDCO among other ethnic groups will be unbiased and equivalent.
CONTRIBUTION: This study contributed to existing literature because no previous research has assessed the bias and equivalence of the SUDCO among ethnic groups in South Africa.
Introduction
Traditionally, organisations were almost exclusively concerned with those aspects of employees and their work that need to be improved upon. During this time, organisations were mainly focused on the development of employees' weaknesses or deficits (Carr, 2004; Slade, 2010; Wood & Tarrier, 2010). However, in recent years, research has shown that employees are organisations' greatest asset and that if they are well cared for, employees' well-being can be beneficial to the organisation (Wood, 2005). This realisation ignited the positive psychology movement that focuses on the aspects of human life that make individuals flourish (Seligman & Csikszentmihalyi, 2000). In reaction to the positive psychology movement, the positive organisational scholarship movement has emerged in an attempt to investigate the positive outcomes, processes and attributes specifically of organisations and their members. Therefore, positive organisational scholarship refers to the application of positive psychology principles within an organisational context (Cameron, Dutton & Quinn, 2003). Of particular interest in the positive organisational scholarship tradition is how employees' strengths can be applied for optimal outcomes for both the individual and the organisation (Cameron et al., 2003; Clifton & Harter, 2003).
Most scholars following the positive organisational scholarship paradigm argue that in the past there was an overemphasis on employees' deficits (French & Holden, 2012; Luthans, Youssef & Avolio, 2007). However, recent research has leaned towards an overemphasis on employee strengths (Rust, Diessner & Reade, 2009; Sirmon, Hitt, Arregle & Campbell, 2010). In reaction to this, many researchers promote an approach where the focus is neither exclusively on employees' strengths nor exclusively on their deficits, but rather an approach where their strengths can be used and their deficits be improved upon for optimal functioning at work (Boniwell, Kauffman & Silberman, 2014; Kaiser & Overfield, 2011; Quick, Cooper, Gibbs, Little & Nelson, 2010; Tweed et al., 2011). Research has confirmed the benefits of both strengths use and deficit correction. For example, previous research has found strengths use to be related to work engagement, increased happiness and increased well-being (Govindji & Linley, 2007; Linley & Harrington, 2006; Proctor, Maltby & Linley, 2011). Similarly, the improvement of deficits can increase employees' job satisfaction, reduce turnover intentions and improve organisational effectiveness (Brown, 2002; García, 2005; Pfeffer & Sutton, 2006; Schmidt, 2007).
In line with the approach where both the strengths use and deficit correction of employees are considered to be important, Van Woerkom et al. (2016) argued that strengths use and deficit correction within the work context should be viewed as a four-dimensional ideology, where both strengths and deficits should be treated with equal importance. They also reason that it is both the organisation and the individual's prerogative to use employees' strengths and to improve their deficits - that is, that organisations ought to provide employees with the necessary support to use their strengths and improve their deficits and that individuals should engage in proactive behaviour to apply their strengths and use opportunities to improve their deficits.
Based on this argument, Van Woerkom et al. (2016) conceptualised four dimensions related to strengths use and deficit improvement, namely perceived organisational support for strengths use (POSSU), perceived organisational support for deficit correction (POSDC), strengths use behaviour (SUB) and deficit correction behaviour (DCB). Following this conceptualisation, Van Woerkom et al. (2016) developed the Strengths Use and Deficit Correction Questionnaire (SUDCO) to measure POSSU, POSDC, SUB and DCB. The questionnaire was validated in a South African study. The results of the validation study showed that the SUDCO is reliable, and the factorial validity, convergent validity and predictive validity of the instrument were confirmed among a heterogeneous sample across sectors in South Africa.
Although the results of this validation study were very favourable, it is important to ensure that any measure applied to different ethnic groups is unbiased and equivalent among different ethnic groups and that meaningful cross-cultural comparisons can be made. Because of this multicultural context, the Employment Equity Act 55 of 1998, Section 8 (Government Gazette, 1998) stipulates that: 'Psychological testing and other similar assessments are prohibited unless the test or assessment being used: (1) has been scientifically shown to be valid and reliable, (2) can be applied fairly to all employees; and (3) is not biased against any employee or group'. With regard to the first requirement of the Employment Equity Act, reasonable evidence has been provided that the SUDCO is valid and reliable. The next step will be to provide evidence that the SUDCO is free from bias and equivalent across ethnic groups (He & Van de Vijver, 2012; Van de Vijver & Leung, 2011).
Research objective
Therefore, the primary objective of this study was to investigate the item bias, structural equivalence, measurement unit equivalence and scalar equivalence of the SUDCO.
Literature review
The Strengths Use and Deficit Correction Questionnaire
The SUDCO is an instrument measuring strengths use and deficit improvement within the organisational context. Based on the taxonomy of Van Woerkom et al. (2016) mentioned above, when an organisation allows its employees to use their strengths and improve their deficits at work, they may perceive the organisation as supportive. Therefore, POSSU refers to the support an employee receives from the organisation to use his/her strengths, whereas POSDC is an indication of the extent to which employees feel their organisation supports the improvement of their deficits. They further assert that it is also the individual's prerogative to engage in proactive, self-starting behaviour to use their strengths and improve their deficits. Therefore, they conceptualise SUB as employees' self-starting behaviour directed towards using their strengths in the workplace, and DCB refers to the extent to which employees engage in self-starting behaviour directed towards improving their deficits in the workplace.
Based on the conceptualisation of strengths use and deficit development, the SUDCO was developed to measure the four dimensions: POSSU, POSDC, SUB and DCB. The item development phase was completed by following the guidelines of DeVellis (2003). Preliminary items were developed and presented to experts to assess the face validity of the items. Problematic items were then excluded from the pilot instrument, and a pilot study was conducted among a heterogeneous sample (N = 241) in South Africa. After they had conducted the pilot study, the final set of items was selected for the SUDCO, which consisted of 33 items in total. More specifically, POSSU consisted of eight items, POSDC consisted of eight items, SUB was measured with nine items and DCB was measured with eight items.
The SUDCO has been validated in a South African heterogeneous sample consisting of participants from different industries. To assess the factorial validity of the SUDCO, the hypothesised four-factor structure was found to be the best fitting model when compared to competing models. The SUDCO was also proven to be reliable with Cronbach's alpha coefficients of 0.96 for POSSU, 0.93 for POSDC, 0.94 for SUB and 0.94 for DCB. Regarding the convergent validity, the two perceived organisational support dimensions of the SUDCO (i.e. POSSU and POSDC) correlated positively with three other job resources, namely colleague support, supervisory relationships and autonomy, and the SUB and DCB dimensions correlated positively with self-efficacy. The predictive validity was confirmed and it was established that all four of the SUDCO dimensions were related to work engagement and burnout (Van Woerkom et al., in process).
Bias and equivalence
Bias and equivalence are two concepts related to cross-cultural research that are deemed important for cross-cultural comparison (He & Van de Vijver, 2013). Bias is found when score differences on a particular item or construct cannot be attributed to actual differences in the underlying trait that is measured. The validity of an instrument is threatened when it is applied in different cultures. Equivalence is often described as the opposite of bias and refers to the level of comparability of scores across cultures (He & Van de Vijver, 2012, 2013; Van de Vijver & Tanzer, 2004). Equivalence (measurement invariance) refers to 'whether or not, under different conditions of observing and studying phenomena, measurement operations yield measures of the same attribute' (Horn & McArdle, 1992, p. 117). Therefore, it implies that members from different groups who have the same standing on a particular construct will score the same on a test and ascribe the same meaning to measurement items (Schmitt & Kuljanin, 2008; Steenkamp & Baumgartner, 1998). Only when the equivalence of an instrument has been confirmed will researchers be able to unambiguously interpret group differences (Horn & McArdle, 1992; Steenkamp & Baumgartner, 1998).
Van de Vijver and Tanzer (2004) identified a taxonomy of bias and equivalence and proposed three types of bias (i.e. construct bias, method bias and item bias) and three types of equivalence (i.e. construct equivalence, measurement unit equivalence and full-score equivalence).
Types of bias:
• Construct bias is present when the underlying construct that is measured does not hold the same meaning across different groups (Van de Vijver & Leung, 1997a, 1997b; Van de Vijver & Tanzer, 2004). This can be because of the possibility that the definitions of the construct across different groups vary or the behaviours associated with the construct differ across groups (Van de Vijver & Leung, 2011).
• Method bias refers to problems related to the measurement procedures used in the administration of an instrument (Van de Vijver & Tanzer, 2004). Method bias can occur for a number of reasons, including the influence of the tester and/or interviewer, communication problems, different familiarity with the content or procedures, differential response styles, differences in administration conditions, etc. (Van de Vijver & Leung, 2011).
• Item bias (the presence of differential item functioning) is mostly found as a result of the poor translation of items, ambiguous items, differences in the connotative meaning and/or appropriateness of the item content, etc. (Van de Vijver & Leung, 2011). Two types of item bias relevant to this study are uniform bias and non-uniform bias. Uniform bias is present when the bias on scores is consistently the same for all score levels on an instrument. Non-uniform bias is present when the size of the difference varies across different levels, and consequently, the bias is not identical for all score levels (Matsumoto & Van de Vijver, 2011; Mellenbergh, 1982; Van de Vijver & Leung, 1997a).
Types of equivalence:
• Construct equivalence (also known as configural invariance; Van Herk, Poortinga & Verhallen, 2005) assesses whether the same factor structure of the instrument is valid (i.e. the same number of factors, with the same items loading on each factor) for each of the groups. That is, participants from the different groups conceptualise the constructs in the same way, and the understanding of the concept is therefore not reliant on cultural context (Riordan & Vandenberg, 1994; Tayeb, 1994).
• Measurement unit equivalence (or metric invariance; Van Herk et al., 2005) provides an indication of the equivalence of the factorial loading parameters across the three ethnic groups. Therefore, the factor loadings of each item on each factor are the same for all the groups (Schmitt & Kuljanin, 2008; Steenkamp & Baumgartner, 1998; Vandenberg & Lance 2000).
• Scalar or full-score equivalence (also known as scalar invariance; Van Herk et al., 2005) tests whether the item intercepts and factor loadings are equal across groups when the same item is regressed on the latent factor (Schmitt & Kuljanin, 2008; Vandenberg, 2002; Vandenberg & Lance, 2000). If the intercepts of groups are not equal, there is the possibility of item bias (differential item functioning). The confirmation of scalar equivalence allows the researcher to safely draw the conclusion that the average scores obtained in two cultures are different or equal (Van de Vijver, 2011).
For the purpose of this study, item bias, structural equivalence (also addressing the construct bias), measurement unit equivalence and full-score equivalence of the SUDCO were examined. This study was conducted among a heterogeneous sample of participants from various organisations, each with its own work environment. Furthermore, the surveys were distributed by various individuals. Therefore, the method bias of the SUDCO was not examined, as it was difficult to control for the setting in which the measuring instrument was administered.
Research design
Research approach
This study followed a quantitative research approach. A cross-sectional research design was chosen, implying that the data were collected at one particular point in time (Saunders, Lewis & Thornhill, 2009). Because the purpose of this study was not to investigate the relationships between variables, a cross-sectional research design was deemed appropriate (Bryman et al., 2014). The study can be described as exploratory because the purpose of the study is to gain insight into some unknown territory (Fouché & De Vos, 2012).
Research method
Research participants and procedure
An availability sample of 858 employees from various sectors, including mining, banking, retail, manufacturing and education, in South Africa was drawn. Because this heterogeneous sample was free from a specific organisational context, it was deemed appropriate to assess the bias and equivalence of the SUDCO. Participation in this study was completely voluntary, and those employees who were available at their respective workplaces at the given time of questionnaire distribution were recruited. Each participant received a letter explaining the purpose of the research study. They were also assured that the results will be anonymous and confidential. After they had provided their informed consent, the participants completed the questionnaires and the researchers collected them from the participants. Some participants indicated electronic surveys as their administration mode of choice, and these individuals were sent an electronic questionnaire. Previous research has indicated that the comparison between paper and pencil versus electronic measures has been found to be relatively free from method bias (Hardré, Crowson, Xie & Ly, 2006; Rutherford et al., 2015); therefore, this was not considered to be problematic, especially because it was requested by the participants themselves. The participants were allowed to complete the questionnaires at a time and place convenient to them. Furthermore, because the instrument was distributed via paper and pencil and electronically, it was not possible to calculate a response rate in this study.
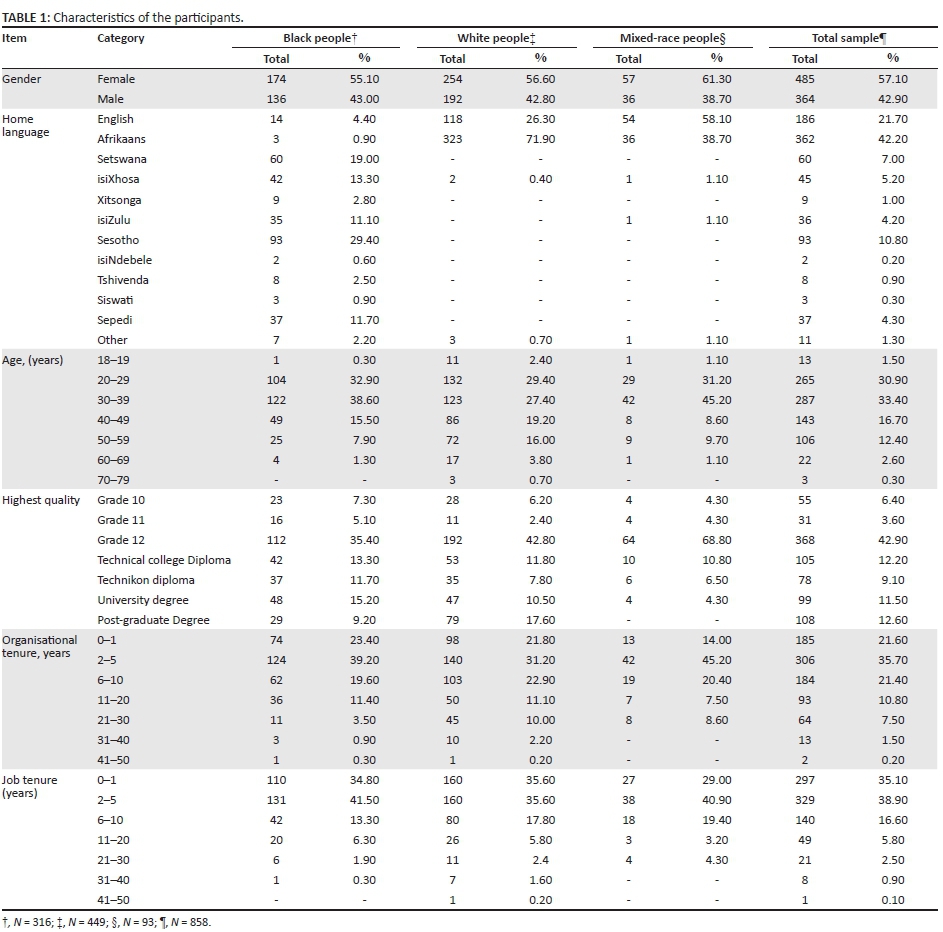
The characteristics of the participants are presented in Table 1.
The participants were from different ethnic groups with the main representations being white people (52.30%), black people (36.80%) and mixed race people (10.80%). The majority of the sample was Afrikaans speaking (42.20%), followed by English (21.70%) and African languages (35.00%). In the black people sample, the majority of the participants were Sesotho (29.40%) and Setswana (19.00%), while in the white people sample, most of the participants were Afrikaans (71.90%). The majority of the mixed-race sample consisted of English (58.10%)-speaking participants. In all ethnic groups, most of the participants held a Grade 12 qualification. Across the entire sample, 57.10% were female and 42.90% male participants. Furthermore, in all three ethnic groups, the majority of the participants were women. The mean age of the entire sample was 39.45 years with a standard deviation (SD) of 11.66 years, with the three subgroups showing no significant differences (F[42 636] = 1.31, p = 0.36). Finally, the average organisation tenure for the total sample is 7.40 years, which does not differ significantly per subgroup (F[94 636] = 1.07, p = 0.51) and specific position in the organisation is 4.91 years, which also does not differ significantly per subgroup (F[62 636] = 1.15, p = 0.45).
Measuring instruments
A biographical questionnaire was administered to determine the characteristics of the participants, including gender, ethnicity, age, language, educational level, organisational tenure and position tenure.
The SUDCO was developed by Van Woerkom et al. (2016) to measure POSSU (eight items, e.g. 'In this organisation, people can use their talents'), POSDC (eight items, e.g. 'In this organisation, employees receive training to improve their weak points'), SUB (nine items, e.g. 'In my job, I try to apply my talents as much as possible') and DCB (eight items, e.g. 'I engage in activities to develop my weak points at work'). These four constructs were measured on a 7-point Likert-type scale ranging from 0 to 6. The anchor points were labelled as follows: 0 = almost never; 1 = rarely; 2 = occasionally; 3 = sometimes; 4 = frequently; 5 = usually; 6 = almost always. The internal consistencies for each of the dimensions were good with Cronbach's alpha coefficients for POSSU = 0.96, POSDC = 0.93, SUB = 0.92 and DCB = 0.92 (Van Woerkom et al., 2016).
Statistical analysis
SPSS 22.0 (IBM SPSS, 2013) was used to conduct the descriptive statistics (means and SDs), as well as to compute the Cronbach's alpha coefficients of the SUDCO. The cut-off point of 0.70 for Cronbach's alpha coefficients was deemed satisfactory (Nunnally & Bernstein, 1994).
Functioning of the individual items (i.e. to determine the presence of uniform and non-uniform item bias) and structural equivalence of the construct (i.e. configural, metric and scalar invariance) of the SUDCO were tested simultaneously in AMOS 23 using multigroup analysis. Maximum likelihood estimation was implemented and the fit indices were considered: the χ2 statistic, the comparative fit index (CFI) and the Tucker-Lewis index (TLI), and CFI and TLI values above 0.90 were considered an acceptable fit (Byrne, 2010; Hoyle, 1995). Root mean square error of approximation (RMSEA) and the standardised root mean square residual (SRMR) were also considered, and values below 0.08 are indicative of an acceptable model fit (Browne & Cudeck, 1993). The Akaike information criterion (AIC) and sample-adjusted Bayesian information criterion (BIC) were used to compare the fit of competing models. However, it should be noted that these cut-off points should only be considered as guidelines, as there is little consensus regarding the values for adequate fit (Lance, Butts & Michels, 2006). The model fit of the configural, metric and scalar invariance models is compared to each other (metric against configural, scalar against configural and scalar against metric), and if in all cases the model significance is p ≥ 0.05, the presence of configural, metric and scalar invariance is confirmed.
Results
The results from the statistical analysis are presented in the section below. Specifically, the research questions were addressed through descriptive statistics and two steps of confirmatory factor analysis (CFA), first model definition and second group comparison. The group comparison addresses item bias and structural equivalence simultaneously.
Descriptive statistics
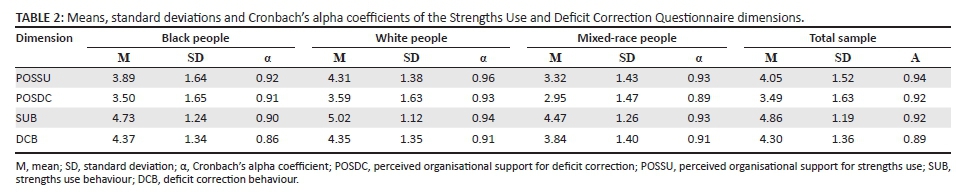
The descriptive statistics (means and SDs) as well as the Cronbach's alpha coefficients of the dimensions of the SUDCO for each ethnic group and for the total sample are presented in Table 2.
The results in Table 2 reveal that all four dimensions of the SUDCO are reliable with Cronbach's alpha coefficients above 0.70 (Nunnally & Bernstein, 1994) for all three the ethnic groups.
Confirmatory multigroup analysis
The SUDCO is designed to reflect a four-factor structure. This structure is tested in two stages. Firstly, within the total sample, the overall fit of the four-factor model is compared with one- and two-factor solutions. Secondly, fit of the four-factor solution is compared across two subgroups in the sample (the group of 93 mixed-race employees is excluded from this analysis because of insufficient group size).
Model definition
Four competing models were specified to assess the factor structure of the SUDCO. Firstly, the hypothesised four-factor model was specified with POSSU, POSDC, SUB and DCB items as distinct factors. Secondly, a one-factor model was specified that included items of all four dimensions, that is, POSSU, POSDC, SUB and DCB. Thirdly, a two-factor model (a) was specified with items from the two perceived organisational support dimensions (i.e. POSSU and POSDC) grouped together, and items from the two proactive behaviour dimensions (SUB and DCB) grouped together as the second factor. And fourthly, a second two-factor model (b) was specified, consisting of items from the two strengths dimensions (POSSU and SUB) as factor one and items from the two deficit dimensions (POSDC and DCB) as factor two. The results showed that the hypothesised four-factor model fitted the data best (χ2 = 1428.09; df = 224; p = 0.00; CFI = 0.93; TLI = 0.92; RMSEA = 0.08; SRMR = 0.05; AIC = 64183.61; BIC = 64544.78). The hypothesised model also fitted the data significantly better compared to the competing models, including the:
• one-factor model (χ2 = 7865.37; df = 230; p = 0.00; Δχ2 = 6437.28; Δdf = 6; CFI = 0.55; TLI = 0.50; RMSEA = 0.19; SRMR = 0.13; AIC = 70608.89; BIC = 70941.17);
• two-factor model (a) (χ2 = 5203.71; df = 229; p = 0.00; Δχ2 = 3775.62; Δdf = 5; CFI = 0.71; TLI = 0.68; RMSEA = 0.15; SRMR = 0.11; AIC = 67949.23; BIC = 68286.33); and
• two-factor model (b) (χ2 = 5830.97; df = 229; p = 0.00; Δχ2 = 4402.88; Δdf = 5; CFI = 0.0.67; TLI = 0.63; RMSEA = 0.16; SRMR = 0.12; AIC = 7745.70; BIC = 7853.09).
Group comparison
Item bias and construct equivalence of the SUDCO were assessed in a single confirmatory multigroup model across the white people (N = 449) and black people (N = 316) groups in the sample. The model helps determine to what extent accessibility of the items and functionality of the construct are similar across the groups. A four-factor confirmatory model was specified with properties that operationalise the possible similarities and differences in the items and SUDCO construct: measurement weights, measurement intercepts, structural means and measurement residuals. Weights and intercepts model item bias. Uniform bias is found in the intercepts: one culture might score consistently higher or lower than another culture, irrespective of the true level of the construct. Non-uniform bias is found in the regression weights of the construct on the specific items: the effect of culture is different in size for high- and low-scoring people (Van de Vijver & Poortinga, 1997). The two types of item bias can happen simultaneously or separately (Fisher, 2009; Mellenbergh, 1982; Van de Vijver & Leung, 1997a). Structural means and measurement residuals model additional properties of the construct.
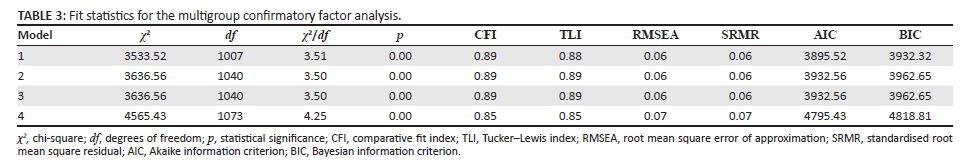
The models that contain these psychometric properties are nested, depending on whether they are being constrained across the groups. The most restrictive model (4) has all four properties constrained across the groups, (3) the next model frees the residuals while keeping the others constrained, (2) next the means are also freed, leaving only the weights and intercepts fixated across the groups and finally (1) the intercepts are freed too, leaving the weights fixated. For a multigroup CFA, a single test with a single set of fit indices shows which level of equivalence is the most fitting. Because the models are nested, comparison of their relative fit will indicate in what properties cultural bias is found. Results from the multigroup CFA are presented in Table 3.
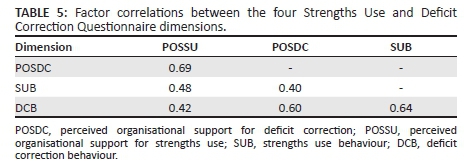
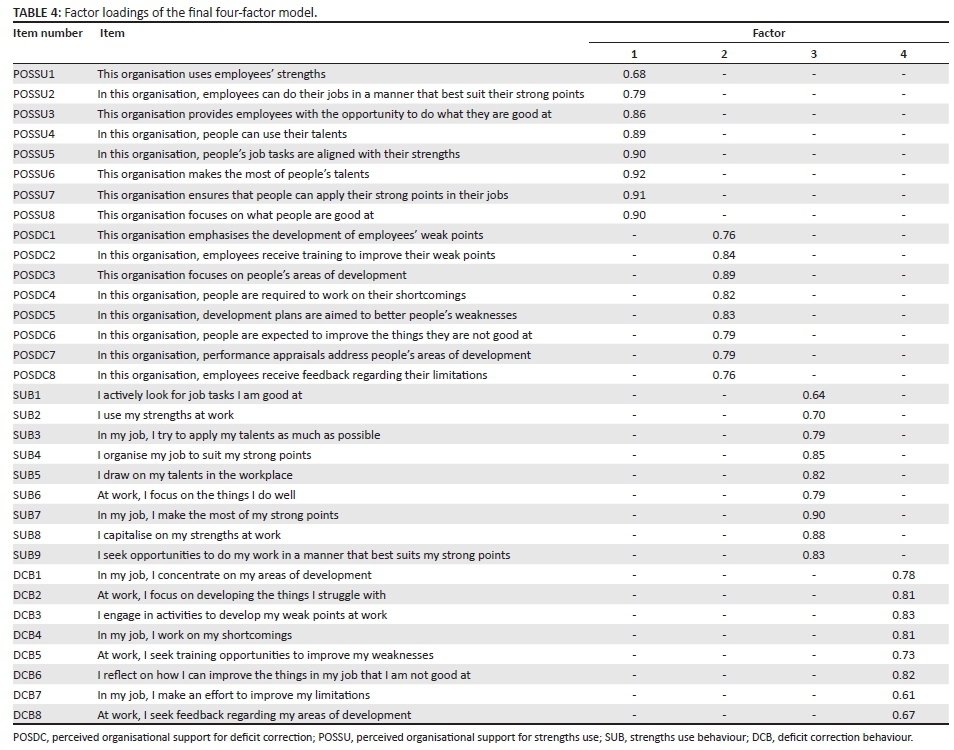
These results show that all four models fitted the data acceptably well. For all four models, the CFI and TLI show values close to 0.90 (Byrne, 2010; Hoyle, 1995) and RMSEA and SRMR values below 0.08 (Browne & Cudeck, 1993). Closer examination reveals that a model with unconstrained residuals but otherwise similar across the three groups is the most restrictive model with an adequate fit (χ2 = 3636.56; df = 1040, χ2/df = 3.50, p = 0.00; CFI = 0.89; TLI = 0.89; RMSEA = 0.06; SRMR = 0.06; AIC = 3932.56; BIC = 3962.65); direct comparison of the fully constrained model 4 with model 3 that has unfixed residuals shows that constraining residuals leads to significant loss of model fit (Δχ2 = 928.87; df = 33, p = 0.00; TLI = 0.04). The model shows similar weights and intercepts across the groups. Table 4 summarises the factor weights and Table 5 the correlations between the four dimensions.
Discussion
Outline of the results
The primary objective of this study was to assess the item bias and structural equivalence of the SUDCO. A major concern in cross-cultural, multicultural and diversity assessment is the idea of fairness. Regarding content familiarity, cognitive strategies, socialised expectations of support and the cultural construction of skills, test items might elicit a range of responses from participants. Eliminating biased items from the SUDCO is the first step to ensure fairness in assessment across different cultural or ethnic groups (Schaap, 2011). However, the equivalence of the instrument also needs to be guaranteed to ensure that the scores of different groups obtained on the construct are comparable across cultures (Van de Vijver & Leung, 1997b).
Before analysing the cross-cultural properties of the SUDCO, the expected four-factor solution was tested. It was confirmed that the SUDCO indeed measures four distinct factors that were labelled as POSSU, POSDC, SUB and DCB. Furthermore, this study found the SUDCO to reliably measure the above-mentioned four constructs with Cronbach's alpha coefficients above 0.70 (Nunnally & Bernstein, 1994).
Subsequently, a single multigroup CFA was conducted to assess item bias and construct equivalence simultaneously. The four-factor model that was tested specified measurement weights, measurement intercepts, structural means and measurement residuals of the items and latent variables to operationalise the possible similarities and differences in the items and SUDCO construct across groups. In the analysis, fit indices are produced for versions of the model in which constrains are one by one set free; the models are nested. Because of this nesting, comparison of their relative fit will indicate in what properties bias is found. In the groups tested here, not one of the SUDCO items showed any bias.
As discussed in the introduction, Van de Vijver and Tanzer (2004) distinguish between three levels of equivalence, arranged in a hierarchical order: structural, measurement and scalar equivalence. The analysis on the SUDCO in the present study shows that only residuals are not equal across groups, but that weights, means and intercepts are. While this does not indicate scalar or full-score equivalence, the presence of equivalence in means indicates that people from the groups in our sample who have the same psychological standing on the strength use and deficit correction constructs also receive the same score on the SUDCO tests. Residuals only refer to the errors attached to the scores; they do not jeopardise the scores themselves. Thus, scores on the SUDCO dimensions can be meaningfully compared across the groups. Researchers or practitioners who use the SUDCO are provided with the much desired opportunity to make accurate inferences from differences in mean scores and to do this irrespective of cultural membership.
Limitations and recommendations
A limitation of this study is that the distribution of participants across the three ethnic groups was not equal and that a convenience sampling strategy was followed. Specifically, the mixed-race group was much smaller compared to the white people and black people groups, for which reason they were not included in the multigroup CFA. Future studies should aim to include equal-sized groups. Therefore, the results of the present study should not be generalised to groups not sampled here.
Furthermore, within the South African context, it is important to consider cultural differences within each of the ethnic groups. Because we have 11 official language groups in the country, it is suggested that future research should assess the bias and equivalence of the SUDCO across different language groups or cultural groups, with a representative sample drawn from each group. It is important to note that this study only provides preliminary results of the bias and equivalence of the SUDCO. It is still suggested that the cross-cultural comparability of the instrument be ensured when using the SUDCO for academic purposes or within the organisational context. In addition, when administering the SUDCO outside South African borders, the users of the instrument are also urged to assess the bias and equivalence of the instrument within their specific context.
The analyses conducted in this study were purely statistical and do not give any suggestions as to the reasons for bias. Even though it is possible to speculate about the linguistic reasons for bias in an item, cultural constructions and mentalisations are not readily accessible by the researcher. Causes of bias might be more reasonably addressed in qualitative research, asking participants about item content and its suitability. Future research could explore this avenue for understanding more clearly reasons for bias between different groups.
Conclusion and practical implications
To conclude, the SUDCO shows good construct equivalence and not any item bias. An instrument that is free from bias and has been proven to be equivalent across ethnic cultural groups can be used with relative confidence within a multicultural context (Van de Vijver & Tanzer, 2004). Therefore, it can be expected that, when the SUDCO is used in future studies, the conclusions drawn from such studies are likely to be fairly accurate and would not discriminate against any ethnic group within the South African context. This study adds value to the literature because no previous measuring instrument has been developed and validated for the measurement of POSSU, POSDC, SUB and DCB. This study is a preliminary confirmation that the SUDCO can be used with relative confidence in a multicultural environment, implying that research is one step closer to a measure that may provide valid and reliable results of employee strengths use and deficit improvement within the work context. This also allows future research to make more accurate conclusions regarding the antecedents and outcomes of POSSU, POSDC, SUB and DCB.
Acknowledgements
The financial assistance of the National Research Foundation (NRF) towards this research is hereby acknowledged. Opinions expressed and conclusions arrived at are those of the authors and are not necessarily to be attributed to the NRF.
Competing interests
The authors declare that they have no financial or personal relationships which may have inappropriately influenced them in writing this article.
Authors' contributions
C.E. fulfilled the role of the primary researcher, and this study formed part of her PhD research. She was responsible for the conceptualisation of the article, collection of the data, the statistical analysis of the data, the interpretation of the research results and the writing of the article. K.M. acted as promoter to this study, and thus played an advisory role in this study and assisted in the conceptualisation of the study and the writing of the research article. S.B. conducted the statistical analyses and assisted with the interpretation of the research results.
References
Boniwell, I., Kauffman, C., & Silberman, J. (2014). The positive psychology approach to coaching. In E. Cox, T. Bachkirova, & D.A. Clutterbuck (Eds.), The complete handbook of coaching (2nd edn., pp. 158-171). London, England: Sage. [ Links ]
Brown, J. (2002). Training needs assessment: A must for developing an effective training program. Public Personnel Management, 31(4), 569-578. http://dx.doi.org/10.1177/009102600203100412 [ Links ]
Browne, M.W., & Cudeck, R. (1993). Alternative ways of assessing model fit. In K.A. Bollen, & J. Scott Long (Eds.), Testing structural equation models (pp. 1-9). Newbury Park, CA: Sage. [ Links ]
Bryman, A., Bell, E., Hirschsohn, P., Dos Santos, A., Du Toit, J., Masenge, A., et al. (2014). Research methodology: Business and management contexts. Cape Town, South Africa: Oxford University Press. [ Links ]
Byrne, B. (2010). Structural equation modeling with AMOS. New York: Routledge. [ Links ]
Cameron, K.S., Dutton, J.E., & Quinn, R.E. (2003). Foundations of positive organizational scholarship. In K.S. Cameron, J.E. Dutton, & R.E. Quinn (Eds.), Positive organizational scholarship: Foundations of a new discipline (pp. 3-13). San Francisco, CA: Berrett-Koehler Publishers. [ Links ]
Carr, A. (2004). Positive psychology: The science of happiness and human strengths. East Sussex, England: Brunner-Routledge. [ Links ]
Clifton, D.O., & Harter, J.K. (2003). Investing in strengths. In K.S. Cameron, J.E. Dutton, & R.E. Quinn (Eds.), Positive organizational scholarship: Foundations of a new discipline (pp. 111-121). San Francisco, CA: Berrett Koehler Publishers. [ Links ]
DeVellis, R. F. (2003). Scale development: Theory and applications. Thousand Oaks, CA: Sage Publications. [ Links ]
Fisher, C.B. (2009). Decoding the ethics code: A practical guide for psychologists. (2nd edn.). Thousands Oaks, CA: Sage. [ Links ]
Fouché, C.B., & De Vos, A.S. (2012). Formal formulations. In A.S. de Vos, H. Strydom, C.B. Fouché, & C.S.L. Delport (Eds.). Research at grass roots: For the social sciences and human service professions (4th edn., pp. 89-100). Pretoria, South Africa: Van Schaik Publishers. [ Links ]
French, S.L., & Holden, T.Q. (2012). Positive organizational behavior: A buffer for bad news. Business and Professional Communication Quarterly, 75(2), 208-220. http://dx.doi.org/10.1177/1080569912441823 [ Links ]
García, M.Ú. (2005). Training and business performance: The Spanish case. The International Journal of Human Resource Management, 16(9), 1691-1710. http://dx.doi.org/10.1080/09585190500239341 [ Links ]
Government Gazette. (1998). Republic of South Africa, Vol. 400, no. 19370, Cape Town, 19 October 1998. [ Links ]
Govindji, R., & Linley, P.A. (2007). Strengths use, self-concordance and well-being: Implications for strengths coaching and coaching psychologists. International Coaching Psychology Review, 2(2), 143-153. [ Links ]
Hardré, P.L., Crowson, H.M., Xie, K., & Ly, C. (2006). Testing differential effects of computer-based, web-based and paper-based administration of questionnaire research instruments. British Journal of Educational Technology, 38(1), 5-22. http://dx.doi.org/10.1111/j.1467-8535.2006.00591 [ Links ]
He, J., & Van de Vijver, F. (2012). Bias and equivalence in cross-cultural research. Online Readings in Psychology and Culture, 2(2), 1-19. http://dx.doi.org/10.9707/2307-0919.1111 [ Links ]
He, J., & Van de Vijver, F.J.R. (2013). Methodological issues in cross-cultural studies in educational psychology. In G.A.D. Liem, & A.B.I. Bernardo (Eds.), Advancing cross-cultural perspectives on educational psychology: A festschrift for Dennis McInerney (pp. 39-56). Charlotte, NC: Information Age Publishing. [ Links ]
Horn, J.L., & McArdle, J.J. (1992). A practical and theoretical guide to measurement invariance in aging research. Experimental Aging Research, 18(3), 117-144. http://dx.doi.org/10.1080/03610739208253916 [ Links ]
Hoyle, R.H. (1995). Structural equation modeling: Concepts, issues, and applications. Thousand Oaks, CA: Sage. [ Links ]
IBM SPSS. (2013). SPSS 22.0 [Computer software]. [ Links ] Chicago, IL: SPSS.
Kaiser, R.B., & Overfield, D.V. (2011). Strengths, strengths overused, and lopsided leadership. Consulting Psychology Journal: Practice and Research, 63(2), 89-109. http://dx.doi.org/10.1037/a0024470 [ Links ]
Lance, C.E., Butts, M.M., & Michels, L.C. (2006). The sources of four commonly reported cutoff criteria: What did they really say? Organizational Research Methods, 9(2), 202-220. http://dx.doi.org/10.1177/1094428105284919 [ Links ]
Linley, P.A., & Harrington, S. (2006). Strengths coaching: A potential-guided approach to coaching psychology. International Coaching Psychology Review, 1(1), 37-46. [ Links ]
Luthans, F., Youssef, C.M., & Avolio, B.J. 2007. Psychological capital: Developing the human competitive edge. Oxford, UK: Oxford University Press. [ Links ]
Matsumoto, D., & Van de Vijver, F.J.R. (2011). Cross-cultural research methods in psychology. New York: Cambridge University Press. [ Links ]
Mellenbergh, G.J. (1982). Contingency table models for assessing item bias. Journal of Educational and Behavioral Statistics, 7(2), 105-118. http://dx.doi.org/10.3102/10769986007002105 [ Links ]
Nunnally, J.C., & Bernstein, I.H. (1994). Psychometric theory. New York: McGraw-Hill. [ Links ]
Pfeffer, J., & Sutton, R.I. (2006). Evidence-based management. Harvard Business Review, 84(1), 62-74. [ Links ]
Proctor, C., Maltby, J., & Linley, P.A. (2011). Strengths use as a predictor of well-being and health-related quality of life. Journal of Happiness Studies, 12(1), 153-169. http://dx.doi.org/10.1007/s10902-009-9181-2 [ Links ]
Quick, J.C., Cooper, C.L., Gibbs, P.C., Little, L.M., & Nelson, D.L. (2010). Positive organizational behavior at work. In G.P. Hodgkinson, & J.K. Ford (Eds.), International review of industrial and organizational psychology, Vol. 25 (pp. 253-291). West Sussex, UK: Wiley. [ Links ]
Riordan, C.M., & Vandenberg, R.J. (1994). A central question in cross-cultural research: Do employees of different cultures interpret work-related measures in an equivalent manner? Journal of Management, 20(3), 643-671. http://dx.doi.org/10.1177/014920639402000307 [ Links ]
Rust, T., Diessner, R., & Reade, L. (2009). Strengths only or strengths and relative weaknesses? A preliminary study. The Journal of Psychology: Interdisciplinary and Applied, 143(5), 465-476. http://dx.doi.org/10.3200/JRL.143.5.465-476 [ Links ]
Rutherford, C., Costa, D., Mercieca-Bebber, R., Rice, H., Gabb, L., & King, M. (2016). Mode of administration does not cause bias in patient-reported outcome results: A meta-analysis. Quality of Life Research, 25(3), 559-574. [ Links ]
Saunders, M., Lewis, P., & Thornhill, A. (2009). Research methods for business students. (5th edn.). Harlow, England: Pearson Education Ltd. [ Links ]
Schaap, P. (2011). The differential item functioning and structural equivalence of a nonverbal cognitive ability test for five language groups. SA Journal of Industrial Psychology, 37(1), 1-16. http://dx.doi.org/10.4102/sajip.v37i1.881 [ Links ]
Schmidt, S.W. (2007). The relationship between satisfaction with workplace training and overall job satisfaction. Human Resource Development Quarterly, 18(4), 481-498. http://dx.doi.org/10.1002?hrdq.1216 [ Links ]
Schmitt, N., & Kuljanin, G. (2008). Measurement invariance: Review of practice and implications. Human Resource Management Review, 18(4), 210-222. http://dx.doi.org/10.1016/j.hrmr.2008.03.003 [ Links ]
Seligman, M.E.P., & Csikszentmihalyi, M. (2000). Positive psychology: An introduction. American Psychologist, 55(1), 5-14. http://dx.doi.org/10.1037//0003-066X.55.1.5 [ Links ]
Sirmon, D.G., Hitt, M.A., Arregle, J.L., & Campbell, J.T. (2010). The dynamic interplay of capability strengths and weaknesses: Investigating the bases of temporary competitive advantage. Strategic Management Journal, 31(13), 1386-1409. http://dx.doi.org/10.1002/smj.893 [ Links ]
Slade, M. (2010). Mental illness and well-being: The central importance of positive psychology and recovery approaches. BMC Health Services Research, 10(1), 1-14. http://dx.doi.org/10.1186/1472-6963-10-26 [ Links ]
Steenkamp, J.B.E., & Baumgartner, H. (1998). Assessing measurement invariance in cross-national consumer research. Journal of Consumer Research, 25(1), 78-107. http://dx.doi.org/10.1086/209528 [ Links ]
Tayeb, M. (1994). Organizations and national culture: Methodology considered. Organization Studies, 15(3), 429-445. http://dx.doi.org/10.1177/017084069401500306 [ Links ]
Tweed, R.G., Bhatt, G., Dooley, S., Spindler, A., Douglas, K.S., & Viljoen, J.L. (2011). Youth violence and positive psychology: Research potential through integration. Canadian Psychology/Psychologie Canadienne, 52(2), 111-121. http://dx.doi.org/10.1037/a0020695 [ Links ]
Vandenberg, R.J. (2002). Toward a further understanding of and improvement in measurement invariance methods and procedures. Organizational Research Methods, 5(2), 139-158. http://dx.doi.org/10.1177/1094428102005002001 [ Links ]
Vandenberg, R.J., & Lance, C.E. (2000). A review and synthesis of the measurement invariance literature: Suggestions, practices, and recommendations for organizational research. Organizational Research Methods, 3(1), 4-70. http://dx.doi.org/10.1177/109442810031002 [ Links ]
Van de Vijver, F.J.R. (2011). Capturing bias in structural equation modeling. In E. Davidov, P. Schmidt, & J. Billiet (Eds.), Cross-cultural analysis: Methods and applications (pp. 3-34). New York: Routledge. [ Links ]
Van de Vijver, F.J.R., & Leung, K. (1997a). Methods and data analysis of comparative research. In J. Berry, Y.H. Poortinga, & J. Pandey (Eds.), Handbook of cross-cultural psychology (2nd edn., pp. 257-300). Boston, MA: Allyn & Bacon. [ Links ]
Van de Vijver, F.J.R., & Leung, K. (1997b). Methods and data analysis for cross-cultural research. Newbury Park, CA: Sage. [ Links ]
Van de Vijver, F.J.R., & Leung, K. (2011). Equivalence and bias: A review of concepts, models, and data analytic procedures. In D. Matsumoto, & F.J.R. van de Vijver (Eds.), Cross-cultural research methods in psychology (pp. 17-45). New York: Cambridge University Press. [ Links ]
Van de Vijver, F.J.R., & Poortinga, Y.H. (1997). Towards an integrated analysis of bias in cross-cultural assessment. European Journal of Psychological Assessment, 13(1), 29-37. http://dx.doi.org/10.1027/1015-5759.13.1.29 [ Links ]
Van de Vijver, F.J.R., & Tanzer, N.K. (2004). Bias and equivalence in cross-cultural assessment: An overview. Revue Européenne de Psychologie Appliquée/European Review of Applied Psychology, 54(2), 119-135. http://dx.doi.org/10.9707/2307-0919.1111 [ Links ]
Van Herk, H., Poortinga, Y.H., & Verhallen, T.M. (2005). Equivalence of survey data: Relevance for international marketing. European Journal of Marketing, 39(3/4), 351-364. http://dx.doi.org/10.1108/03090560510581818 [ Links ]
Van Woerkom, M., Mostert, K., Els, C., Bakker, A.B., De Beer, L.T., & Rothmann, S. (2016). Strengths use and deficit correction in organizations: Development and validation of a questionnaire. European Journal of Work and Organizational Psychology. 1-16. http://dx.doi.org/10.1080/1359432X.2016.1193010 [ Links ]
Wood, A.M., & Tarrier, N. (2010). Positive clinical psychology: A new vision and strategy for integrated research and practice. Clinical Psychology Review, 30(7), 819-829. http://dx.doi.org/10.1016/j.cpr.2010.06.003 [ Links ]
Wood, B. (2005). Towards innovative building maintenance. Structural Survey, 23(4), 291-297. http://dx.doi.org/10.1108/02630800510630466 [ Links ]
 Correspondence:
Crizelle Els
crizelle.els@nwu.ac.za
Received: 14 Apr. 2016
Accepted: 21 July 2016
Published: 01 Nov. 2016

