


Services on Demand
Article
 English (pdf)
 Article in xml format
 Article references
Indicators

Related links
-
 Cited by Google
 -
 Similars in Google
Share

 Permalink
SA Journal of Industrial Psychology
On-line version ISSN 2071-0763
Print version ISSN 0258-5200
SA j. ind. Psychol. vol.39 n.2 Johannesburg Jan. 2013
ORIGINAL RESEARCH
The development of the MACE work-family enrichment instrument
Marissa de KlerkI; Jan Alewyn NelI; Carin HillII; Eileen KoekemoerI
ISchool of Human Resource Management, North-West University, Potchefstroom Campus, South Africa
IIDepartment of Industrial Psychology and People Management, University of Johannesburg, South Africa
ABSTRACT
ORIENTATION: An instrument based on a theoretical model is necessary to measure the positive side of the work-family interface.
RESEARCH PURPOSE: To develop items for measurement of work-family enrichment based on the elements contained within a theoretical model and to evaluate the latent trait functioning of these items.
MOTIVATION FOR THE STUDY: Major limitations exist regarding the conceptualisation and scale development of the positive side of the work-family interface.
RESEARCH DESIGN, APPROACH, AND METHOD: A quantitative research approach using scale development procedures was employed to develop the 95-item instrument. A cross-sectional survey design was used to collect data randomly from selected employees; data were processed using Rasch analysis.
MAIN FINDINGS: The five-category scale works well for the most part, although a four-category scale could be considered. Thirty-five items either over-fitted or under-fitted the work-family enrichment model. Person ability was measured in the low to middle ranges of work-family enrichment. Participants' experience of work-family enrichment could be represented accurately. Sub-scale items displayed misfit, bias or both.
PRACTICAL/MANAGERIAL IMPLICATIONS: The developed instrument can be investigated further to identify work-family enrichment factors that can measure workers' experience of enrichment in their work and family domains.
CONTRIBUTION/VALUE-ADD: This study furthers theory building and empirical research in industrial psychology, by developing a new theory-based measuring instrument for the positive side of the work-family interface in the South African context. This study expanded on the model proposed by Greenhaus and Powell, by including all five categories of resources gains. Furthermore, the total of the resources was diversified, since some of the content of these resources encompasses multiple meanings.
Introduction
Background to the study
Due to the increase of women in the workforce, dual-career couples, single-parent households and fathers who are actively involved in parenting, employees may find it difficult to combine their work and family obligations (Paoli, 1997; Polach, 2003; Schreuder & Theron, 2001). Employees can experience a certain degree of conflict between the two domains (i.e. work and family). In the past few decades, research on work-family interaction focused almost exclusively on the negative impact of work on the family situation (i.e. work-family conflict). There is a growing awareness that work and family roles may have beneficial and reciprocal effects on one another and that focusing heavily on the negative side has left a gap in our understanding of the work-family interface (Grzywacz, 2000; Parasuraman & Greenhaus, 2002; Rothbard, 2001; Voydanoff, 2002). Therefore, it seems necessary to investigate the positive side of the work-family interface.
The work-family enrichment model offers the broadest conceptualisation of the positive side of the work-family interface (McNall, Nicklin & Masuda, 2010). The model was developed by Greenhaus and Powell in 2006 (see Greenhaus & Powell, 2006) and is bidirectional in nature (Greenhaus & Allen, 2011). This means that it measures to what extent certain resources gained from an individual's work life can improve that person's family life, as well as to what extent resources gained from family life improve the work life in turn. The model consists of two main components that outline the theoretical framework of work-family enrichment: (1) the resources generated in work and family roles and (2) the paths that promote work-family enrichment in each role (Greenhaus & Powell, 2006).
A resource can be described as: 'an asset that may be drawn on when needed to solve a problem or cope with a challenging situation' (Greenhaus & Powell, 2006, p. 80). Greenhaus and Powell (2006) identified five types of resources to promote enrichment: (1) skills and perspectives, referring to cognition, interpersonal and multi-tasking skills and ways of defining problems or situations, (2) psychological and physical resources, referring to self-esteem, optimism, physical health, (3) social-capital resources, referring to influence and information derived from interpersonal relationships in work and family roles, (4) flexibility, referring to discretion in the timing, pace and location at which role requirements are met, and (5) material resources, referring to money and gifts derived from the work or family domains.
These resources may have an instrumental or affective effect on a person's work and family life. Resources generated in Role A can promote a high performance and positive affect (or positive emotions and attitude) in Role B (Carlson, Kacmar, Wayne & Grzywacz, 2006; Greenhaus & Powell, 2006). Firstly, a resource (skills and perspectives, psychological and physical, socio-capital, flexibility and material) can be transferred directly from Role A to Role B, thereby enhancing performance in Role B (Greenhaus & Powell, 2006). This process is referred to as the instrumental path, because the application of a resource has a direct instrumental effect on performance in another role (Greenhaus & Powell, 2006). Furthermore, a resource generated in Role A can promote positive affect (or positive emotions and attitude) within Role A, which, in turn, produces high performance and positive affect in Role B. This process is referred to as the affective path (Greenhaus & Powell, 2006). Empirical evidence supports the existence of these two paths through which resources are transferred in both directions: both the direct instrumental path (Hunter, Perry, Carlson & Smith, 2010; Weer, Greenhaus & Linnehan, 2010) and the indirect affective path (Siu et al., 2010).
According to Carlson et al. (2006), as well as Hanson, Hammer and Colton (2006), constructs such as work-family positive spillover, work-family enhancement and work-family facilitation can all be categorised under the concept of work-family enrichment. Both concepts of work-family enrichment and of work-family positive spillover incorporate the notion that experiences or resources in one domain (work or family) can be transferred (spilled over) to the other domain (family or work) (see Edwards & Rothbard, 2000; Greenhaus & Powell, 2006; Grzywacz & Marks, 2000; Hanson et al, 2006). Work-family enrichment, however, requires more than the transfer (i.e. spillover) of experiences or resources from one domain to the other. The transfer should also be applied successfully in a way that leads to improved performance or affect for the individual (Powell & Greenhaus, 2006).
On the other hand, work-family enrichment and work-family facilitation are more closely linked, since the facilitation focuses on the positive outcomes of the work-family interface. However, enrichment entails more than improvement in the role-performance of individuals' lives-(Wayne, Grzywacz, Carlson & Kacmar, 2007); it focuses on the individual and on the resources that assist improvement in their work or family life, whilst facilitation focuses on the system as such (i.e. work or family). Facilitation on the other hand aims at improving the entire system's functioning for the individual (Wayne et al., 2007). By focusing more on the individual level, researchers may get a clearer picture of the person's experiences and resources that may spill over across domains, leading to enhanced functioning in both domains and therefore a better quality of life.
In comparison to these aforementioned theories, it therefore appears that work-family enrichment is a very comprehensive construct that is based on a sound theoretical model. Since no other comprehensive model thus far deals with the positive work-family interface, it has been recommended that measuring instruments for the positive work-family interface be developed that are based on the work-family enrichment model (Carlson & Grzywacz, 2008; Carlson et al., 2006; Greenhaus & Powell, 2006). Such an instrument will be useful in distinguishing the enrichment construct from other positive work-family interface constructs. The instrument will also be helpful in representing the benefits gained by combining work and family domains, which could result in a better quality of life for the individual. Moreover, the results of employing such an instrument could be utilised for further theory building and future research on the positive side of the work-family interface.
What will follow?
Against this background, this article aims to explore the measurement of work-family enrichment. This is done by investigating the advantages and shortcomings of an existing instrument measuring work-family enrichment, and by discussing the relevance of work-family enrichment in the workplace.
Measurement of work-family enrichment
Carlson et al. (2006) presented the first empirically valid 18-item self-report measure for work-family enrichment, namely the Work-Family Enrichment Scale (WFES). The WFES captures the extent to which resource gains that are experienced in one domain are transferred to the other domain in ways that lead to improved quality of life in one role for the individual (Carlson et al., 2006). Besides taking the direction of work-family enrichment (WFE) into account, Carlson et al. identified three dimensions associated with each direction. The three dimensions for work to family are: (1) development, (2) affect and (3) capital; the three dimensions from family to work are: (1) development, (2) affect and (3) efficiency.
Prior research using the dimensions from the WFES has provided some empirical support for relations to antecedents, such as job and home resources, as well as for consequences, such as satisfaction experienced in the different spheres: life, job, family and career. Antecedent factors of enrichment consist of individual and environmental characteristics, which contribute to the acquisition and effective transfer of resources across domains (Carlson et al., 2006). It was found that autonomy as a job resource is not as closely related to WFE capital as is the case with development and affect, whilst the relationship with a supervisor was found to be more closely related to affect and capital than to development (McNall et al., 2010). Family and home support as a resource was positively related to family-work enrichment (FWE) (Bhargava & Baral, 2009). Regarding the study of consequences, there are unfortunately not enough studies to examine the relationship between FWE and life satisfaction (McNall et al., 2010). However, both WFE and FWE showed a positive relationship with job satisfaction and family satisfaction (Bhargava & Baral, 2009; McNall et al., 2010). In South Africa, a study employing the WFES instrument found that family satisfaction is positively related to all three sub-constructs of FWE, whilst both career and job satisfaction were positively related to all three sub-constructs of WFE (Jaga & Bagraim, 2011).
The WFES offers several advantages of measuring work-family enrichment:
1. It includes both work-to-family and family-to-work directions.
2. It captures the complexity of the construct of work-family enrichment by including resources gained in one domain, their transfer to another domain, and their successful application within the receiving domain, which is represented by enhanced functioning.
3. It was developed systematically to take into account multiple dimensions of potential enrichment.
4. It uses established methodological procedures to develop the scale.
5. The scale was tested across five samples.
6. It was validated in various ways.
7. It has been assessed in relation to potential antecedents and consequences as suggested in the existing literature.
The WFES is therefore currently seen as the strongest instrument for measuring the positive side of the work-family interface from the literature because of the instrument's theoretical foundation and its reported solid evidence of validity and reliability (Carlson et al., 2006; Carlson & Grzywacz, 2008; Jaga & Bagraim, 2011; McNall et al., 2010; Stoddard & Madsen, 2007).
There are a few concerns about employing the WFES. Firstly, each item seems to convey different elements and not a singular idea (Carlson & Grzywacz, 2008). For example, the item 'My involvement in my work makes me cheerful and this helps me to be a better family member' requires the respondents to assess whether their involvement in work makes them cheerful, and whether being cheerful actually turns them into a better family member. Secondly, items of the WFES were seen to be double-barrelled (Carlson & Grzywacz, 2008). According to MacDermid (2005), such double-barrelled items might be considered cognitively challenging to the respondent. An example of a double-barrelled item is 'My-
involvement in my work puts me in a good mood and this helps me be a better family member'. This item may confuse respondents, because the first half of the item refers to work, whilst the second half refers to family. Therefore, respondents primarily may have responded to the first part of the item (work context) and to the affective referent, but not to the second part of the item (family member) (Hennessy, 2007). Lastly, Carlson et al. (2006) did not include all five categories of resources that were gained as proposed by Greenhaus and Powell's (2006) work-family enrichment model. Such resources from the work-family enrichment model are skills and perspectives, psychological and physiological resources, as well as social-capital resources, flexibility and material resources.
Work-family enrichment and the workplace
Organisations must devote particular attention to the relationships between the work and family domains and how these two domains impact on other elements, such as quality of life or job satisfaction (Rashid, Nordin, Omar & Ismail, 2011a). Organisations continually look for competent employees who are thorough in their work. Therefore, it is in the best interest of organisations to follow practices that allow their employees to perform at work, as well as function meaningfully in their homes (Rashid et al., 2011a). It is essential to understand the benefits of experiences and resources gained in the individuals' work and family roles. Such understanding will enable individuals to become aware of resources that are gained and assist them in using those resources within the work and family domains. This, in turn, will lead to improved functioning in both domains and greater satisfaction with life in general. Critically, it can be argued that satisfaction in life will enhance job satisfaction, which could lead to better and improved individual and organisational performances (Rashid, Nordin, Omar & Ismail, 2011b).
The potential value-add of the study
Given the aforementioned discussion, there is a clear need to expand current literature on the positive side of the work-family interface. Therefore, it seems relevant to develop a new instrument with which to measure work-family enrichment based on all five categories of resource gains described by Greenhaus and Powell (2006) in their conceptual and theoretical model. Carlson et al. (2006) did develop the first work-family enrichment scale, but did not limit themselves to only the five categories of resource gains, as indicated in Greenhaus and Powell's model. Therefore, it can be assumed that by not including all the resources in their scale, the resources depicted in the work-family model were measured only partially. In order for us to see if these five resources gained outlined by Greenhaus and Powell are possible, we employed the item response theory (IRT) using the Rasch analysis technique to distinguish on what level items performed and to identify items with the best fit to a multidimensional model and items to be removed due to differential functioning between different demographic groups in South Africa.
Research objective
The objective of this study was to develop items for the measurement of work-family enrichment based on all the elements contained within the theoretical model and to evaluate the latent trait functioning of these items.
Research design
Research approach
The current study followed a quantitative research approach with a methodological focus on developing a new scale for data collection on work-family enrichment, and to validate the instrument (see Mouton, 2001). This consisted of an empirical study, which employed primary numerical data gathered from natural field settings by means of a survey (see Mouton, 2001).
Research method
Research procedure and measuring instrument
The procedures followed in developing the new scale closely adhered to the steps described by DeVellis (2003) in the literature on psychometrics and scale development. The first step in the development of the new scale was to define the construct for work-family enrichment. Building on the theoretical framework provided by Greenhaus and Powell (2006), work-family enrichment can be defined as the extent to which various resources from work and family roles have the capacity to encourage an individual and to provide positive experiences, and thereby enhance that individual's quality of life in the other role (i.e. performance and positive affect). A resource can be seen as an asset that individuals may draw on when they need to solve a problem or cope with a challenging situation (Greenhaus & Powell, 2006).
The following definitions guided by the theory of Greenhaus and Powell (2006) were developed to describe the different resources that were included in the new scale:
- Skills are the extent to which participation in the work or family role leads to the acquisition or refinement of skills that improve the individual's quality of life in the family or work role.
- Perspectives are the extent to which participation in the work or family role leads to the acquisition or refinement of perspectives and values that improve the individual's quality of life in the family or work role.
- Psychological1 is the extent to which participation in the work or family role leads to the acquisition or refinement of self-concept and positive affect that improves the individual's quality of life in the family or work role.
- Physical is the extent to which participation in the work or family role leads to acquisition and refinement of increased energy levels and mental sharpness that improve the individual's quality of life in the family or work role.
- Socio-capital is the extent to which participation in the work or family role leads to the acquisition or refinement of the maintaining of relationships and support that improve the individual's quality of life in the family or work role. Support in this regard is viewed as support provided by others (emotional support or social support).
- Time management (flexibility) is the extent to which participation in the work or family role provides the ability to determine the timing and pace at which role requirements are met, which improves the individual's quality of life in the family or work role.
- Material resources are the extent to which participation in the work role leads to the acquisition or refinement of material resources that improve the individual's quality of life in the family role. Material resources in this regard are viewed as monetary rewards (i.e. income and remuneration).
In the present study, a distinction is made between work-to-family enrichment (WFE) and family-to-work enrichment (FWE). Work life represents the most prominent and vital aspects in an individual's work environment that have a meaningful influence on that individual's family life. Family life, on the other hand, relates to those fundamentally important aspects in the individual's family domain that subsequently impact significantly on that individual's work life. The measuring instrument items were developed and administered in English, since the South African workforce predominantly uses English as an official and commercial language within the business context (Hill & Van Zyl, 2003).
For the next step, items from a preliminary item pool (133 items) were generated from measurements of existing research scales. These scales included the Work-Family Enrichment Scale, the Multidimensional Scale of Perceived Work-Family Positive Spillover and the National Survey of Midlife Development in the United States of America. These scales measure the positive side of the work-family interface (Carlson et al., 2006; Dyson-Washington, 2006; Fisher, Bulger & Smith, 2009; Hanson et al, 2006; Kirchmeyer, 1992a; Kirchmeyer, 1992b; Van Steenbergen, Ellemers & Mooijaart, 2007; Voydanoff, 2004; Wagena & Geurts, 2000). The items of the previous scales were generated and modified to fit the definitions of the various work-family enrichment sub-constructs. An additional 161 items, guided by the various definitions, were developed by the researchers for each sub-construct. After the items (133 items from the existing literature and 161 self-developed) were evaluated based on general item development criteria (see DeVellis, 2003; Foxcroft & Roodt, 2009), the item pool was reduced to 110 items. This remaining pool was sent to a panel of subject experts (researchers in the area of work-family enrichment) for evaluation. The initial item pool was reduced to 95 items, some of which were adapted where necessary. The remaining 95 items again were scrutinised by national and international researchers, re-evaluating whether the items sufficiently tapped the content domain or sub-constructs of work-family enrichment. These items were refined further, based on the researchers' observations.
Next, the items were classified into eight sub-scales or resources for the WFE direction (51 items; skills, perspectives, self-concept, psychological (positive affect), physical, socio-capital, time management and material resources) and seven sub-scales or resources for the FWE direction (44 items; skills, perspectives, self-concept, psychological (positive affect), physical, socio-capital and time management). Research subjects were asked to respond to the items by using a five-point Likert-type scale ranging between 0 (strongly disagree) and 4 (strongly agree). The measuring instrument was subsequently named the MACE Work-Family Enrichment Instrument.
Sampling and research participants
The MACE Work-Family Enrichment Instrument was administered randomly by a group of postgraduate students to people working within the South African context (n = 527). To be included in this sample, participants needed to have a permanent job. The survey booklet also contained a section explaining the research purpose and the process thereof. Fieldworkers duly communicated to the participants a standard introduction and orientation on the rationale of the research study. Participants were informed beforehand that their participation in the research project was voluntary. It was also pointed out to them that if they participated in the research and completed a questionnaire, that they gave their consent that the researcher could use the data for research purposes only.
The participants were 213 men and 311 women (and three participants who did not indicate their gender), with ages ranging between 20 and 72 (M = 39; SD = 11.93). The sample included participants from the four major South African race groups: White (n = 426), Black (n = 69), mixed-race (n = 22) and Indian/Asian (n = 4); six people did not indicate their race group. Most of the participants held a post-school qualification (60.2%); the remaining participants had either a school qualification (33.4%) or did not indicate their highest qualification obtained (6.5%).
Ethical considerations
Ethical considerations were taken into account during the planning and execution of the empirical study. The following paragraphs focus on the ethical aspects relevant to the research's goals.
Potential benefits and hazards
Participants were not exposed to any potential threats (physical, psychological or disclosure). Prior to the study, ethical clearance was obtained by each organisation involved and permission was obtained from the participants. Participants were only requested to participate in a survey that included questions on their work-family enrichment. All personal information gained from the participants was kept confidential and private. The participants were ensured that their responses would be used anonymously and for research purposes only.
Data protection
Only the researchers involved in the study were allowed to analyse or capture the data and ensured that the data that was collected was kept confidential. The completed questionnaires were protected at all times and kept in a safe, secure location, even after data capture and analysis.
Statistical analysis
Rasch analysis was conducted by applying the Rasch Unidimensional Measurement Model 2030 (RUMM 2030) programme (Andrich & Sheridan, 2009). The use of Rasch analysis has recently increased, particularly in the development and analysis of questionnaires or research instruments (Hendriks, Fyfe, Styles, Skinner & Merriman, 2012; Koekemoer, Mostert & Rothmann, 2010; Prieto, Alonso & Lamarca, 2003; Wright, 1996). However, only one study was found that employed the Rasch technique particularly for scale development within the field of the work-family interface research (Koekemoer et al., 2010). The technique is based on the Rasch analysis model, which is a probabilistic model determining the relationship between person ability and item difficulty or a separate endorsement for each unidimensional aspect (Andrich, 1988; Fox & Jones, 1998).
Rasch analysis is considered to be an ideal statistical technique that allows questionnaires or scales to be modified by re-scoring or removing items. Since this newly developed work-family enrichment instrument is still in the developmental stage, the researchers opted to employ the Rasch analysis technique to assess item performance. This is done instead of attempting to change the model of the trait, attitude or ability to fit the data based on the original questionnaire (Hendriks et al., 2012). Therefore, the Rasch analysis provides an extensive range of information to assess the quality of items in a scale. This information includes various statistical and graphical tests to determine fit between the data and the model. Such combined information can be applied to make an overall conclusion on the quality of the scale, and to suggest possible modifications. The Rasch model is a probabilistic model that is ideal for unidimensional measurements against which to judge new scales, such as the MACE Work-Family Enrichment Instrument proposed in the present study (see Andrich, 1988).
The statistical analyses are presented in the following order:
- Thresholds.
- Item location and fit to the model.
- Item/person threshold distribution.
- Differential item functioning.
- Local item dependence.
- Item location and fit of the items to the sub-scales.
Thresholds: Firstly, the response categories for each item were examined to determine whether they are working as expected. If a person scores low on a specific trait, that person will probably respond in the categories strongly disagree (1) or disagree (2). If a person scores high on the specific trait, that person will most likely respond in the agree (4) or strongly agree (5) categories. On the other hand, if the person scores in the middle of the represented trait, it is very likely that the person will respond to the neither disagree nor agree (3) category. If the ordering of the response categories is, however, not working as intended, the estimates of those thresholds will not appear in their expected order. In such a case, there is very little discrimination between the disordered categories. Therefore, the responses that are obtained for such categories are almost random in effect (Andrich & Sheridan, 2009). It is possible to combine disordered response categories post hoc and so try to determine which combination of categories may represent the data more accurately. However, once such categories have been executed, new data needs to be collected by referring to the collapsed categories to investigate how they are functioning (Andrich & Styles, 2004; Marais, Styles & Andrich, 2011).
Item location and fit to the model: Marais et al. (2011) suggest the use of statistical tests of fit and the location of items to establish evidence of misfit. The x2 test fit investigates the fit of the items to the model and the item locations. The locations are measured in logits: 'an interval scale in which the unit intervals between the locations on the person-item map have a consistent value or meaning' (Bond & Fox, 2007, p. 38). Item locations reflect the relative difficulty the respondents experienced in agreeing with items. This, in turn, indicates the location of particular items on the latent trait continuum: items with higher locations are more difficult to agree with than those with lower location parameters (De Bruin & De Bruin, 2011). A spread of approximately -3 to +3 logits is usually considered adequate. The locations of the items themselves helped to define the scale. Items with fit residuals closest to 0 will fit a proposed model best. Items with high positive fit residuals (> 2.5) or high negative fit residuals (< -2.5) will fail to fit the model sufficiently. A negative fit residual indicates that the item is over-discriminating in relation to all items taken as a whole. In contrast, a positive value suggests that the item is less discriminating. Additionally, the Person Separation Index (PSI) will be reported to investigate the reliability of the scales. The PSI, as defined by Bond and Fox (2007), represents an estimate of the spread of persons on the variable being measured. The PSI is a reliability indicator that is very similar to the traditional Cronbach's alpha.
Item/person threshold distribution: Person and item locations are logarithmically transformed and plotted on the same continuum. This is done by using a common unit of measurement termed a logit; in this way ordinal data is converted to equal-interval data. In Rasch modelling, these logit values are named locations instead of scores. A person's location in logits is that individual's natural log odds for agreeing to a set of items. People with higher levels of the attitude under consideration have more positive endorsement of items and therefore indicate locations (in logits) that occur to the right of the scale. An item's location may be interpreted in terms of the relative difficulty that participants, as a whole, have in responding affirmatively to that item. Items located to the right of the continuum midpoint of 0 logits (i.e. with- a positive logit value) are more difficult to endorse than those to the left (i.e. with a negative logit value); the item content helps to define more or less what the construct signifies. More intense items are likely to be affirmed only by persons who possess higher total scores on a set of items. In contrast, easier or less intense items are likely to be affirmed by many participants, including those who indicate a lower total score (Hendriks et al., 2012). According to De Bruin and Buchner (2010), the test information curve may be applied to discriminate between those areas of the latent traits for which the scale functions most effectively, and those areas for which it operates least effectively.
Differential item functioning (DIF): An analysis of the DIF was carried out and the different groups within the sample were compared to determine whether the items of the WFE and of the FWE directions have the same meaning across subgroups. DIF is done to determine whether different groups within a sample (e.g. gender or race) respond differently to an individual item, despite having the same levels of the latent trait. When DIF is present, the probability of an item response cannot be explained entirely by referring to the respondents' levels of attitude and the difficulty they experience to endorse the item. The reason is that their performance is also influenced by another characteristic, such as their gender or their age (Hagquist & Andrich, 2004).
Local item independence: Local item independence is the assumption that the items in a test should not be related to each other, and therefore can be evaluated by inspecting the residual correlation output to identify positive correlations exceeding 0.3 (Baghaei, 2007; Davidson, 2009; Marais et al., 2011). According to Baghaei (2007) and Marais et al. (2011), when items share mutual information, it produces dependence on local items. This leads to biased parameter estimations and influences the unidimensionality of scales by indicating either the presence of sub-scales, or the redundancy of items. Marais et al. also suggest comparing the PSI of the complete sets of items with the various subsets of items representing the sub-scales. If the PSI for the subtest analysis decreases considerably compared to the PSI of the complete set of items, then the subtests should be analysed, rather than the complete set of items.
Item location and fit of the items to the sub-scales: Statistical tests of fit and the location of items to locate evidence of misfit were carried out separately on the different sub-scales. In addition, an analysis of DIF was carried out on the items from the various sub-scales and the different demographic groups (e.g. age, race, qualification, gender) within the sample were compared. This was done to determine whether item bias existed between groups with respect to specific items of the sub-scales for the WFE as well as the FWE direction. Lastly, the total model fit for the sub-scales before and after eliminating the misfitting items were analysed by applying the x2 test of fit and the PSI.
Results
Thresholds: The thresholds for 12 items of the 95-item MACE Work-Family Enrichment Instrument did not operate as expected. Figure 1 presents this effect graphically for item MWF4 (Having capital that enables me to purchase what is needed for my family).
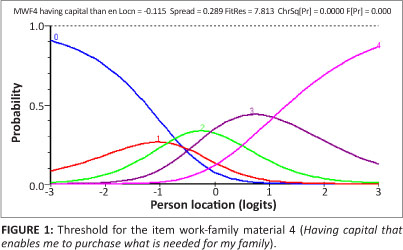
From Figure 1, it is evident that the disagree response category (1) is not clearly distinguishable from the adjacent response categories, especially the strongly disagree (0) category. Given these results, the strongly disagree (0) and disagree (1) categories were collapsed into one category for the identified six items. Figure 2 presents an example of the category characteristics curves (CCC) for one of the problematic items after the categories were collapsed (item MWF4, same item as in Figure 1).
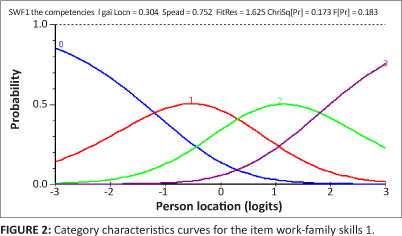
As indicated in Figure 2, all of the response categories now function as expected. Scores of 0 (strongly disagree) and 1 (disagree) were rescored as 0 (disagree), a score of 2 was rescored as 1 (neither disagree or agree), a score of 3 was rescored as 2 (agree), and a score of 4 was rescored as 3 (strongly agree).
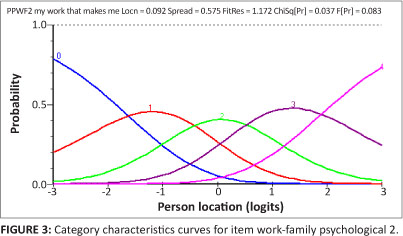
The thresholds for the remaining 83 items of the MACE Work-Family Enrichment Instrument functioned as expected. The scale for these items therefore distinguishes clearly between the five categories (see Figure 3 for an example of the application of the CCC).
Item location and fit to the model: The fit of the individual items to the item sets of both the WFE and FWE directions were examined separately through the log residual test of fit statistics for individual items and the interaction test of fit for items' traits (a chi-square test). The PSI was 0.97 for item sets of both the WFE and the FWE direction. However, due to the possibility of item dependency, this index of reliability could be exaggerated. Item dependency will be investigated later.
The fit of the items to the model and of the items' locations on the continuum were inspected to get proof of validity for both item sets of the WFE and the FWE direction. The spread of the item locations for item sets of both the WFE (-0.41 to 0.87 logits; SE: 0.05-0.06) and the FWE direction (-0.81 to 1.16; SE: 0.07-0.08) is in range and therefore adequate. Regarding the item set of the WFE direction, it seemed to be easier for people to agree with the statement of, for example, item PSWF1 (My family life is improved by my work that provides me with a sense of accomplishment). In contrast, it seemed to be rather difficult for people to agree with the statement contained in item PWF1 (My family life is improved by the different values I come into contact with at work). From the item set of the FWE direction, SOFW3 (My work is improved by having good relationships in my family life) was the easiest item for participants to agree with, whilst SFW2 (My work is improved by the skills I learn in my family life) was the most difficult item to agree with.
With regard to the fit residuals, eight items (FitRes = 2.896.74; p = 0.000-0.190; x2 = 11.21-83.74) from the item set of the WFE direction (MWF1, MWF2, MWF3, MWF4, MWF6, MWF7, PWF1 and PWF2) and eight items from the item set- of the FWE direction (PFW4, PFW5, TFW5, SFW1, SFW3, SFW4, SFW5 and TFW6) showed high positive fit residuals (FitRes = 2.57-5.95; p = 0.000-0.210; x2 = 10.89-76.68). These items would most likely over-discriminate between persons' item locations and therefore fail to fit the model. Noticeably, all but one (MWF5) of the material resources items from the item set of the WFE direction showed high positive fit residuals, indicating that this resource fails to fit the model. Furthermore, six items (FitRes = -2.57- -3.58; p = 0.001-0.044; x2 = 15.89-27.50) from the item set of the WFE direction (PSWF4, PSWF5, PSWF6, PHWF4, PHWF5 and PHWF6) and 13 items (FitRes = -2.51- -4.83; p = 0.000-0.260; X2 = 10.11-22.42) from the FWE direction's item set (SOFW3, SOFW4, PPFW3, PPFW4, PPFW5, PHFW1, PHFW2, PHFW3, PHFW4, PHFW5, PSFW3, PSFW4 and PSFW5) showed high negative fit residuals. This indicates that these items would most likely under-discriminate between persons' item locations and therefore fail to fit the model. The item fit for the remaining WFE items ranged between -2.01 and 2.08 (p = 0.001-0.985; x2 = 1.86-26.12) and for the remaining FWE items, the fit residuals ranged between -2.49 and 2.40 (p = 0.000-0.980; x2 = 1.89-29.31). The fit of these items was deemed acceptable.
Item/person threshold distribution: The targeting of items and persons was assessed by viewing the person-item location distribution map. According to this map, the locations of persons are plotted together with that of item locations, or item threshold locations on the same continuum, as well as the item characteristic curve. The distributions of these- threshold locations for persons and items are represented in Figure 4 and Figure 5 for both item sets of the WFE and the FWE directions.
Figure 4 illustrates that the WFE direction item set is reasonably well spread around the mean and that the graph on person-item distribution shows that the persons' spread is more to the right of the mean, and therefore positively skewed. This indicates that a considerable number of participants are not narrowly targeted to the items, although the items are covered by the item parameters. This will result in information about the persons at locations around three logits; any more would not be very high (see Andrich & Sheridan, 2009).
Figure 5 illustrates that, whilst the item set of the FWE direction is reasonably well and widely spread around the mean, some individuals are not narrowly targeted to the items. It is also evident from the results that the items are skewed positively. Although the items are covered by the item parameters, the person parameters are not completely covered by the items in turn.
Differential item functioning: Table 1 and Table 2 indicate the differential item functioning (DIF) for both item sets of the WFE and the FWE directions respectively, determining whether different groups within a sample respond differently to an individual item.
From Table 1, it is apparent that there is no evidence of DIF from the WFE direction's item set within the gender, age, race and qualification demographic groups. Therefore, direct comparisons of mean locations for these groups can be made, seeing as the construct has the same meaning across all subgroups.
Interpreting the mean locations (logits) of the WFE direction's item set as depicted in Table 1 to Figure 6, all groups fall in- the agree response category; with the Indian/Asian group inclining closer to the neither agree nor disagree response category, and the mixed race group being closest to the strongly agree response category with the statements in the item set of the WFE direction.
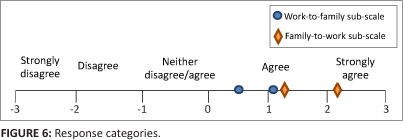
Table 2 indicates that there is no evidence of DIF from the FWE direction's item set within three of the four demographic groups, excluding race. Therefore, direct comparisons of mean locations can be drawn for the gender, age and qualification groups, seeing as the construct has the same meaning across all sub-groups. However, the different race groups seem to respond differently to the items from the FWE direction's item set. Therefore, further investigation is required. Relating the above mean locations (logits) to Figure 6, it becomes apparent that most groups on average were located in between the agree and strongly agree response categories. The mixed race group tended to agree more with the statements of the FWE direction's item set, whilst the Black race group tended to agree more strongly with the statements of the FWE direction's item set.
Item dependencies: The inspection of the residual correlations between pairs of items in the current analysis reveals the existence of sub-scales. A summary was done of the indices of test of fit and the reliability of the subtest analysis, by using the eight sub-cales of the WFE direction and the seven sub-scales of the FWE direction separately. This summary revealed that (1) the PSI reliability of the WFE direction's sub-scales dropped significantly (cA = 0.95) from 0.97 to 0.88 and (2) the PSI reliability of the FWE direction's sub-scales dropped significantly (cA = 0.73) from 0.97 to 0.91. These results indicate that the eight and seven sub-scales of the WFE and the FWE directions might represent participants' agreement with te statements better than the two item sets of the WFE ad the FWE directions. The association of the eight sub-scles of the WFE direction reveals that participants were mre comfortable disagreeing with time management items (item location -0.06) and found it easier to agree with statements from the skills subtest (item location 0.08). When relating the seven sub-scales of the FWE direction, the results indicate that participants disagreed more easily with statements fro the perspectives sub-scale (item location -0.11) and were more comfortable agreeing with items from the skills subtest (item location 0.17).
Based on these results, the eight sub-scales of the WFE direction and the seven of the FWE direction were analysed separately.
Item location and fit of the items to the sub-scales: The item locations and fit of items for the sub-scales of the WFE direction, the presence of DIF within the various demographic groups, as well as item fit after problematic items had been eliminated are presented in Table 3.
The results in Table 3 indicate that certain items for each of the sub-scales display misfit (PWF1, PPWF4 and MWF7), bias (SWF3, PWF2, PSWF1, PPWF5, PPWF1, SOWF3, SOWF5 and SOWF2), or both (SWF5, PPWF6 and MWF5). With regard to the overall model fit for each of the sub-scales, the results indicate that model fit can be improved by omitting certain problematic items, although the PSI decreases slightly in each instance (see perspectives, self-concept, and material resources). However, in certain cases, deleting some misfitting items decreases the overall fit and undermines the reliability of the scale unnecessarily. The overall fit of the various sub-scales varies between good and excellent. The results suggest that 10 items could be considered for elimination from the final sub-scales of the WFE direction (SWF5, PWF1, PWF2, PSWF1, PPWF4, PPWF5, PPWF6, MWF1, MWF5 and MWF7).
Table 4 presents the item locations and the fit of items for the FWE direction's sub-scales, the presence of DIF within the various demographic groups, as well as item fit after problematic items had been eliminated.
As wit the reslts of te WFE direction's sub-scales, the results for the WE dirction's sub-scales (Table 4) also reveal that three items from the various sub-scales displayed misfit (PHFW6, SOFW6 and TFW6), 14 items were shown to contain DIF (SFW6, PFW4, PFW6, PSFW2, PSFW3, PSFW5, PSFW4, PPFW3, PHFW4, PHFW3, PHFW5, SOFW3, SOFW5 and SOFW2), and one item displayed both misfit and bias (PPFW1). The total model fit for the various FWE sub-scales also varied between good and excellent. Analysis also revealed that deleting some misfitting items might improve model fit, but in other instances it would decrease the overall model fit needlessly. Based on the results, it can be recommended that nine items be omitted from future measurement of sub-scales of the FWE direction (PSFW4, PPFW1, PPFW3, PHFW5, PHFW6, SOFW5, SOFW6, TFW5 and TFW6).
Discussion
The objective of this study was to develop items for the measurement of work-family enrichment based on all the elements contained within the theoretical model and to evaluate the latent trait functioning of these items. With the development of this new instrument, several of the theoretical and measuring limitations voiced by previous researchers were addressed. This strategy illustrates various distinct advantages of this instrument over previous positive work-family measurements. In addition, the Rasch rating scale was used to analyse the items that were developed for the MACE Work-Family Enrichment Instrument.
When analysing data from questionnaires, a constructive early step in the process is to investigate the functioning of rating scale categories (Linacre, 2002). These categories relate to items that are scored on more than two categories. The results in this study indicated that 12 of the 92 items did not function according to the expected five-point Likert-type scale. The strongly disagree and disagree response categories proved to be problematic across all 12 items. It can therefore be deduced that the participants found it difficult to discriminate between these two categories when responding to the identified 12 items. Closer investigation of the item content did not reveal any plausible explanation why the participants found it difficult to discriminate between these two categories for the 12 items. A reason that people would discriminate between strongly disagree and disagree might be that people find it socially undesirable to evaluate their positive work and family in extreme negative terms. It is rather more socially desirable to agree or strongly agree with positive elements with one's work and family life.
Linacre (2002) states that, for analytical purposes, the challenge is to verify that observations according to the rating scale conform reasonably closely to a specified model; therefore, the results recommended the collapse of these two categories for further analysis. According to Marais et al. (2011), the collapsing of categories should not be done in established questionnaires. However, since this questionnaire was still in its development phase, it was deemed acceptable to collapse these categories. According to Grimbeeck and Nisbet (2006), a fundamental issue with using a Likert-type scale is the problematic measurement properties of categories that require multi-choice responses per item. This warrants further investigation into the appropriate number of response categories for the MACE Work-Family Enrichment Instrument.
The Rasch analysis indicated that a total of 35 items from the item sets of both the WFE and the FWE directions either over-discriminated or under-discriminated between item locations of persons. The perspective resource items over-discriminated constantly in both the WFE and FWE item sets. The items that were over-discriminated against may indicate that the respondents were careless or less motivated in responding to the items (Hendriks et al., 2012) and were therefore reluctant to answer with the relevant intensity. Furthermore, individuals might have had their own understanding of the wording of the items (e.g. 'values', 'perspectives') that differed from that of other individuals, or they might have attached different meanings to the wording in the items.
Additionally, items measuring the dimensions of physical and self-concept consistently under-discriminated between persons' item locations in the item sets of both the WFE and FWE directions. With regard to the under-discrimination of these items, participants may have been responding according to the same mental set or fixed pattern of thinking about the underlying trait (Hendriks et al., 2012). A reason that might stem from the physical dimension may be that individuals entertain the same idea or meaning of the wording (i.e. being energised) in the items, which provides no new information on the individual's experience of the physical dimension. For the self-concept dimension it may be suggested that all individuals experienced self-concept and were indicating a sense of self-worth in the same manner. This is because they answered the questions in the same way, and therefore provided no new information on how they experienced the self-concept dimension. Items are therefore not diversified (Andrich, 1988) and should be re-evaluated.
For the item set of the WFE direction, the items relating to self-concept, socio-capital, and time management were the easiest for participants to agree with. The reason that individuals found the self-concept dimension easier to agree with may be that a person finds it socially desirable to indicate that the self-worth or self-concept they experience in their work plays a positive role in their family life. Social desirability is the tendency of respondents to answer questions in a manner that will be viewed favourably by others. It can take the form of over-reporting 'good' behaviour or under-reporting 'bad' or undesirable behaviour (Paulhus, 1991). Respondents therefore over-report on the desirable behaviour as it might be seen as socially desirable. Furthermore, according to Carlson et al. (2006), employees are more likely to apply resources to their work role if occupation is more salient to their self-concept. Therefore, if one's self-concept is more- closely linked to work as opposed to family, then positive spillover is likely to occur from work to family. Regarding the socio-capital dimension, it could be suggested that respondents found it easier to agree with these items because they found it easy to relate to, which indicates that these individuals experience a sense of support in their work and maintain good relationships with their co-workers; such support and the maintaining of good relationships at work might lead to lessened role pressures (Greenhaus & Beutell, 1985), resulting in workers being more prone to agree with the items.
Additionally, it may be suggested that participants found it easy to agree with the time management dimension, as their occupation might require them to have a work schedule enabling them to apply their time effectively (Sabil & Marican, 2011). This allows them to meet their work requirements in sufficient time in the work domain, which in turn enhances their family domain by allowing them to spend sufficient time with their families. According to Kehoe (1995), items that everyone found easy to agree with are impractical and should be replaced by more probing items that are more difficult to agree with.
Items relating to perspectives and skills were more difficult to agree with from the work to family enrichment direction. The reason that respondents found it difficult to agree with the perspective dimension might be due to the multicultural nature of the work environment consisting of employees with different viewpoints and values (Lewis, 1997). If individuals could not relate to some viewpoints and values of others, they would find it difficult to agree with and answer these items. It might also be that some participants did not understand the meaning of some of the words (i.e. 'perspectives', 'values', 'viewpoints') in the items and the result was that individuals found it more difficult to agree with this dimension. Furthermore, it is indicated that individuals found it more difficult to agree with the skills dimension. Therefore, it may be suggested that participants found it hard to relate to the type of competencies gained from their work that could be used in their family role to improve the quality of life in that domain. In addition, individuals might have found the wording of the items (i.e. 'competencies') too complicated.
For the item set of the family to work enrichment direction, the items representing the socio-capital and physical resources appeared to be easy to agree with. It could be suggested that respondents who found the socio-capital items from the family to the work enrichment direction easier to agree with experience awareness that they are cared for and loved, respected and valued as a member of their families (Cobb, 1976). Furthermore, the physical resources items were also found to be the easiest to agree with from the FWE direction. The reason that respondents found these items easy to agree with might be that individuals' family environments make it possible for them to gain more energy and mental sharpness within their family domain. These resources, in turn, could be applied in their work, enhancing their work domain. The participants seemingly found it difficult to agree with the items of the skills dimension in the FWE direction. A reason for this might be that individuals find it difficult to relate to the word 'skills' in the items and the type of skills that could be generated particularly in the family domain that could be applied in their work role to better the quality of life in the work domain.
The distribution map of person-item threshold indicated the range over work-family enrichment for which the items in the item set of WFE and the FWE directions would be most useful and reliable when measuring persons' levels of ability through the measured construct. For both item sets, participants perceived the items to be relatively easy. Subsequently, those participants were rated high on work-family enrichment. The scale provides insufficient information on the higher ranges of work-family enrichment, and therefore represents an instrument that will provide more accurate information for people who operate in the middle to lower ranges of work-family enrichment. Examining the item content of item sets for both the WFE and the FWE directions, it can be hypothesised that possible reasons for the insufficient person reliability might be that the respondents misunderstood the items or that they were reluctant to answer the questions with the relevant intensity. Therefore, to ensure better person reliability, the wording and intensity of the items may have to be explored and adapted (Hendriks et al., 2012).
Differential item functioning (DIF) was not present in either the WFE direction's item set, or in the item set of the FWE direction. With the absence of the DIF, the probability of the item response could be explained by the respondents' level of attitude and the fact that they found it difficult to endorse the item. The absence of DIF indicates that the work-to-family and family-to-work enrichment scale could be administered to participants of different genders, ages, races and qualifications, without the concern that the items may mean something different to each population sub-group. Therefore, direct comparisons of mean locations for these groups can be made as the construct has the same meaning across sub-groups (Hendriks et al., 2012).
According to Baghaei (2007) and Marais et al. (2011), when items share mutual information, they produce dependence on local items. With regard to such local item dependence, the results indicated that the MACE Work-Family Enrichment Instrument is more differentiated than was considered initially. That is because there is a clear presence of sub-scales in item sets of both the WFE and the FWE directions. Participants' experience of work-family enrichment could therefore be represented in a more meaningful way by presenting a profile of how the different work-family enrichment resources were experienced, rather than making a solitary assessment on all items at once.
In the item sets of both the WFE and the FWE directions, various items displayed misfit, bias or both. Deleting some of these items proved to better the overall model fit for each of these sub-scales, although at times it was done at the expense of the PSI. The PSI represents an estimate of the spread of- persons on the variable that is measured (Bond & Fox, 2007). However, in some instances, the unnecessary deletion of problematic items decreased the overall fit and countered the reliability of the sub-scales. Overall, most items functioned acceptably.
With respect to the bias identified within the sub-scales for the WFE direction, the following results were registered: qualification groups differed in their experience of the skills and self-concept sub-scales, race groups differed in terms of the perspectives, psychological and material sub-constructs, and gender groups differed in terms of the psychological subconstruct. A possible explanation for the gender differences could be that women experience more positive affect than men do from their work to their family roles, because women are more likely to integrate these roles, whereas men tend to segment or mentally separate work and family roles (Andrews & Bailyn, 1993). Women may experience and utilise resources differently than men do (Wayne et al., 2007). Previous research suggests that women experienced higher levels of WFE compared to men (Van Steenbergen et al., 2007). However, Rothbard (2001) found that men experienced greater WFE compared to women.
The bias found within the sub-scales for the FWE direction were related to differences between the various qualification groups on their experience of self-concept, socio-capital and time management. Furthermore, race groups differed in terms of the psychological and physical sub-scales and age groups differed in terms of the physical sub-scale. Considering the difference in qualification based on the socio-capital sub-construct, it may be assumed that employees with a post-school qualification have more responsibilities at work. Furthermore, if these individuals experience more emotional and social support, as well as good relationships in their family lives, this might spill over to their work role, enabling them to take on these responsibilities in their workplace more easily than other individuals. Previous research therefore indicates that individuals with post-school qualifications experience higher FWE (Grzywacz & Marks, 2000; Voydanoff, 2004).
Limitations
Self-report questionnaires were employed to obtain the work-family enrichment scores. This was considered as a limitation in this study. The use of self-report questionnaires has been a source of debate in literature on organisational psychology (e.g. Howard, 1994; Spector, 1994), and has been criticised for leading to artificially inflated correlations when measuring psychological constructs. The sub-scales included in the present study were most appropriately measured by asking employees to report their own attitudes and perceptions of work-family enrichment (Schmitt, 1994).
Another limitation that came to the fore was the large number of items that were initially included in the study to measure the various sub-constructs of the MACE Work-Family Enrichment Instrument. Some of the participants complained about the length of the questionnaire and that the items were too repetitive. This may have influenced the way in which participants responded to the items (e.g. by responding randomly).
Recommendations
Recommendations for future research studies using the MACE Work-Family Enrichment Instrument are as follows:
- Revise or eliminate items that proved to be biased or have shown misfit with the scale and sub-scales.
- Investigate the model fit of the sub-scales after deleting the problematic items.
- Investigate whether a four-point rating scale or a five-point rating scale will solicit more reliable results.
- Include items that will measure those respondents who scored high on work-family enrichment.
- Investigate the relevance of the material resources sub-scale on work-family enrichment, since the Work-Family Enrichment Scale by Carlson et al. (2006) disregarded the measurement of material resources in its development.
- Investigate the resources separately according to the work-family enrichment model, seeing as the MACE Work-Family Enrichment Instrument included eight resources for work to family, and seven resources for family to work. The model includes five resources for both directions. Some of the resources and categories theoretically collapsed together (i.e. perspectives and skills; self-concept, psychological and physical).
- Investigate the internal psychometric properties of the MACE Work-Family Enrichment Instrument (i.e. validity in terms of construct, convergent and discriminant, its reliability, etc.).
- Investigate the external psychometric properties of the MACE Work-Family Enrichment Instrument (i.e. the relationship with antecedents and the consequences of work-family enrichment).
Conclusion
The results suggest that the MACE Work-Family Enrichment Instrument functions as a multi-dimensional instrument by covering the various work-family enrichment resources as proposed by Greenhaus and Powell (2006). The MACE Work-Family Enrichment Instrument is therefore based on a sound theoretical framework and should be developed and investigated further in order to identify work-family enrichment factors that can measure workers' experience of enrichment in their work and family domains.
Acknowledgements
The authors wish to thank post-graduate students from North-West University for assistance in gathering of data.
Competing interest
The authors declare that they have no financial or personal relationship(s) that may have inappropriately influenced them in writing this article.
Authors' contributions
M.d.K. (North-West University) conducted the scale development, collection of data and took the lead in the write-up of the manuscript. J.A.N. (North-West University), as study promoter, assisted with the scale development, and gave insight into the write-up of the manuscript. C.H. (University of Johannesburg) conducted the data analysis, supervised the write-up of the results and provided guidance for the overall manuscript. E.K. (North-West University) acted as co-study promoter and gave valuable insight concerning the final manuscript.
References
- Andrews, A., & Bailyn, L. (1993). Segmentation and synergy: Two models linking work and family. In J.C. Hood (Ed.), Men, work, and family (pp. 262-275). Newbury Park, CA: Sage. [ Links ]
- Andrich, D. (1988). Rasch models for measurement. Newbury Park, CA: Sage. http://dx.doi.org/10.1016/S0263-2241(88)80003-4 [ Links ]
- Andrich, D., & Sheridan, B. (2009). Interpreting RUMM2030 (Part I). Perth, Western Australia: RUMM Laboratory. [ Links ]
- Andrich, D., & Styles, I. (2004). Final report on the psychometric analysis of the Early Development Instrument (EDI) using the Rasch model: A technical paper commissioned for the development of the Australian Early Development Instrument (AEDi). Perth, Australia: Murdoch University. [ Links ]
- Baghaei, P. (2007). Local dependency and Rasch measures. Rasch Measurement Transactions, 21(3), 1105-1106. [ Links ]
- Bhargava, S., & Baral, R. (2009). Antecedents and consequences of work-family enrichment among Indian managers. Psychological Studies, 54, 213-225. http://dx.doi.org/10.1007/s12646-009-0028-z [ Links ]
- Bond, T.G.B., & Fox, C.M. (2007). Applying the Rasch model: Fundamental measurement in the Human Sciences. Mahwah, NJ: Erlbaum. [ Links ]
- Carlson, D.S., & Grzywacz, J.G. (2008). Reflections and future directions on measurement in work-family research. In K. Korabik, D.S. Lebo, & D.S. Whitehead (Eds). Handbook of work-family integration: Research, theory and best practices (pp. 57-73). Oxford, United Kingdom: Elsevier. http://dx.doi.org/10.1016/B978-012372574-5.50007-7 [ Links ]
- Carlson, D.S., Kacmar, K.M., Wayne, J.H., & Grzywacz, J.G. (2006). Measuring the positive side of the work-family interface: Development and validation of a work-family enrichment scale. Journal of Vocational Behavior, 68, 131-164. [ Links ]
- Cobb, S. (1976). Social support as a moderator of life stress. Psychosomatic Medicine, 38, 300-314. PMid:981490 [ Links ]
- Davidson, M. (2009). Rasch analysis of 24, 18 and 11 item versions of the Roland-Morris Disability Questionnaire. Quality of Life Research, 18, 473-481. http://dx.doi.org/10.1007/s11136-009-9456-4, PMid:19238585 [ Links ]
- De Bruin, G.P., & Buchner, M. (2010). Factor and item response theory analysis of the Protean and Boundaryless Career Attitude Scales. SA Journal of Industrial Psychology, 36(2), 932-943. http://dx.doi.org/10.4102/sajip.v36i2.932 [ Links ]
- De Bruin, K., & De Bruin, G.P. (2011). Development of the Learner Self-Directedness in the Workplace Scale. SA Journal of Industrial Psychology, 37(1), 926-936. http://dx.doi.org/10.4102/sajip.v37i1.926 [ Links ]
- DeVellis, R.F. (2003). Scale development, theory and application. (2nd edn.). Thousand Oaks, CA: Sage. PMid:14558062 [ Links ]
- Dyson-Washington, F. (2006). The relationship between optimism and work-family enrichment and their influence on psychological well-being. Unpublished doctoral dissertation, Drexel University, Philadelphia, PA, United States of America. [ Links ]
- Edwards, J.R., & Rothbard, N.P. (2000). Mechanisms linking work and family: Clarifying the relationship between work and family constructs. Academy of Management Review, 25, 178-199. http://dx.doi.org/10.2307/259269, http://dx.doi.org/10.5465/AMR.2000.2791609 [ Links ]
- Fisher, G.G., Bulger, C.A., & Smith, C.S. (2009). Beyond work and family: A measure of work/nonwork interference and enhancement. Journal of Occupational Health Psychology, 14(4), 441-456. http://dx.doi.org/10.1037/a0016737, PMid:19839663 [ Links ]
- Fox, C.M., & Jones, J.A. (1998). Uses of Rasch modelling in counselling psychology research. Journal of Counseling Psychology, 45, 30-45. http://dx.doi.org/10.1037/0022-0167.45.1.30 [ Links ]
- Foxcroft, C., & Roodt, G. (2009). An introduction to psychological assessment in the South African context. Cape Town, South Africa: Oxford University Press. [ Links ]
- Greenhaus, J.H., & Allen, T.D. (2011). Work-family balance: A review and extension of the literature. In J.C. Quick, & L.E. Tetrick (Eds.), Handbook of occupational health psychology (2nd edn.) (pp. 165-183). Washington, DC: American Psychological Association. [ Links ]
- Greenhaus, J.H., & Beutell, N.J. (1985). Sources of conflict between work and family roles. Academy of Management Review, 10, 76-88. http://dx.doi.org/10.5465/AMR.1985.4277352, http://dx.doi.org/10.2307/258214 [ Links ]
- Greenhaus, J.H., & Powell, G.N. (2006). When work and family are allies: A theory of work-family enrichment. Academy of Management Review, 31(1), 72-92. [ Links ]
- Grimbeeck, P., & Nisbet, S. (2006). Surveying primary teachers about compulsory numeracy testing: Combining factor analysis with Rasch analysis. Mathematics Education Research Journal, 18(2), 27-39. http://dx.doi.org/10.1007/BF03217434 [ Links ]
- Grzywacz, J.G. (2000). Work-family spillover and health during midlife: Is managing conflict everything? American Journal of Health Promotion, 14(4), 236-243. http://dx.doi.org/10.4278/0890-1171-14.4.236, PMid:10915535 [ Links ]
- Grzywacz, J.G., & Marks, N.F. (2000). Reconceptualizing the work-family interface: An ecological perspective on the correlates of positive and negative spillover between work and family. Journal of Occupational Health Psychology, 5, 111-126. http://dx.doi.org/10.1037/1076-8998.5.1.111 [ Links ]
- Hagquist, C., & Andrich, D. (2004). Is the Sense of Coherence-instrument applicable on adolescents? A latent trait analysis using Rasch-modelling. Personality and Individual Differences, 36, 955-968. http://dx.doi.org/10.1016/S0191-8869(03)00164-8 [ Links ]
- Hanson, G.C., Hammer, L.B., & Colton, C.L. (2006). Development and validation of a multidimensional scale of perceived work-family positive spillover. Journal of Occupational Health Psychology, 11(3), 249-265. http://dx.doi.org/10.1037/1076-8998.11.3.249, PMid:16834473 [ Links ]
- Hendriks, J., Fyfe, S., Styles, I., Skinner, R., & Merriman, G. (2012). Scale construction utilising the Rasch unidimensional measurement model: A measurement of adolescent attitudes towards abortion. Australasian Medical Journal, 5(5), 251-261. http://dx.doi.org/10.4066/AMJ.2012.952 [ Links ]
- Hennessy, K.D. (2007). Work-family balance: An exploration of conflict and enrichment for women in a traditional occupation. Unpublished doctoral dissertation, University of Maryland, College Park, MD, United States of America. [ Links ]
- Hill, P., & Van Zyl, S. (2003). English and multilingualism in the South African engineering workplace. Work Englishes, 21 (1), 23-35. http://dx.doi.org/10.1111/1467-971X.00229 [ Links ]
- Howard, G.S. (1994). Why do people say nasty things about self-reports? Journal of Organizational Behavior, 15, 399-404. http://dx.doi.org/10.1002/job.4030150505 [ Links ]
- Hunter, E.M., Perry, S.J., Carlson, D.S., & Smith, S.A. (2010). Linking team resources to work-family enrichment and satisfaction. Journal of Vocational Behavior, 77, 304-312. http://dx.doi.org/10.1016Zj.jvb.2010.05.009 [ Links ]
- Jaga, A., & Bagraim, J. (2011). The relationship between work-family enrichment and work-family satisfaction outcomes. South African Journal of Psychology, 41(1), 52-62. http://dx.doi.org/10.1177/008124631104100106 [ Links ]
- Kehoe, J. (1995). Basic item analysis for multiple-choice tests. Practical Assessment, Research & Evaluation, 4(10). Retrieved April 30, 2013, from http://PAREonline.net/getvn.asp?v=4&n=10 [ Links ]
- Kirchmeyer, C. (1992a). Nonwork participation and work attitudes: A test of scarcity vs. expansion models of personal resources. Human Relations, 45, 775-795. http://dx.doi.org/10.1177/001872679204500802 [ Links ]
- Kirchmeyer, C. (1992b). Perceptions of nonwork-to-work spillover: Challenging the common view of conflict-ridden domain relationships. Basic and Applied Social Psychology, 13, 231-249. http://dx.doi.org/10.1207/s15324834basp1302_7 [ Links ]
- Koekemoer, E., Mostert, K., & Rothmann, S. Jr. (2010). Interference between work and nonwork roles: The development of a new South African instrument. SA Journal of Industrial Psychology/SA Tydskrif vir Bedryfsielkunde, 36(1), 1-4. [ Links ]
- Lewis, S. (1997). An international perspective on work-family issues. In S. Parasuraman, & J.H. Greenhaus (Eds.), Integrating work and family: Challenges and choices for a changing world (pp. 91-103). Westport, CT: Quorom. PMid:9335168 [ Links ]
- Linacre, J.M. (2002). Optimizing rating scale category effectiveness. Journal of Applied Measurement, 3(1), 85-106. PMid:11997586 [ Links ]
- MacDermid, S.M. (2005). Considering conflict between work and family. In E.E. Kossek, & S. Lambert (Eds), Work and family integration in organizations: New directions for theory and practice (pp. 19-40). Mahwah, NJ: Lawrence Earlbaum Associates. [ Links ]
- McNall, L.A., Nicklin, J.M., & Masuda, A.D. (2010). A meta-analytic review of the consequences associated with work-family enrichment. Journal of Business & Psychology, 25, 381-396. http://dx.doi.org/10.1007/s10869-009-9141-1 [ Links ]
- Marais, I., Styles, I., & Andrich, D. (2011). Executive summary of the report on the psychometric properties of the Academic Perceptions of the Teaching Environment scale (APOTE) using the Rasch measurement model. Perth, Australia: Graduate School of Education, University of Western Australia. [ Links ]
- Mouton, J. (2001). How to succeed in your master's and doctoral studies: A South African guide and resource book. Pretoria, South Africa: Van Schaik Publishers. [ Links ]
- Paoli, P. (1997). Second European survey on working conditions 1997. European Foundation for the Improvement of Living and Working Conditions. Dublin, Ireland: Loughlingston House. [ Links ]
- Parasuraman, S., & Greenhaus, J.H. (2002). Toward reducing some critical gap in work-family research. Human Resource Management Review, 12, 299-312. http://dx.doi.org/10.1016/S1053-4822(02)00062-1 [ Links ]
- Paulhus, D.L. (1991). Measurement and control of response bias. In J.P. Robinson, P. Shaver, & L.S. Wrightsman (Eds.), Measures of Personality and Social Psychological Attitudes (pp. 19-59). San Diego, CA: Academic Press. [ Links ]
- Polach, J. (2003). HRD's role in work-life integration issues: Moving the workforce to a change in mindset. Human Resource Development International, 6(1), 57-68. http://dx.doi.org/10.1080/13678860110065936 [ Links ]
- Powell, G.N., & Greenhaus, J.H. (2006). Is the opposite of positive negative? Untangling the complex relationship between work-family enrichment and conflict. Career Development International, 11, 650-659. http://dx.doi.org/10.1108/13620430610713508 [ Links ]
- Prieto, L., Alonso, J., & Lamarca, R. (2003). Classical test theory versus Rasch analysis for quality of life questionnaire reduction. Health and Quality of Life Outcomes, 1, 1-27. http://dx.doi.org/10.1186/1477-7525-1-1, http://dx.doi.org/10.1186/1477-7525-1-80, http://dx.doi.org/10.1186/1477-7525-1-27, PMid:12952544 [ Links ]
- Rashid, W.E.W., Nordin, M.S., Omar, A., & Ismail, I. (2011a). Social support, work-family enrichment and life satisfaction among married nurses in health service. International Journal of Social Science and Humanity, 1(2), 150-155. http://dx.doi.org/10.7763/IJSSH.2011.V1.26 [ Links ]
- Rashid, W.E.W., Nordin, M.S., Omar, A., & Ismail, I. (2011b). Measuring self-esteem, work/family enrichment and life satisfaction: An empirical validation. International Conference on Sociality and Economics Development, 10, 576-581 [ Links ]
- Rothbard, N.P. (2001). Enriching or depleting? The dynamics of engagement in work and family roles. Administrative Science Quarterly, 46(4), 655-684. http://dx.doi.org/10.2307/3094827 [ Links ]
- Sabil, S., & Marican, S. (2011). Working hours, work-family conflict and work-family enrichment among professional women: A Malaysian case. Social Science and Humanity, 5, 206-209. [ Links ]
- Schmitt, N. (1994). Method bias: The importance of theory and measurement. Journal of Organizational Behavior, 15, 393-398. http://dx.doi.org/10.1002/job.4030150504 [ Links ]
- Schreuder, A.M.G., & Theron, A.L. (2001). Careers: An organizational perspective. South Africa: Juta. [ Links ]
- Siu, O.L., Lu, J., Brough, P., Lu, C., Bakker, A.B., Kalliath, T. et al. (2010). Role resources and work-family enrichment: The role of work engagement. Journal of Vocational Behavior, 77, 470-480. http://dx.doi.org/10.1016/j.jvb.2010.06.007 [ Links ]
- Spector, P.E. (1994). Using self-report questionnaires in OB research: A comment on the use of a controversial method. Journal of Organizational Behavior, 15, 385392. http://dx.doi.org/10.1002/job.4030150503 [ Links ]
- Stoddard, M., & Madsen, S.R. (2007). Toward an understanding of the link between work-family enrichment and individual health. Unpublished manuscript, Institute of Behavioural and Applied Management, Utah Valley State College, UT, United States of America. [ Links ]
- Van Steenbergen, E.F., Ellemers, N., & Mooijaart, A. (2007). How work and family can facilitate each other: Distinct types of work-family facilitation and outcomes for women and men. Journal of Occupational Health Psychology, 12, 279-300. http://dx.doi.org/10.1037/1076-8998.12.3.279 [ Links ]
- Voydanoff, P. (2002). Linkages between the work-family interface and work, family and individual outcomes. Journal of Family Issues, 23, 138-164. http://dx.doi.org/10.1177/0192513X02023001007 [ Links ]
- Voydanoff, P. (2004). The effects of work demands and resources on work-to-family conflict and facilitation. Journal of Marriage and Family, 66, 398-412. http://dx.doi.org/10.1111/j.1741-3737.2004.00028.x [ Links ]
- Wagena, E., & Geurts, S.A.E. (2000). SWING. Ontwikkeling en validering van 'de Survey Werk-Thuis Interferentie - Nijmegen' [SWING. Development and validation of the 'Survey Work-Home Interference - Nijmegen']. Gedrag en Gezondheid, 28, 138-158. [ Links ]
- Wayne, J.H., Grzywacz, J.G., Carlson, D.S., & Kacmar, K.M. (2007). Work-family facilitation: A theoretical explanation and model of primary antecedents and consequences. Human Resource Management Review, 17, 63-76. http://dx.doi.org/10.1016/j.hrmr.2007.01.002 [ Links ]
- Weer, C.H., Greenhaus, J.H., & Linnehan, F. (2010). Commitment to nonwork roles and job performance: Enrichment and conflict perspectives. Journal of Vocational Behavior, 76, 306-316. http://dx.doi.org/10.1016/jjvb.2009.07.003 [ Links ]
- Wright, B.D. (1996). Comparing Rasch measurement and factor analysis. Structural Equation Modelling, 3, 3-24. http://dx.doi.org/10.1080/10705519609540026 [ Links ]
 Correspondence:
Eileen Koekemoer
Private Bag X6001, Potchefstroom 2520, South Africa
eileen.koekemoer@nwu.ac.za
Received: 06 May 2013
Accepted: 01 Oct. 2013
Published: 20 Nov. 2013
1.Although the constructs of self-concept and positive affect were defined under the Psychological resource, separate items were developed and measured for each construct.


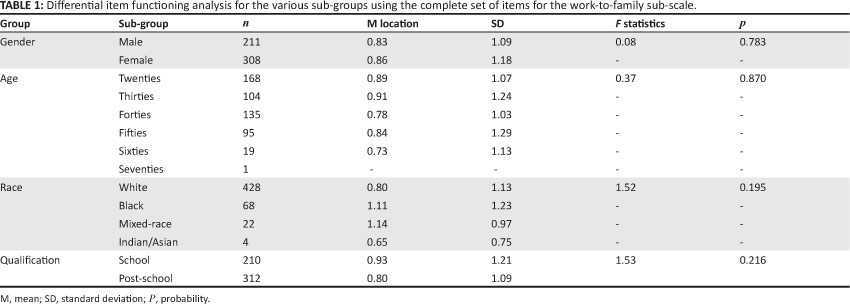
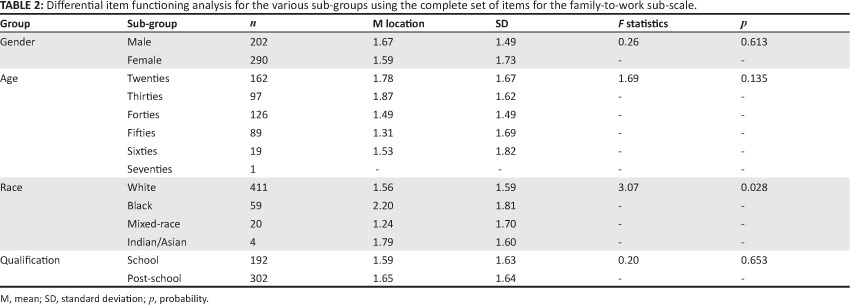
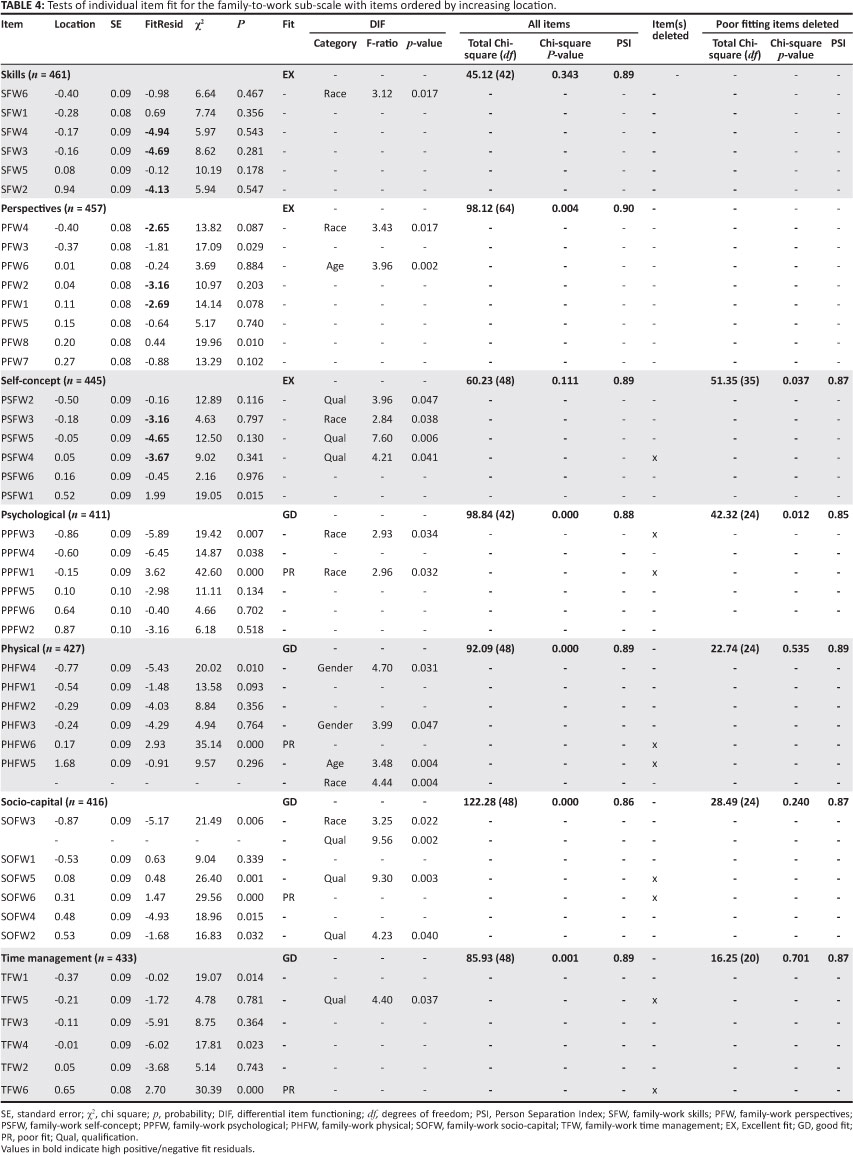