


Services on Demand
Article
 English (pdf)
 Article in xml format
 Article references
Indicators

Related links
-
 Cited by Google
 -
 Similars in Google
Share

 Permalink
SA Journal of Industrial Psychology
On-line version ISSN 2071-0763
Print version ISSN 0258-5200
SA j. ind. Psychol. vol.39 n.2 Johannesburg Jan. 2013
ORIGINAL RESEARCH
Dimensionality of the UWES-17: An item response modelling analysis
Gideon P. de Bruin; Carin Hill; Carolina M. Henn; Klaus-Peter Muller
Department of Industrial Psychology and People Management, University of Johannesburg, South Africa
ABSTRACT
ORIENTATION: Questionnaires, particularly the Utrecht Work Engagement Scale (UWES-17), are an almost standard method by which to measure work engagement. Conflicting evidence regarding the dimensionality of the UWES-17 has led to confusion regarding the interpretation of scores.
RESEARCH PURPOSE: The main focus of this study was to use the Rasch model to provide insight into the dimensionality of the UWES-17, and to assess whether work engagement should be interpreted as one single overall score, three separate scores, or a combination.
MOTIVATION FOR THE STUDY: It is unclear whether a summative score is more representative of work engagement or whether scores are more meaningful when interpreted for each dimension separately. Previous work relied on confirmatory factor analysis; the potential of item response models has not been tapped.
RESEARCH DESIGN: A quantitative cross-sectional survey design approach was used. Participants, 2429 employees of a South African Information and Communication Technology (ICT) company, completed the UWES-17.
MAIN FINDINGS: Findings indicate that work engagement should be treated as a unidimensional construct: individual scores should be interpreted in a summative manner, giving a single global score.
PRACTICAL/MANAGERIAL IMPLICATIONS: Users of the UWES-17 may interpret a single, summative score for work engagement. Findings of this study should also contribute towards standardising UWES-17 scores, allowing meaningful comparisons to be made.
CONTRIBUTION/VALUE-ADD: The findings will benefit researchers, organisational consultants and managers. Clarity on dimensionality and interpretation of work engagement will assist researchers in future studies. Managers and consultants will be able to make better-informed decisions when using work engagement data.
Introduction
Positive psychology has fundamentally changed and challenged the way in which psychologists think about the way people should be studied (Cameron, Dutton & Quinn, 2003). In contrast to a deficit focus, positive psychology emphasises human strengths, giving attention to fulfilling the lives of healthy people (Seligman, 2002). In line with the development of positive psychology, with its focus on human flourishing, recent research in occupational psychology has shifted towards positive aspects of work (Naudé & Rothmann, 2004). For many years, research in occupational psychology was framed within a disease model with the emphasis on dysfunction and negative aspects of work such as stress and burnout (Balducci, Fraccaroli & Schaufeli, 2010; Storm & Rothmann, 2003). In this regard, and in part due to the limited number of positive constructs in occupational psychology, work engagement has emerged as a prominent and popular area of research (Cilliers & May, 2010; Seppälä et al, 2009).
Due to the popularity of engagement, in both academia and the business world, there is a concern that it may be a 'faddish', transient construct (Schaufeli & Bakker, 2010), although organisational interest in work engagement is most likely due to the positive relationship between employee well-being and job performance, as demonstrated by Bakker, Schaufeli, Leiter and Taris (2008). Furthermore, Saks (2006, p. 163) has shown engagement to be a: 'meaningful construct', deserving of research attention. Inspiration for the concept of work engagement was originally drawn from research on the negatively framed construct of burnout (Schaufeli, Salanova, González-Romá & Bakker, 2002), such that work engagement can be seen as the positive antipode of burnout (Schaufeli & Bakker, 2004).
Work engagement is defined as: 'a positive, fulfilling, work-related state of mind that is characterised by vigor, dedication and absorption' (Schaufeli et al., 2002, p. 74). Vigour is marked by high energy levels, the willingness to invest effort in work and perseverance regardless of circumstances. Dedication is marked by a sense of meaningfulness, a feeling of being challenged, and feelings of pride, enthusiasm and inspiration. Absorption refers to being fully focused on and immersed in one's work to such an extent that there is unawareness of time passing and difficulty detaching from work (Schaufeli et al., 2002). Vigour and dedication are considered core dimensions of work engagement (Schaufeli & Bakker, 2004), whereas absorption may be a consequence of work engagement (Langelaan, Bakker, Van Doornen & Schaufeli, 2006).
The Utrecht Work Engagement Scale (UWES) (Schaufeli et al., 2002) has been designed to measure work engagement according to the three dimensions described above. Vigour, dedication and absorption are assessed by six, five and six items respectively. This 17-item scale, known as UWES-17, has been validated and utilised extensively in a number of countries (Bakker et al., 2008). Versions are available in 23 languages and there are also several student versions available (refer to http://www.schaufeli.com). Despite this apparent widespread use, research findings relating to the dimensionality of the scale are inconclusive. More specifically, the question remains whether work engagement should be interpreted as a unidimensional construct, or whether it should be interpreted as three separate (but correlated) dimensions (i.e. vigour, dedication and absorption). Apart from these two options, however, there is also a third possibility: a bi-factor interpretation, which specifies one general dimension and two or more sub-dimensions (cf. Reise, Morizot & Hays, 2007). Bi-factor analysis was utilised to demonstrate this for the nine-item UWES (De Bruin & Henn, 2013), but to date not yet for the UWES-17.
Confirmatory factor analysis has yielded support for a three-factor model for UWES-17 (e.g. Coetzer & Rothmann, 2007; Mills, Culbertson & Fullagar, 2011; Nerstad, Richardsen & Martinussen, 2010; Salanova, Agut & Peiro, 2005; Seppälä et al., 2009; Storm & Rothmann, 2003), and also for other versions of the scale (e.g. Balducci et al., 2010; Fong & Ng, 2011; Hallberg & Schaufeli, 2006; Xanthopoulou, Bakker, Kantas & Demerouti, 2012; Yi-Wen & Yi-Qun, 2005). Yet, there are also studies in which a three-factor model of the UWES was not endorsed. Rothmann, Jorgensen and Marais (2011), found that after performing a principal components analysis and factor analysis and inspecting eigen values, one single factor could be extracted. Shimazu et al. (2008) and Sonnentag (2003) found support for a one-factor solution for the UWES-17 and a 16-item version respectively. Similarly, Wefald and Downey (2009) favoured a one-factor solution for a 14-item student version of the UWES. Moreover, Storm and Rothmann (2003) pointed out that a one-factor solution with correlated errors to reflect domain-specific shared variance exhibited a better fit than a three-factor solution. Both Storm and Rothmann (2003) and Salanova et al. (2005)- obtained acceptable fit for a three-factor solution once two items were removed from the UWES-17. Researchers have also examined a two-factor representation in addition to the one-factor and three-factor models. For instance, Naudé and Rothmann (2004) as well as Nerstad et al. (2010) reported support for a two-factor model of work engagement (vigour or dedication and absorption).
Apart from inconclusive findings concerning factor structure, studies also consistently report high inter-correlations amongst the three factors. In a meta-analysis of work engagement research, Christian and Slaughter (2007) reported the following mean correlations: 0.95 between vigour and absorption, 0.90 between dedication and absorption and 0.88 between vigour and dedication. Owing to high inter-correlation, researchers have proposed utilising a total score as an indicator of work engagement (e.g. Balducci et al., 2010; Schaufeli, Bakker & Salanova, 2006).
The present study
Whereas previous studies have employed confirmatory factor analysis to study the dimensionality of the UWES-17, the present study employs the Rasch partial credit model (Wright & Masters, 1982). Rasch models, which form part of a broad family of item response models, may be viewed as a prescription for fundamental measurement in the social sciences (Bond & Fox, 2007). Rasch measurement proceeds on the requirement that persons with higher trait levels should probabilistically obtain higher scores on all items than persons with lower trait levels. Similarly, all persons should probabilistically obtain higher scores on items that are easier to endorse than on items that are more difficult to endorse. Rasch models require that measures of persons should be independent from the particular set of items that were used to measure the persons. Similarly, item calibrations should be independent from the particular set of persons that were used to calibrate the items. Operationally, this means that: (1) person measures should be invariant across different partitions of a test (within measurement error) and (2) item calibrations should be invariant across different partitions of a sample of persons (within measurement error). These prescriptions provide a convenient way in which the hypothesis of unidimensionality can be tested. Rejection of the null hypothesis of invariant measures across different partitions of a test indicates that the set of items do not measure a unidimensional attribute. Conversely, failure to reject the null hypothesis indicates that the set of items adheres to the unidimensionality requirement. In addition, item fit statistics can be calculated to identify individual items that fail to adhere to the unidimensionality requirement.
Against this background the present study focuses on a test of the null hypothesis that the vigour, dedication and absorption subscales of the UWES-17 yield invariant person measures (within measurement error). Failure to reject the null hypothesis will provide support for a one-dimensional interpretation of the UWES-17, whereas rejection of the null hypothesis will provide support for a multi-dimensional interpretation.
Research design
Research approach
The research approach of this study is quantitative in nature, using a cross-sectional survey design. Furthermore, the study can be classified as psychometric since the aim is to investigate the internal psychometric properties of a psychological scale (see De Bruin & Buchner, 2010).
Research method
Research participants
The study employed data first described and analysed by Goliath-Yarde and Roodt (2011). The population was employees of a South African ICT company with a work force of 24 134 full-time employees up to middle-management level. Goliath-Yarde and Roodt (2011) employed a census-based approach to select 2429 participants such that each person had an equal chance of being included. There were 1536 (63.2%) men. The distribution in terms of race was as follows: Black people, n = 640 (26.3%), White people, n = 1070 (44.1%), people of mixed-race, n = 395 (16.3%), and Asian people, n = 324 (13.3%). The majority of participants described their job level as operational (55.3%), followed by specialists (26.7%), and management (18%). Goliath-Yarde and Roodt (2011) provide a complete description of the participants.
Measuring instrument
Work engagement was measured using the UWES-17 (Schaufeli et al., 2002). The UWES-17 is a 17-item self-reporting questionnaire that includes three subscales: vigour (six items, e.g. 'I am bursting with energy in my work'), dedication (five items, e.g. 'My job inspires me'), and absorption (six items, e.g. 'I feel happy when I'm engrossed in my work'). All items were scored on a seven-point frequency rating scale ranging from 0 (never) to 6 (every day). International and national studies reveal Cronbach alpha coefficients for the three subscales ranging between .68 and .91 (Goliath-Yarde & Roodt, 2011; Schaufeli et al., 2002; Storm & Rothmann, 2003).
Research procedure
Goliath-Yarde and Roodt (2011) give a full description of the research procedure. In brief, respondents were requested by email to complete a confidential online survey. The purpose of the study was explained in the email, and participants were assured of confidentiality.
Statistical analysis
The statistical analysis was conducted utilising the Rasch Unidimensional Measurement Model 2030 (RUMM 2030) program (see Andrich, Sheridan & Luo, 2012). Rasch models are based on the principle that person measures should be independent from the test that is used to make the measurement. Similarly, the calibration of the test should be independent from the particular group of persons on whose data the test is calibrated (Wright & Masters, 1982). This means that persons should obtain invariant measures across- different partitions of the test (for instance across different clusters of items). Similarly, item parameters should remain invariant across different partitions of persons (for instance a low-scoring group and a high-scoring group) (Wright & Masters, 1982). Deviations from these prescriptions indicate that the test does not measure a unidimensional construct or that the items function differently across different groups of persons (Bond & Fox, 2007; Smith, 2004).
Rasch partial credit analysis: The study capitalised on the invariance requirement of Rasch models to study the functioning of the UWES-17 and specifically employed the Rasch partial credit model (Wright & Masters, 1982) to examine the dimensionality and item fit of the UWES-17. The analyses performed are described below.
Thresholds: The partial credit analysis yields item threshold parameters, which indicate for every item the 'difficulty' in choosing a particular response option rather than the one preceding it (Wright & Masters, 1982). From a Rasch measurement perspective it is expected that the thresholds will be ordered (e.g. the threshold separating category 2 and category 3 should be higher than the threshold separating category 1 and category 2). Disordered thresholds indicate that persons did not use the response categories as intended and rescoring of categories could be considered before continuing with the rest of the analyses (Bond & Fox, 2007). If rescoring is necessary, the Person Separation Index (PSI) and the Cronbach's alpha coefficients will be examined to determine whether the reliability of the scale has been compromised in any way. Bond and Fox (2007) define the PSI as akin to the traditional Cronbach's alpha, denoting an estimate of the spread of persons on the variable being measured. Like Cronbach's alpha the PSI is indicative of a scale's reliability.
Local independence: Rasch models require local independence, which means that responses to an item should be uncorrelated with responses on any other item conditional on the trait (De Ayala, 2009). There are several indices of violations of local independence (see Orlando & Thissen, 2000). In this study the Pearson correlations between standardised Rasch residuals were used to identify pairs of items that are locally dependent (De Ayala, 2009; Yen, 1984).
Invariance of person measures: The invariance of person measures across subscales was investigated with dependent sample f-tests (Smith, 2004).
Data-model fit: Statistical tests of fit and inspection of item characteristic curves (ICCs) can be used to detect misfit of items (Marais, Styles & Andrich, 2011). Statistical tests of fit include the x2 and the fit residuals. The x2 reflects the property of invariance across a trait and a significant x2 implies that the 'hierarchical ordering of the items varies across the trait, thus compromising the required property of invariance' (Pallant & Tennant, 2007, p. 5). For excellent model fit, fit residuals should be as close to 0 as possible; items will fail to fit the model adequately when fit residuals exceed |2.5| (Shea, Tennant & Pallant, 2009). Visual comparison of the expected and observed ICCs were employed to gain a better understanding of the degree of misfit (Bond & Fox, 2007).
Test information curve (item-person map): In Rasch modelling the item and person locations can be placed on the same scale (test information curve) by logarithmically converting the values from the two locations into logits. This test information curve may then be used to indicate the range where the measurement of the latent trait functions less and more efficiently (De Bruin & De Bruin, 2011).
Results
Descriptive statistics
Descriptive statistics showed that responses to the UWES-17 items were non-normally distributed. Each of the 17 items was negatively skewed to some degree (see Table 1). The modal response for eight of the 17 items was 6, and for the remaining nine items it was 5. Apart from item 3 (which was also the most heavily skewed item), none of the items demonstrated problematic kurtosis.

Cronbach's coefficient alpha for the three scales was as follows: vigour, a = 0.88; dedication, a = 0.91; absorption, a = 0.85. The correlations between the three subscales were as follows: vigour and dedication, r = 0.86; vigour and absorption, r = 0.79; dedication and absorption, r = 0.79. The corresponding disattenuated correlations were 0.96, 0.91, and 0.90.
Rasch partial credit analysis of the 17-item Utrecht Work Engagement Scale
Thresholds: As a first step, the functioning of the seven-point ordered response scale employed by the UWES-17 was examined. The frequencies of responses in each of the seven response options (0 to 6) across the 17 items were as follows (the response option is given in parenthesis): 5% (0), 4% (1), 5% (2), 10% (3), 10% (4), 33% (5) and 34% (6). Disordered thresholds were observed for 15 of the 17 items, which indicates that the participants failed to use the response categories as intended. In particular, the frequency of responses in categories 2, 3 and 4 were lower than expected (see Figure 1a as an example of the disorder in the item threshold parameters).

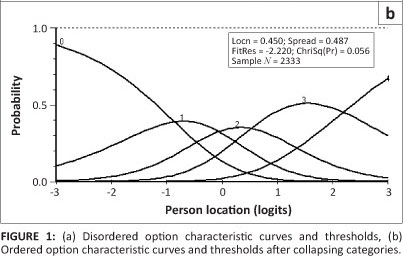
Against this background the data were rescored to produce a five-point response scale: responses of 0 and 1 were left unchanged, responses of 2 were recoded as 1, responses of 3 and 4 were recoded as 2, responses of 5 were recoded as 3 and responses of 6 were recoded as 4. Analysis of the rescored data yielded properly ordered thresholds for all the items (see Figure 1b).
Before rescoring, the data the PSI was .91, whereas after rescoring the PSI was .92. The corresponding Cronbach alpha coefficient was .95 for the original and rescored data. These- results show that rescoring the seven-point response scale to a five-point response scale did not lead to a reduction in reliability.
Local independence: As a second step we examined whether the data met the Rasch requirement of local independence by investigating the standardised residual correlations. Two unexpectedly high positive residual correlations were observed, namely for items 1 and 4 (r = .37), and items 4 and 5 (r = .32). These correlations indicate potential violations of the requirement of local independence (i.e. these pairs of items share something above and beyond the attribute of interest) (De Ayala, 2009).
Invariance of person measures: Next, the invariance of person measures across the vigour, absorption, and dedication subscales was investigated. For the vigour and dedication subscales dependent sample f-tests of person measures yielded statistically significant differences (a = .05) for 5% of the participants, which corresponds with the frequency expected by chance alone. Hence, these two subscales yielded invariant person measures. However, dependent sample t-tests returned statistically significant differences (a = .05) for 9% of the participants for absorption and dedication, and 8% for absorption and vigour. These frequencies are higher than the 5% that would be expected by chance alone, but still indicate that for more than 90% of the participants the subscales yielded invariant person measures within measurement error.
Data-model fit: Summary fit statistics were obtained for the scale as a whole (treating the 17 items as a unidimensional attribute). The total item-trait interaction was statistically significant, x2(153) = 1146.81; p < .0001), indicating misfit1. The mean standardised item fit residual was .44 (SD = 7.76), whereas the mean standardised person residual was 1.30 (SD = 1.58). These residuals, which focus on the interactions between items and persons, also indicate the presence of model-data misfit. Inspection of individual item fit statistics revealed three particularly poorly fitting items, namely items 6, 14 and 16. These items, which belong to the Absorption subscale, had very high positive fit residuals and chi-square values relative to the remaining items. Removal of these three items yielded improved overall fit, (x2(126) = 740.78;p < .0001, mean standardised item fit residual = -.24 [SD = 6.83], and mean standardised person residual = -.63 [SD = 1.82]). The negative residuals indicate some overfit, which may be attributed to the violations of local independence pointed out in the preceding paragraph.
Table 2 shows the item locations, standard errors and fit statistics for each of the 14 remaining items. The table shows unsatisfactory fit for several items from a statistical perspective (i.e. standardised fit residuals > |2.5| and/or chi-square p-values < .01). Note that relative to the other items, item 4 and item 5 had large negative fit residuals, which suggest some redundancy in content. These two items were also implicated in the violation of the local independence requirement.

Inspection of the empirical and theoretical item characteristic curves and the chi-square components for different class intervals showed that most of the observed misfit occurred at the low end of the trait (i.e. in the lowest class interval) where few persons were located. As an example, Figure 2a and Figure 2b show that for two of the worst fitting items (item 5, which overfits, and item 17, which underfits), the observed mean scores of eight of the nine class intervals were close enough to the model expected values to be practically useful (except in the very lowest class interval)2.
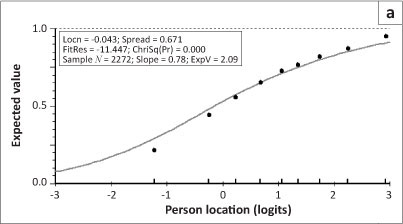

For item 5 the model expected score in the lowest class interval was 1.22, whereas the observed mean score was .86. Hence, persons with low standings on the trait scored even lower than expected on the item.
In turn, for item 17 the model expected value for the lowest class interval was 1.71, whereas the observed mean was 2.11. For this item, persons with low standings on the trait scored higher than expected. As a whole, however, these discrepancies, which affected a relatively small proportion of persons, did not severely threaten the interpretation of scores on the items. Against this background we decided to remove no further items.
Re-examining dimensionality and the requirement of local independence
Upon removal of the three misfitting items, dependent t-tests yielded statistically significant differences (a = .05) for 5% of the participants in each of the three comparisons (absorption and dedication, absorption and vigour, and vigour and dedication). This corresponds with the percentages expected by chance alone and indicates that the three subtests yielded invariant person measures within measurement error.
Test information curve
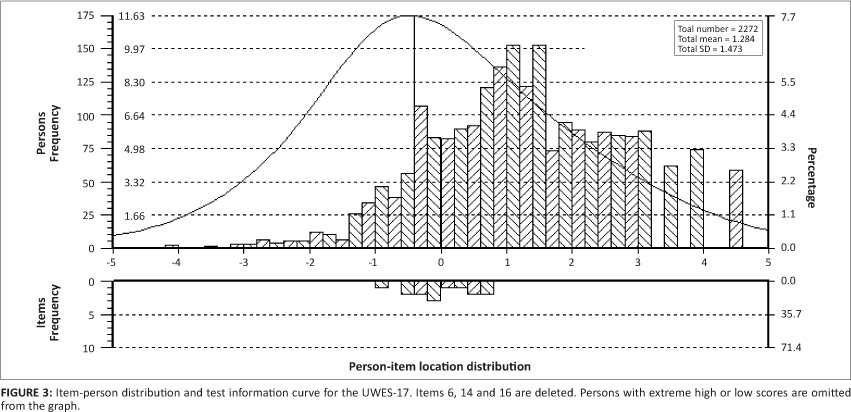
Figure 3 reflects the distributions of persons and items on the latent trait continuum.
The mean item location was 0 logits, whereas the mean person location was 1.28 logits (SD = 1.47). This shows that participants found it relatively easy to agree with the items. The test information curve shows that the UWES-17 provided most of its information at about -.5 logits, where relatively few persons are located. Indeed, comparison of the person distribution with the test information curve shows that a relatively large proportion of participants are located above 2 logits, where the scale provides relatively little information.
Discussion
We set out to examine the psychometric properties of the UWES-17 with an emphasis on the dimensionality of the 17 items. In particular, we aimed to shed light on whether the UWES-17 should best be interpreted as a unidimensional scale or as a multidimensional scale consisting of three components (i.e. vigour, dedication and absorption). Operationally, this relates to the question of whether a total score or three separate subscale scores should be interpreted. In brief, the results: (1) supported a unidimensional interpretation over a multidimensional interpretation, (2)- indicated that persons do not use the seven-point response scale as expected, (3) revealed a small number of items that do not fit the model, (4) showed that the scale provides relatively little information in the upper ranges of the trait (where most of the persons are located), and (5) revealed that the scale yields very reliable scores. In the paragraphs that follow these results are discussed.
Should a total score or three separate subscale scores be used?
At a minimum the interpretation of different subscale scores would require that the vigour, dedication and absorption subscales yield different information. In the present study the disattenuated correlations between the subscales approached unity and the hypothesis of invariance across the different subscales could not be rejected (albeit after three items were deleted). These results show that there is little to be gained by obtaining and interpreting subscale scores for vigour, dedication and absorption. In addition, the subscales can be expected to demonstrate very little incremental predictive value in contexts such as multiple regression and path analysis.
The results of previous studies about the dimensionality of the UWES-17, which for the most part employed confirmatory factor analysis, leave users of the UWES in a conundrum: a one-factor model does not receive empirical support, yet the better-fitting three-factor model yields such strong factor correlations that it does not make good sense to treat the factors separately. By adopting an item response modelling approach, which yielded a trait measure and corresponding standard error for each person, it was possible to demonstrate that respondents' standings on the latent trait remain constant (within measurement error) across the different subscales.
Use of the seven-point response scale
Results show that the participants did not use the full range of the seven-point response scale as expected when responding to the items. The low frequency of responses in categories 2, 3, and 4 leads to disorder in the Rasch-Andrich category thresholds. Rescoring the responses into five ordered categories produced ordered category thresholds and improved fit without loss in reliability. As a whole, it appears that the seven-point scale represents too fine a grading of respondents' self-descriptions. In comparison, the rescored categories reflect more accurately the manner in which respondents actually use the response scale.
Fit of the items
The Rasch model represents an ideal and it is unlikely that real data will fully meet the requirements of the model. Hence, one accepts that there will inevitably be some measurement disturbance (as indicated by fit statistics and graphical analysis) when analysing real data (Bond & Fox, 2007). However, items misfit to a degree and one should only tolerate measurement disturbances that will be inconsequential from a practical perspective. Fit statistics highlighted three particularly poorly fitting items, namely items 6, 14 and 16. Each of these items comes from the Absorption subscale. This finding suggests that of the three subscales Absorption does not fully align with work engagement as a unidimensional construct. In this sense, the results support the contention of authors such as Langelaan et al. (2006) and Schaufeli and Taris (2005) who have questioned whether Absorption should be seen as a core component of work engagement. However, upon removal of the poorly fitting items, the remaining Absorption items did not manifest problematic fit.
In addition to the three misfitting items, unacceptably high correlations between the standardised residuals of two pairs of items were observed, namely items 1 and 4, and items 4 and 5. As a whole these violations of the requirement of local independence are not too severe and they are likely to have minor measurement consequences. If anything, these violations are likely to lead to a slight overestimation of the reliability of the scale.
For whom does the scale function best?
Whereas the application of classical test theory methods yields a single reliability coefficient and standard error of measurement for a set of items, Rasch modelling provides a standard error for each individual (Wright & Masters, 1982). Comparison of the person and item locations shows that the respondents found the UWES-17 items easy to agree with. The test information curve shows that the scale provides most of its information for respondents in the lower range of the person distribution (i.e. the standard errors are smallest in this range). Hence, the UWES-17 provides the most precise measures for persons with relatively low standings on the engagement continuum. From an applied perspective the focus may exactly fall on improving the engagement of persons with low scores. In comparison, the measures of persons with high standings are less precise (i.e. the scale- is less successful in distinguishing between persons in the upper range of the engagement continuum). More items that are difficult to endorse will have to be written if the desired outcome is to obtain highly precise person measures. As a whole, however, the UWES-17 provides highly reliable scores.
Limitations
The present study has some limitations, which may stimulate further research on ways in which the measurement of work engagement may improve. Firstly, we did not examine how the UWES-17 relates to external criteria. On the basis of the present results one would expect these correlations to be very similar (after taking measurement error into account), especially if the three misfitting items are excluded. Secondly, the study did not employ an external replication sample. A related issue is whether the results will replicate across different demographic groups. In the present study no such distinction was made, but work by Goliath-Yarde and Roodt (2011) has suggested that the UWES-17 might function differently for different ethnic groups in South Africa. Against this background replication of the findings with new and demographically diverse samples is desired. However, the substantive finding of large overlap of the three sub-components is consistent with previous findings (e.g. Christian & Slaughter, 2007), which makes it less likely that the present results can be ascribed to sampling error.
Conclusion
Our results show that the UWES-17 is an excellent scale with very strong measurement properties. It yields invariant person measures across the absorption, dedication and vigour subscales. In accord with the scientific goal of parsimonious description, this indicates that a simple summed score across the items should be interpreted and used. Whereas the use of subscale scores may appear to be more complete, the overlap of the subscales is so large that the 'extra' information yielded by the subscales is likely to be illusory.
Acknowledgements
The authors thank Professor Gert Roodt (University of Johannesburg) for making the dataset utilised in the article available for further analysis.
Competing interests
The authors declare that they have no financial or personal relationship(s) that may have inappropriately influenced them in writing this article.
Author contributions
G.P.d.B. (University of Johannesburg) conducted the analysis and wrote the results and discussion sections. C.H. (University of Johannesburg) wrote the method section. C.M.H. (University of Johannesburg) wrote the literature review and K.-P.M. (University of Johannesburg) contributed to the literature review.
References
Andrich, D., Sheridan, B. & Luo, G. (2012). Rumm 2030. [Computer software]. Perth, Australia: Rumm Laboratories. [ Links ]
Bakker, A.B., Schaufeli, W.B., Leiter, M.P., & Taris, T.W. (2008). Work engagement: An emerging concept in occupational health psychology. Work and Stress, 22(3), 187-200. http://dx.doi.org/10.1080/02678370802393649 [ Links ]
Balducci, C., Fraccaroli, F., & Schaufeli, W.B. (2010). Psychometric properties of the Italian version of Utrecht Work Engagement Scale (UWES-9): A cross-cultural analysis. European Journal of Psychological Assessment, 26, 143-149. [ Links ]
Bond, T.G.B., & Fox, C.M. (2007). Applying the Rasch model: Fundamental measurement in the human sciences. Mahwah, NJ: Erlbaum. [ Links ]
Cameron, K.S., Dutton, J.E., & Quinn, R.E. (Eds.). (2003). Positive organisational scholarship: Foundations of a new discipline. San Francisco, CA: Berrett-Koehler Publishers. [ Links ]
Christian, M.S., & Slaughter, J.E. (2007). Work engagement: A meta-analytic review and directions for research in an emerging area. Academy of Management Proceedings, 1, 1-6. http://dx.doi.org/10.5465/AMBPP.2007.26536346 [ Links ]
Cilliers, F., & May, M. (2010). The popularisation of Positive Psychology as a defence against behavioural complexity in research and organisations. SA Journal of Industrial Psychology, 36(2), 1-10. http://dx.doi.org/10.4102/sajip.v36i2.917 [ Links ]
Coetzer, W.J., & Rothmann, S. (2007). A psychometric evaluation of measures of affective well-being in an insurance company. South African Journal of Industrial Psychology, 33(2), 7-15. [ Links ]
De Ayala, R.J. (2009). The theory and practice of item response theory. New York, NY: Guilford. [ Links ]
De Bruin, G. P., & Buchner, M. (2010). Factor and item response theory analysis of the Protean and Boundaryless Career Attitude Scales. SA Journal of Industrial Psychology, 36(2), 1-11. [ Links ]
De Bruin, G.P., & Buchner, M. (2010). Factor and item response theory analysis of the Protean and Boundaryless Career Attitude Scales. SA Journal of Industrial Psychology, 36(2), 1-11. [ Links ]
De Bruin, K., & De Bruin, G.P. (2011). development of the learner self-directedness in the workplace scale. SA Journal of Industrial Psychology, 37(1), 1-10. http://dx.doi.org/10.4102/sajip.v37i1.926 [ Links ]
De Bruin, G.P., & Henn, C.M. (2013). Dimensionality of the 9-item Utrecht Work Engagement Scale (UWES-9). Psychological Reports, 112, 1-12. http://dx.doi.org/10.2466/01.03.PR0.112.3.788-799 [ Links ]
Fong, T.C., & Ng, S. (2012). Measuring engagement at work: validation of the Chinese version of the Utrecht Work Engagement Scale. International Journal of Behavioral Medicine, 19(3), 391-397. http://dx.doi.org/10.1007/s12529-011-9173-6 [ Links ]
Goliath-Yarde, L., & Roodt, G. (2011). Differential item functioning of the UWES-17 in South Africa. SA Journal of Industrial Psychology, 37(1), 1-11. http://dx.doi.org/10.4102/sajip.v37i1.897 [ Links ]
Hallberg, U.E., & Schaufeli, W.B. (2006). Same same but different? Can work engagement be discriminated from job involvement and organisational commitment? European Psychologist, 11, 119-127. http://dx.doi.org/10.1027/1016-9040.11.2.119 [ Links ]
Langelaan, S., Bakker, A.B., Van Doornen, L.J.P., & Schaufeli, W.B. (2006). Burnout and work engagement: Do individual differences make a difference? Personality and Individual Differences, 40, 521-532. http://dx.doi.org/10.1016/j~.paid.2005.07.009 [ Links ]
Marais, I., Styles, I., & Andrich, D. (2011). Executive summary of the report on the psychometric properties of the Academic Perceptions of the Teaching Environment scale (APOTE) using the Rasch measurement model. Perth, Australia: Graduate School of Education, The University of Western Australia. [ Links ]
Mills, M.J., Culbertson, S.S., & Fullagar, C.J. (2011). Conceptualizing and measuring engagement: An analysis of the Utrecht Work Engagement Scale. Journal of Happiness Studies, 13(3), 519-545. http://dx.doi.org/10.1007/s10902-011-9277-3 [ Links ]
Naudé, J.L.P., & Rothmann, S. (2004). The validation of the Utrecht Work Engagement Scale for emergency medical technicians in Gauteng. South African Journal of Economic and Management Sciences, 7, 459-468. [ Links ]
Nerstad, C.G.L., Richardsen, A.M., & Martinussen, M. (2010). Factorial validity of the Utrecht Work Engagement Scale (UWES) across occupational groups in Norway. Scandinavian Journal of Psychology, 51, 326-333. [ Links ]
Orlando, M., & Thissen, D. (2000). Likelihood-based item-fit indices for dichotomous item response theory models. Applied Psychological Measurement, 24, 50-64. [ Links ]
Pallant, J.F., & Tennant, A. (2007). An introduction to the Rasch measurement model: An example using the Hospital Anxiety and Depression Scale (HADS). British Journal of Clinical Psychology, 46(1), 1-18. http://dx.doi.org/10.1348/014466506X96931 [ Links ]
Reise, S.P., Morizot, J. & Hays, R.D. (2007). The role of the bifactor model in resolving dimensionality issues in health outcome measures. Quality of Life Research, 16, 19-37. [ Links ]
Rothmann, S., Jorgensen, L.I., & Marais, C. (2011). Coping and work engagement in selected South African organisations. SA Journal of Industrial Psychology, 37(1), 107-117. http://dx.doi.org/10.4102/sajip.v37i1.962 [ Links ]
Saks, A.M. (2006). Antecedents and consequences of employee engagement. Journal of Managerial Psychology, 21, 600-619. http://dx.doi.org/10.1108/02683940610690169 [ Links ]
Salanova, M., Agut, S., & Peiró, J.M. (2005). Linking organizational resources and work engagement to employee performance and customer loyalty: The mediation of service climate. Journal of Applied Psychology, 90(6), 1217-1227. http://dx.doi.org/10.1037/0021-9010.90.6.1217 [ Links ]
Schaufeli, W.B., & Bakker, A.B. (2004). Job demands, job resources, and their relationship with burnout and engagement: A multi-sample study. Journal of Organizational Business, 25, 293-315. http://dx.doi.org/10.1002/job.248 [ Links ]
Schaufeli, W.B., & Bakker, A.B. (2010). Defining and measuring work engagement: Bringing clarity to the concept. In A.B. Bakker & M.P. Leiter (Eds.), Work Engagement: A handbook of essential theory and research (pp. 10-24). New York, NY: Psychology Press. [ Links ]
Schaufeli, W.B., Bakker, A.B., & Salanova, M. (2006). The measurement of work engagement with a short questionnaire: A cross-national study. Educational and Psychological Measurement, 66(4), 701-716. [ Links ]
Schaufeli, W.B., Salanova, M., González-Romá, V., & Bakker, A.B. (2002). The measurement of engagement and burnout: a two sample confirmatory factor analytic approach. Journal of Happiness Studies, 3, 71-92. [ Links ]
Schaufeli, W.B., & Taris, T.W. (2005). Commentary. The conceptualization and measurement of burnout: Common ground and worlds apart. Work and Stress, 19, 356-362. [ Links ]
Seligman, M.E.P. (2002). Authentic happiness. New York, NY: Free Press. PMCid:PMC137417 [ Links ]
Seppälä, P., Mauno, S., Feldt, T., Hakanen, J., Kinnunen, U., Tolvanen, A. et al. (2009). The construct validity of the Utrecht Work Engagement Scale: Multisample and longitudinal evidence. Journal of Happiness Studies, 10, 459-481. http://dx.doi.org/10.1007/s10902-008-9100-y [ Links ]
Shea, T.L., Tennant, A., & Pallant, J.F. (2009). Rasch model analysis of the Depression, Anxiety and Stress Scales (DASS). BMC Psychiatry, 9(21). http://dx.doi.org/10.1186/1471-244X-9-21 [ Links ]
Shimazu, A., Schaufeli, W.B., Kosugi, S., Suzuki, A., Nashiwa, H., Kato, A. et al. (2008). Work engagement in Japan: Validation of the Japanese version of the Utrecht Work Engagement Scale. Applied Psychology: An international review, 57(3), 510-523. http://dx.doi.org/10.1111/j.1464-0597.2008.00333.x [ Links ]
Smith, E.V. (2004). Detecting and evaluating the impact of multidimensionality using item fit statistics and principal components analysis of residuals. In R.M. Smith, & E.V. Smith (Eds.), Introduction to Rasch measurement (pp. 575-600). Maple Grove, MN: JAM Press. [ Links ]
Sonnentag, S. (2003). Recovery, work engagement, and proactive behavior: A new look at the interface between nonwork and work. Journal of Applied Psychology, 88(3), 518-528. [ Links ]
Storm, K. & Rothmann, S. (2003). A psychometric analysis of the Utrecht Work Engagement Scale in the South African police service. South African Journal of Industrial Psychology, 29(4), 62-70. [ Links ]
Wefald, A.J. & Downey, R.G. (2009). Construct dimensionality of engagement and its relation with satisfaction. The Journal of Psychology, 143(1), 91-111. http://dx.doi.org/10.3200/JRLP.143.1.91-112, PMid:19157075 [ Links ]
Wright, B.D., & Linacre, J.M. (1994). Reasonable mean-square fit values. Rasch Measurement Transactions, 8(3), 370. Retrieved August 28, 2013, from http://www.rasch.org/rmt/rmt83b.htm [ Links ]
Wright, B.D., & Masters, G.N. (1982). Rating scale analysis. Chicago, IL: Mesa Press. [ Links ]
Xanthopoulou, D., Bakker, A.B., Kantas, A., & Demerouti, E. (2012). Measuring burnout and work engagement: Factor structure, invariance, and latent mean differences across Greece and the Netherlands. International Journal of Business Science and Applied Management, 7(2), 40-52. [ Links ]
Yen, W.M. (1984). Effects of local item dependence on the fit and equating performance of the three-parameter logistic model. Applied Psychological Measurement, 8, 125-145. http://dx.doi.org/10.1177/014662168400800201 [ Links ]
Yi-Wen, Z., & Yi-Qun, C. (2005). The Chinese version of the Utrecht Work Engagement Scale: An examination of reliability and validity. Chinese Journal of Clinical Psychology, 13, 268-270. [ Links ]
 Correspondence:
Deon de Bruin
PO Box 524, Auckland Park 2006, South Africa
deondb@uj.ac.za
Received: 08 May 2013
Accepted: 10 Sept. 2013
Published: 23 Oct. 2013
1.It should be noted that the large sample size made the chi-square test of item-trait interaction so powerful that even minor discrepancies from expected values were significant. To illustrate, the chi-square for an adjusted sample size of 500 was statistically non-significant.
2.We also calculated the infit mean square statistic in Winsteps. Items with infit mean square values between 0.6 and 1.4 are typically regarded as acceptable for rating scales (Wright & Linacre, 1994). For the UWES-17 data the values ranged from .65 (item 5) to 1.39 (item 17).

