


Services on Demand
Article
 English (pdf)
 Article in xml format
 Article references
Indicators

Related links
-
 Cited by Google
 -
 Similars in Google
Share

 Permalink
SA Journal of Industrial Psychology
On-line version ISSN 2071-0763
Print version ISSN 0258-5200
SA j. ind. Psychol. vol.39 n.1 Johannesburg Jan. 2013
ORIGINAL RESEARCH
The role of socio-demographic variables and their interaction effect on sense of coherence
Antoni Barnard
Department of Industrial and Organisational Psychology, University of South Africa, South Africa
ABSTRACT
ORIENTATION: Socio-demographics play a role in sense of coherence (SOC), indicating the strength of resistance resources available to employees from different socio-demographic groupings.
RESEARCH PURPOSE: To explore whether and how socio-demographic variables and their interactive effect determine a distinctively high or low SOC.
MOTIVATION FOR THE STUDY: Various studies include an exploration of the role of socio-demographic attributes on SOC, yet do not investigate the interactive effect of these socio-demographics on high or low SOC.
RESEARCH DESIGN, APPROACH AND METHOD: Quantitative, cross-sectional survey design. The chi-square interaction detection method (CHAID) was applied to a large-scale employee sample (n = 7185). Confirmatory analysis was done by exploring predictor effects on two possible permutations of high or low SOC classifications.
MAIN FINDINGS: Results indicated a statistically significant four-factor interactive effect of demographic variables on SOC. Level of income most strongly partitioned high to low SOC ratio groups. Marital status and number of dependants, with level of income, further distinguished statistically distinct high to low SOC ratio groups. Race indicated distinct high to low SOC ratio groups in the higher income group. No statistically significant effects were found for age and gender.
PRACTICAL/MANAGERIAL IMPLICATIONS: Companies should provide lower income employees with financial counselling and special support for single or divorced employees and employees who are married but the sole household earner. In the middle to high income category employee assistance should cater for employees with dependants and especially for the sole household earners.
CONTRIBUTION/VALUE-ADD: Establishing whether and how demographic variables predict high to low SOC ratios broadens the theoretical knowledge base of SOC. The study contributes methodologically in its application of CHAID analysis.
Introduction
Since Antonovsky (1987) initially proposed the salutogenic theory of health, a wealth of research on sense of coherence (SOC) has been generated. Work-related wellness studies demonstrate that SOC affects how employees cope with work-life demands to remain high-performing, goal-achieving individuals (Austin & Cilliers, 2011; Basinska, Andruszkiewicz & Grabowska, 2011; Oosthuizen & Van Lill, 2008; Urakawa, Yokoyama & Itoh, 2012). Some have focused on the construct validity and equivalence of different SOC-measure formats (see Bernabé et al., 2009; Eriksson & Lindström, 2005; Feldt et al., 2007; Jakobsson, 2011; Naaldenberg, Tobi, Van den Esker & Vaandrager, 2011). Many have explored the role of SOC in mediating resilient and non-resilient life responses such as burnout, achievement and adjustment in various work and life contexts and stages (see Urakawa et al., 2012; Van der Westhuizen, De Beer & Bekwa, 2011; Wiesmann & Hannich, 2012). Studies exploring the role of socio-demographic variables in SOC demonstrate variable results and mostly focus on the stability of SOC over the lifespan (Feldt et al., 2011; Volanen, Lahelma, Silventoinen & Suuominen, 2004). A few South African studies have explored socio-demographic differences with regard to SOC, but as part of a broader salutogenic research objective in small and mostly company-specific samples (see Barnard, Peters & Muller, 2010; Breedt, Cilliers & Visser, 2006; Gropp, Geldenhuys & Visser, 2007; Van Schalkwyk & Rothmann, 2008).
The predictive effect of socio-demographic variables on the level of SOC remains an important research endeavour as research mostly focuses on describing SOC level differences in relation to single demographic variables such as age, gender and race. There is a need for research exploring the interactive role of socio-demographic variables for distinguishing high and low SOC scores (Volanen et al., 2004). For this study, the effect of demographics on average SOC scores was not of interest. The key focus of this article is to provide a comprehensive, yet simple, analysis of various socio-demographic factors and their interactive effect for distinguishing high and low SOC in a large-scale South African employee sample. This study contributes to the constantly growing body of salutogenic research to understand well-being and adjustment in the workplace. Organisations could benefit from a comprehensive understanding of the demographic profile potentially impacting the level of employees' SOC as they could adjust wellness programmes to specific employees' wellness promotion needs.
Research objective
The objective of this study was to explore the potential predictive effect of various socio-demographic variables for distinguishing distinctly different high to low SOC ratio groups, taking into consideration possible interaction effects of these socio-demographics on SOC. In applying data classification analyses this study sought to answer the following specific research questions:
1. Which demographic variables most strongly predict level of SOC?
2. Which combination of levels of the identified demographic variables best identifies employee groups most likely to display a high SOC?
3. Which combination of levels of the demographic variables best identifies employee groups most likely to display a low SOC?
Literature review
According to Rothmann and Ekkerd (2007), wellness is widely accepted as the conceptual anchor of Antonovsky's salutogenic approach, in which SOC is regarded as a source of resilience and a wellness-protecting orientation to life (Bernabé et al., 2009; Eriksson & Lindström, 2005; Feldt et al., 2011; Gropp et al., 2007). Acknowledging that life is inherently stressful, salutogenic theory postulates that people cope well due to generalised resistance resources (GRRs), which include personal and environmental characteristics that provide a person with meaningful and coherent life experiences to facilitate the effective management of stress (Antonovsky, 1987; Eriksson & Lindström, 2005). Through GRRs people create life experiences that help them: 'to see the world as "making sense", cognitively, instrumentally and emotionally' (Antonovsky, 1996, p. 15). Generalised resistance resources accumulate during one's life to form and reinforce SOC (Wiesmann & Hannich, 2012). SOC is thus conceptualised as a dispositional life orientation to help one to constructively assess and respond to environmental challenges (Basinska et al., 2011). SOC is operationalised in the dynamic interplay between the three subcomponents of comprehensibility, manageability and meaningfulness (Antonovsky, 1987; Eriksson & Lindström, 2005; Feldt et al., 2011). Comprehensibility is the cognitive SOC component- that enables one to see the environment as structured and predictable. Manageability is the instrumental or behavioural SOC component and represents the perception that one has adequate resources to manage life demands. Meaningfulness, the motivational SOC component, is believing life demands are worthy and meaningful to engage with and spend effort on. A strong body of research has accumulated demonstrating that SOC not only affects general wellness, but also modifies job stress responses in the work context (Urakawa et al., 2012).
Rothmann and Ekkerd (2007) emphasise that wellness is generally not experienced uniformly and argue that perceived wellness may be influenced by various socio-demographic variables such as age, gender and educational level. Different strands of SOC-related research indicate a need to continue to explore the role of socio-demographic variables in SOC; these are discussed below, highlighting the importance of studying age, culture, gender and other socio-demographic variables in the SOC context.
The role of age in sense of coherence
Antonovsky's theory originally postulated that SOC develops through early adulthood including the first employment years and only becomes more stable after the age of 30 (Liukkonen et al., 2010; Van Schalkwyk & Rothmann, 2008). The expected stabilisation of the SOC level after 30 is referred to as the 'age hypothesis' (Antonovsky, 1987). Subsequent studies concur SOC stability over 30 years (Feldt et al., 2011; Hochwälder & Forsell, 2011), whilst others have noted that SOC is not as stable over the adult life span (Eriksson & Lindström, 2005; Wainwright et al., 2008). Studies also show that high SOC remains more stable in adulthood than low SOC (Hakanen, Feldt & Leskinen, 2007; Nilsson, Holmgren, Stegmayr & Westman, 2003). Research by Schnyder, Büchi, Sensky and Klaghofer (2000) demonstrates the relative stability of SOC over time, yet similarly to Wiesmann & Hannich (2012) they also conclude that far-reaching and traumatic events may threaten to change SOC later in life. In the South African context, Van Schalkwyk and Rothmann (2008) could also not confirm the reported stability of SOC from the age of 30 and beyond; however, the mean SOC in their sample levelled off beyond 50 years of age as associated with the progressive and time-related mastering of work and life complexities. The authors argue that stability in SOC is a generational phenomenon rather than a chronological-age phenomenon. Looking purely at differences between age groups, Feldt et al. (2011) report significantly higher SOC in older adults than in young adults, although mean level of SOC increased more over time for younger adults than for older adults. The theoretical assumption of SOC stability in adulthood has thus been the focus of various studies with varying results, pointing to the need to continue researching SOC in relation to age.
Cultural and gender differences in sense of coherence
Various studies seem to indicate significant differences in the level of SOC amongst different cultures. Mayer (2011) finds higher SOC scores for Black and Indian managers than for White Afrikaans and English-speaking South African and German managers. Barnard et al. (2010) find significantly higher SOC scores amongst Black and Mixed Race employees of an insurance company than their White and Indian counterparts. Similarly Gropp et al. (2007) establish variance in the SOC subcomponent scores of comprehensibility and meaningfulness between White and Black employees of a financial services organisation. Breedt et al. (2006) conclude that salutogenic functioning manifests differently between different cultural and language groups based on having found significant differences in the factor structure of the SOC between White people and other population groups. According to Naaldenberg et al. (2011), the validity and reliability of a 13-item SOC-measure differ substantially for different populations due to language differences. In a sample of postgraduate South African students, Van der Westhuizen, De Beer and Bekwa (2013) also establish differences in SOC level between race groups, but find no significant differences between gender groups. On gender differences, earlier studies note higher SOC levels in men than in women (Anson, Paran, Neuman & Chernichovsky, 1993; Antonovsky & Sagy, 1985; Larrson & Kallenberg, 1996). Volanen et al. (2004), however, find limited differences between male and female Finnish respondents and Lindström and Eriksson (2005) conclude that women seem to score lower than men, yet not significantly, and attribute small gender-based SOC differences rather to social factors. These SOC findings therefore also indicate the importance of continued study of SOC with regard to culture and gender.
Other socio-demographic variables and sense of coherence
Previously, Larsson and Kallenberg (1996) found that educational level was unrelated to SOC. Van Schalkwyk and Rothmann (2008), however, found significant differences in SOC level for qualification and job level, but none for age, gender and language in a chemical factory context. They found SOC to increase with job level and qualification level, similar to the study by Liukkonen et al. (2010) in which level of SOC was related to upward career movement. Liukkonen et al. (2010) ascribe this effect of career movement on SOC to an improved financial position. Contrary to Grayson (2008), Van der Westhuizen et al. (2011) find no significant relationship between SOC and academic achievement. Barnard et al. (2010) empirically confirm a positive relationship between SOC and financial health variables, in particular level of income (as also in studies by Larsson & Kallenberg, 1996; Lundberg & Nyström, 1994; Volanen et al., 2004), debt management and financial planning. In their study, differences in the SOC level were also linked to marital status (Barnard et al., 2010). Volanen et al. (2004) found strong links between SOC level and marital status, having children, unemployment and level of education. The authors highlight the lack of studies exploring the reciprocal effect of socio-demographic variables and propose the study of basic demographic variables such as age and education, work-life variables such as employment and socio-economic status, as well as family life variables such as marital status and number of dependants (Volanen et al., 2004).
Research design
Research approach
The research objective was reached through a quantitative cross-sectional survey design. Secondary data were used as data originated from a large-scale online employee wellness survey which included a six-item orientation to life questionnaire (OLQ) and a biographical questionnaire. Decision-tree algorithms integrating multiple predictor variable effects were generated by means of applying the chi-square interaction detection method (CHAID), which is a statistical predictive classification methodology based on multivariate chi-square data partitioning analysis.
Research method
Research participants
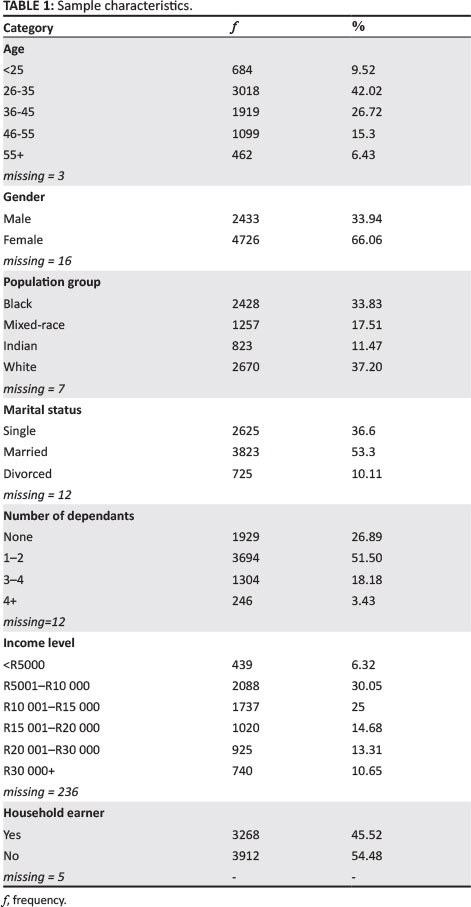
The authors used an available sample of 7185 white-collar employees across several business sectors in South Africa, including finance, banking, construction, education, retail, mining, food and beverage, government departments, healthcare, travel and leisure, technology, telecommunications, professional services, chemical, utilities, automotive, real estate and manufacturing. All of the 10 186 employees responded to the online questionnaire, out of which 7185 constituted complete and useable OLQ-6 and biographical questionnaires. The sample is described in Table 1 in terms of various demographics, including age, gender, population group, marital status, number of dependants, income level and household earner status.
Measuring instruments
Van Schalkwyk and Rothmann (2008) derived a six-item SOC model with goodness-of-fit statistics (X2 = 3.95; df = 8; IFI = 0.97; CFI = 0.97; RMSEA = 0.06) and high reliability indexes (a = 0.72 and r = 0.93 when compared to OLQ-11 format). The same six SOC items were confirmed by Barnard and Muller (2012) to be a credible measure of SOC (a = 0.86) and indicative of an overall one-factor SOC structure (X2 = 5638.76). As such, from the original OLQ-29, the same items 8 and 28 (meaningfulness), 12 and 19 (comprehensibility) as well as 9 and 29 (manageability) comprised the OLQ-6 used here. Items are scored on a seven-point ordinal rating scale ranging from 'very often' (1) to 'very seldom or never' (7) for five of the items and from 'no clear goals or purpose at all' (1) to 'very clear goals and purpose' (7) for the remaining item. In addition, respondents also completed a biographical questionnaire.
Research procedure
Data were gathered as part of an Internet-based wellness survey conducted by Summit Financial Partners SA. Employees received an email invitation including a description of the purpose of the survey, relevant ethical parameters (i.e. confidentiality, anonymity and freedom to participate) and a link to the Internet-based survey. Employees understood that by following the link and completing the survey they had consented to participate in the study and that the data would be used for research.
Data analysis
To investigate the interactional effect of demographic variables on SOC, a data classification method, CHAID, was chosen. The chi-square interaction detection method is a simple multivariate and data partitioning technique yielding a decision-tree algorithm that incorporates the joint effect of a variety of predictor variables on a dependent variable in one model (Kass, 1980; Muller, Prinsloo & Du Plessis, 2007). The chi-square interaction detection method analysis is particularly effective with large data sets (n = 7185 in this study) and systematically applies a series of chi-square statistics to automatically select the predictor variables that optimally and significantly predict the dependent variable (Giorgi, 2009; Muller et al., 2007). The chi-square interaction- detection method is especially useful for data expressed as categorical values as opposed to continuous values and elicits a visual prediction model in the form of a classification or decision tree (Eherler & Lehmann, 2001; Kass, 1980). The total SOC score from the OLQ-6 was defined as the dependent variable (excluding total SOC scores that express an average SOC rating) and the potential predictor variables chosen and analysed included age, gender, population group, marital status, number of dependants, level of income and household earner status. The IBM SPSS (version 21) was used for the analysis.
The chi-square interaction detection method commences with the complete sample set partitioned according to the distinctive levels of the dependent variable. As such SOC sample scores were divided into distinctive 'low' and 'high' SOC categories (excluding average SOC ratings). Probable demographic predictors were then automatically evaluated and the variable that split the data into the most distinctly different high to low SOC ratio subgroups was identified by means of the statistically most significant chi-square statistic on high or low SOC frequencies. Subsequently each high or low SOC subgroup was again investigated to select further demographic predictor variables interacting statistically most significantly with high and low SOC scorers. The process was repeated until no further statistically significant demographic predictor could be identified or a CHAID stopping rule came into play (such as the maximum level of the decision tree).
Results
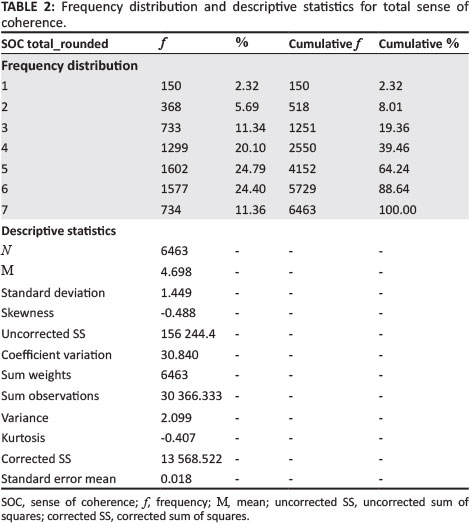
Descriptive statistics
Descriptive statistics for total SOC are depicted in Table 2. From the total sample (n = 7185) 722 missing responses were reported. The slightly skew distribution indicates a fairly good SOC for most employees in the sample with mean total SOC of 4.7 (SD = 1.45). As such it was decided to conduct two CHAID analyses exploring demographic predictors for high and low SOC scores. In the first analysis low and high SOC were distinguished by mean SOC +/- standard deviation (i.e 4.7 +/- 1.45) where low SOC was indicated by SOC scores less than 3.3 (n1 = 1101) and high SOC by SOC scores more than 6.2 (nu = 945); an average SOC comprised a normally distributed 68.34% (nm = 4417) of the total sample. Secondly, it was decided to explore and confirm demographic predictor effects by selecting low and high SOC groups as distinguished by SOC scores below 4 and SOC scores above 5. Category 4 and 5 scores comprised 2901 of the respondents and, since the mean SOC score was 4.7 and the SOC distribution slightly positively skewed, it was reasonable to regard 4 and 5 scorers as average SOC not distinctly categorised as high or low SOC. Here SOC scores of 1, 2 and 3 were regarded as low SOC (n1 = 1251) and scores of 6-7 as high SOC (nu = 2311), with 4 and 5 as average SOC (nm = 2901). In both CHAID analyses the average SOC responses were omitted since the focus is low and high SOC performance.
Chi-square interaction detection method analyses results
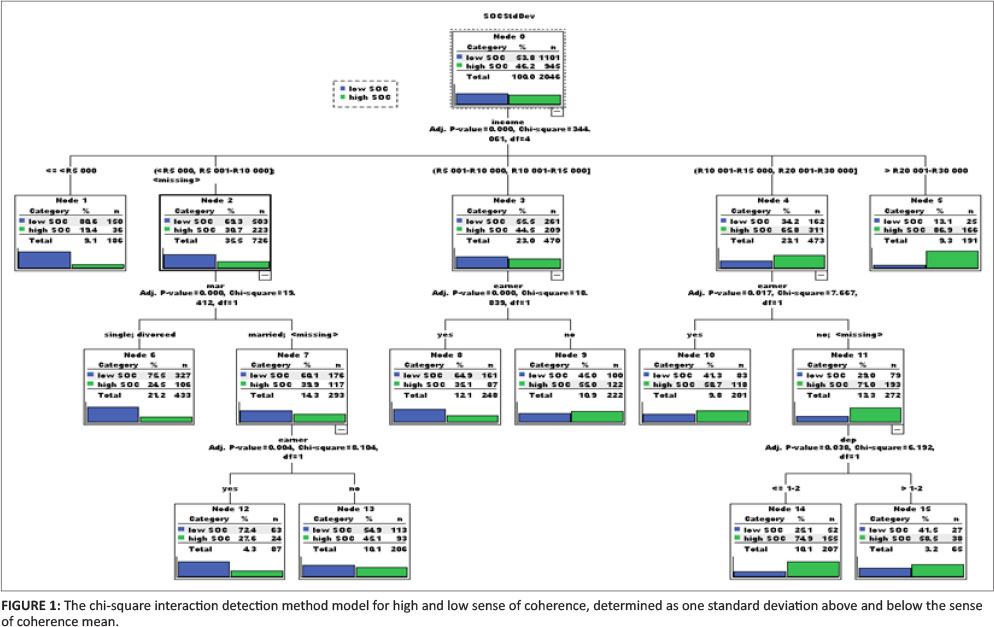
Figure 1 displays the CHAID data partitioning model on high and low SOC scores determined as values above and below one standard deviation of the SOC mean where 'low' SOC is SOC scores under 3.3 and 'high' SOC means scores over 6.2. This decision tree displays the joint effect of income, marital- status, household earner status and number of dependants on SOC classification with 69.1% accuracy (thus a risk factor of 30.9%). Age, population group and gender were also entered into the analysis but had no significant predictive effect. For this model the income variable acts as primary high to low SOC ratio partitioning agent statistically significantly partitioning SOC data with the most distinct high to low ratio differences into subsets (X2 = 344.061; p ≤ 0.001). From the high to low SOC ratios in nodes 1-5 of Figure 1 it is evident that higher income level interacts significantly with higher SOC, indicating income to be the best predictor of high SOC amongst the demographics applied here.
In node 2, the lower income group (<R10 000) and marital status further partitioned SOC data into distinctly different high to low SOC ratio groups (X2 = 19.412; p ≤ 0.001), indicating divorced and single people to have a higher probability of wellness problems if they are also in a lower income group. Being single or divorced in the lower income group presents with a high low-SOC probability and marriage may act as a potential GRR for a better SOC. Being the sole household earner places additional stress on married people in the lower income category. The earner variable identified and partitioned high to low SOC ratio differences into significantly distinct groups (X2 = 8.104; p ≤ 0.001) with sole earner presenting a high low-SOC probability evident in the low high to low SOC ratio (0.38) in node 12.
The impact of being the sole household earner is also evident in the significant splitting (X2 = 18.809; p ≤ 0.001) of node 3 (combined income groups R5001-R15 000), where being the sole earner presents a higher probability for low SOC (high:low SOC ratio = 0.54). No demographic variables significantly split nodes 8 and 9 any further. For the combined income groups R10 001-R30 000 (which the CHAID algorithm automatically combines if similar response patterns are detected over categories), node 4, being the sole household earner again partitioned SOC into distinctly different high to low SOC ratio groups (X2 = 7.007; p < 0.001), indicating a greater low-SOC probability if you are the sole household earner. The double household income category (node 11) denotes a much greater high to low SOC ratio (2.41), indicating greater probability of high SOC in this grouping. Node 11 was further split significantly by the number of dependants (X2 = 6.192; p < 0.001), indicating that people with fewer than two children were more likely to have high SOC (high:low SOC = 2.98). All the predictor variables seem to relate to the stress of coping with an additional financial burden, that is, being the sole household earner and having more dependants seem to indicate a greater probability of low SOC.
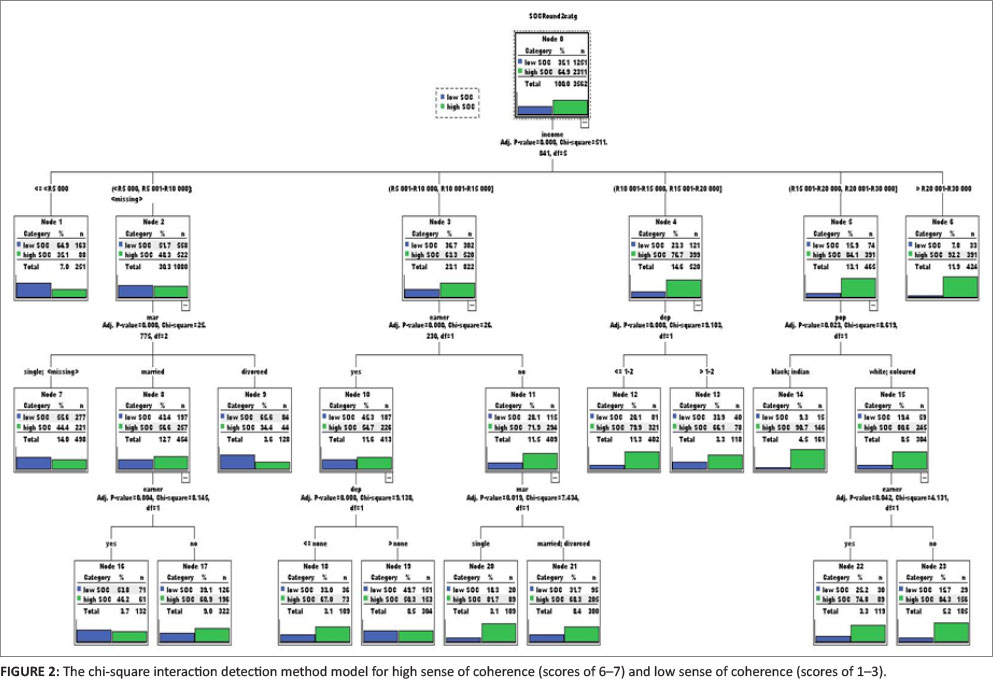
Figure 2 displays the CHAID model for high and low SOC as determined by omitting SOC scores of 4 and 5, with 'low' SOC including SOC scores of 1-3 and 'high' SOC including SOC scores of 6 and 7. This decision tree displays the joint effect of income, marital status, household earner, number of dependants and population group on SOC with 70% accuracy (30% risk factor). Age and gender were also entered into the analysis but had no significant prediction effect. Similar to the previous analysis the primary high and low SOC splitting agent here was the income variable, significantly distinguishing people with a high SOC from those with a low SOC (X2 = 511; p < 0.001). Nodes 1-6 confirm the previous analysis results that higher income level interacts significantly statistically with higher SOC, again indicating income to be the best predictor in this study.
As in the first CHAID analysis, the lower income group (<R10 000) is significantly partitioned into distinctly different high to low SOC ratio groups by the marital status variable (X2 = 25; p < 0.001). Here again marriage acts as a potential GRR for facilitating a high SOC, with divorced employees presenting with the lowest high to low SOC ratio (0.52) and thus the greatest low SOC probability (node 9). Single employees in this income category seem to present with a moderate high to low SOC ratio pattern and the analysis did not suggest a further split here. Household earner status further acted as statistically significant splitting agent between high to low SOC ratio groups in the lower income married group (X2 = 8.145; p < 0.001), indicating double income in this group (node 17: high:low SOC = 1.56) to be an additional GRR for strengthening SOC.
In the middle income category (node 3: combined income groups R5001-R15 000) the sole household earner determined a significant split (X2 = 28.2; p < 0.001) between distinctive high to low SOC ratio groups. Sharing income- again relates to a stronger probability for high SOC (node 11: high:low SOC ratio = 2.56). Marital status and number of dependants further distinguished significantly statistically between distinctly different high to low SOC ratio groups in this income group. Being the sole earner with no dependants interacts for a stronger high SOC probability (node 18: high:low SOC ratio = 2.02), as does being single, but not the sole earner (node 20: high:low SOC ratio = 4.45). Number of dependants also partitions distinctively different high to low SOC ratio groups (chi-square = 9.1; p < 0.001) for the combined income groups R10 001-R20 000, indicating that more dependants (node 13: high:low SOC ratio = 1.95) may place an additional burden on people's SOC as opposed to fewer dependants (node 12: high:low SOC ratio = 3.96).
Unlike the previous CHAID analysis, the combined income group R15 001 to over R30 000 (node 5) is primarily split significantly by population group (X2 = 8.619; p < 0.001) indicating that although generally high SOC prevails in this group, a greater low SOC probability in the White/ Mixed Race population category (node 15: high:low SOC ratio = 4.15) is present than in the Black/Indian category (node 14: high:low SOC ratio = 9.87). The White/Mixed Race population category (node 15) is further statistically significantly partitioned by the sole earner variable (X2 = 4.101; p < 0.001). Similar to the lower income, married interaction subset (node 16 and node 17), being the sole earner - even in this generally high SOC group - places additional strain on wellness levels as it distinguishes a greater probability for low SOC (compare the lesser high:low SOC ratio in node 22 = 2.97 to that of node 23 = 5.45).
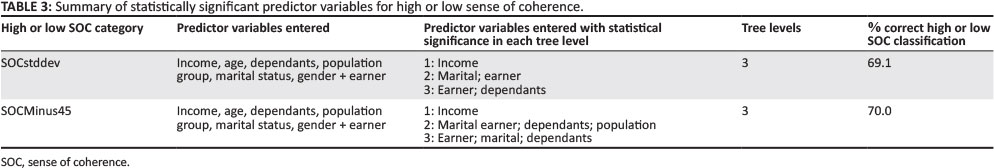
In summary, Table 3 below depicts statistically significant predictor variables that emanated from the two CHAID models discussed and reports on the predictive power of these models as the percentage of correct model classifications of high and low SOC scores. From both decision trees it is evident that income is the primary high and low SOC splitting agent and thus the best predictor of SOC level in this study. Marital status, household earner status, number of dependants and population group interact in various ways to significantly distinguish high or low SOC probability. Gender and age were the only variables that had no significant prediction in any of the two analyses.
Discussion
Whilst there are many studies on the associations between health and SOC, the background predictive factors of SOC have been much less examined (Volanen et al., 2004). This study sought to explore whether and how distinctive high or low SOC scores are determined by various socio-demographic variables, also taking into consideration the potential interaction effects of these predictors on high or low SOC. CHAID multivariate, data classification analysis was applied to a response set of n = 7185 South African employees across a wide range of industries and organisations. Confirmatory analysis on this data set - initially classified as high or low SOC values either above or below one standard deviation of the SOC mean - was done by exploring predictor effects on a second possible permutation of high and low SOC classifications (according to low SOC as values <4 and high SOC as values >5).
The strongest predictor: Level of income
The study first set out to determine which demographic variable most strongly predicts SOC level. Results indicate that level of income most strongly predicts SOC. People with a higher income display a greater probability of a high SOC than those in lower income categories. The fact that no predictor variables distinguished distinctly different high to low SOC ratio groups in the very high income category (R30 000 and over) confirms that financial income is a primary GRR in employees' daily coping and perceived wellness. This finding reflects the deduction made by Breedt et al. (2006) that material resources such as money and wealth contribute to a high SOC. Some earlier studies also found that income- was strongly related to SOC (Barnard et al., 2010; Larsson & Kallenberg, 1996; Lundberg & Nyström, 1994; Volanen et al., 2004).
Demographic interaction effect predictions
The second and third study objectives focused on determining which combination of levels of demographic variables best defines the probability of a high or a low SOC. Through the CHAID analyses, various demographic interaction effects distinguishing significantly between high or low SOC scorers were identified. Most of these confirm the deduction that financial resources play a key role in maintaining a high SOC. This study confirmed the value of material resources in the lower and medium income groups, showing that having a double household income significantly contributes to greater probability of a high SOC. Number of dependants seems to be an additional burden with regard to wellness for the middle income group (R10 000-R20 000) as well as for the sole earners in the combined income group (R10 000-R30 000). Sharing of financial stressors as well as work-life roles and responsibilities (i.e. being married and sharing a double income) thus seem to act as possible GRRs for strengthening SOC. SOC in the middle to high income group (R10 000-R20 000 and R20 000-R30 000) is especially affected by the number of dependants, as more dependants seem to predict greater probability of a low SOC. Organisational wellness interventions aimed at this income category may therefore add value when considering child care, bursaries and additional parental and financial guidance for employees. The average earner may have enough resources to live a fairly good life, but children inevitably burden some employees' financial resources as well as their life-role responsibilities and balance. In a large-scale Finnish study Volanen et al. (2004) found socioeconomic status as well as social support (as manifested by having a relationship with a partner) were strongly associated with high SOC. They concluded that the effect of social support on high SOC may be stronger than that of socioeconomic status. The impact of social support on SOC in the form of being in a marital relationship and not being the sole household earner was statistically significant in this study, yet level of income was the predominant predictor. Social support in the form of relationship building should however receive due attention in wellness interventions as it definitely plays a role in strengthening SOC.
Age, gender and population group effects
According to Jakobsson (2011) the construct validity of SOC may differ depending on the age group; he found the 13item version not to be representative of the SOC construct's theoretical subcomponents amongst older people. With the OLQ-6 in this study neither age nor gender had an impact on SOC, which may be a preliminary indication that the broad SOC construct does not differ statistically significantly with regard to age or gender. Although this study did not test the age hypothesis for SOC stability, the findings could also not corroborate others that indicated a general upward SOC trend with age (see Feldt et al., 2011). Although not confirmed in the first CHAID analysis, the significant impact of population group in the high income category of the second analysis may point to a unique burden experienced by White and Mixed Race employees in this category.
Limitations and recommendations
The omission of educational level, tenure and job level as potential predictor variables in this study is regarded as a limitation. Because secondary data from a wellness survey was used it was not possible to include these demographics. Van Schalkwyk and Rothmann (2008) found statistically significant and meaningful differences in SOC mean variance for different qualification and job levels. Application of a universal job level distinction is however problematic in a wide-ranging employee cohort across different industries and companies. Similar studies exploring other combinations of socio-demographic variables as potential predictors of wellness are therefore recommended. Another- interesting research endeavour recommended here entails further exploration of race differences in SOC, particularly in the middle to high income range as well as the reasons underlying the unique wellness experiences of this employee group. Lastly, the relationship between wellness (as operationalised in SOC) and financial health clearly needs further study, as income seems to play a key role in employees' perceived wellness. This study contributes by applying CHAID analysis methodology to the study of SOC and its use for wellness research in the field of industrial and organisational psychology is recommended.
Conclusion: A wellness need algorithm
The results provide a preliminary indication of a potential wellness need amongst different white-collar employees. This constitutes useful information for designating wellness strategies according to the strength of employees' coping resources. White-collar employees presenting with a stronger need for wellness intervention seem to be:
1. Low income (<R10 000) single and especially divorced employees.
2. Low income (<R10 000) sole earners in a marital relationship.
3. Medium range income (R5 001-R15 000) yet sole earner.
4. Medium to high income (R10 000-R20 000) with dependants.
5. Medium to high income (R10 000-R30 000), sole earner with dependants.
6. Medium to high income (R10 000-R30 000), White/Mixed-race single earners.
Acknowledgement
I gratefully acknowledge Summit Financial Partners SA for their interest in furthering salutogenic research in the workplace and for having made the data available for this study. I would also like to acknowledge Ms Helene Muller from the University of South Africa's College of Graduate Studies who assisted with the statistical analysis. Financial support from the National Research Foundation (NRF) also contributed to the finalisation of the study.
Competing interest
I declare that I have no financial or personal relationship(s) that may have inappropriately influenced me in writing this article.
References
Anson, 0., Paran, E., Neumann, L., & Chernickovsky, D. (1993). Gender differences in health perceptions and their predictors. Social Science and Medicine, 36(4), 419-427. http://dx.doi.org/10.1016/0277-9536(93)90404-R [ Links ]
Antonovsky, A. (1987). Unraveling the mystery of health. How people manage stress and stay well. San Francisco: Jossey-Bass. [ Links ]
Antonovsky, A. (1996). The salutogenic model as a theory to guide health promotion. Health Promotion International, 11(1), 11-18. http://dx.doi.org/10.1093/heapro/11.1.11 [ Links ]
Antonovsky, H., & Sagy, S. (1986). The development of a sense of coherence and its impact on responses to stress situations. Journal of Social Psychology, 126(2), 213-225. PMid:3724090 [ Links ]
Austin, K., & Cilliers, F. (2011). The psychometric relationship between career thinking and salutogenic functioning amongst unemployed adults. South African Journal of Industrial Psychology, 37(1), Art. #969, 11 pages. http://dx.doi.org/10.4102/sajip.v37i1.969 [ Links ]
Barnard, H.A., & Muller, H. (2012). The factor structure and reliability of a six-item sense of coherence measure. Journal of Psychology in Africa 2012, 22(4), 639646. [ Links ]
Barnard, H.A., Peters, D., & Muller, H. (2010). Financial health and sense of coherence. South African Journal of Human Resource Management, 8(1), 1-12. [ Links ]
Basinska, M.A., Andruszkiewicz, A., & Grabowska, M. (2011). Nurses' sense of coherence and their work related patterns of behaviour. International Journal of Occupational Medicine and Environmental Health, 24(3), 256-266. http://dx.doi.org/10.2478/S13382-011-0031-1, PMid:21833694 [ Links ]
Bernabé, E., Tsakos, G., Watt, R.G., Suominen-Taipale, A.L., Uutela, A., Vahtera, J. et al. (2009). Structure of the sense of coherence scale in a nationally representative sample. The Finnish Health 2000 survey. Quality of Life Research, 18(5), 629-636. http://dx.doi.org/10.1007/s11136-009-9469-z, PMid:19326255 [ Links ]
Breedt, M., Cilliers, F., & Visser, D. (2006). The factor structure of six salutogenic constructs. South African Journal of Industrial Psychology, 32(1), 74-78. [ Links ]
Eherler, D., & Lehmann, T. (2001, September). Responder profiling with CHAID and dependency analysis. Paper presented at Data Mining for Marketing Applications Workshop, University of Freiburg, Germany. Retrieved on August 30, 2012, from http//www.informatik.uni-freiburg.de/~ml/ecmlpkdd/WS-proceedings/w10/lehmann.pdf [ Links ]
Eriksson, M., & Lindström, B. (2005). Validity of Antonovsky's sense of coherence scale: A systematic review. Journal of Epidemiology and Community Health, 59(6), 460-466. http://dx.doi.org/10.1136/jech.2003.018085, PMid:15911640 [ Links ]
Feldt, T., Leskinen, E., Koskenvuo, M., Suominen, S., Vahtera, J., & Kivimäki, M. (2011). Development of sense of coherence in adulthood: a person-centred approach. The population-based HeSSup cohort study. Quality of Life Research, 20, 69-79. http://dx.doi.org/10.1007/s11136-010-9720-7, PMid:20686925 [ Links ]
Feldt, T., Lintula, H., Suominen, S., Koskenvuo, M., Vahtera, J., & Kivimäki, M. (2007). Structural validity and temporal stability of the 13-item sense of coherence scale: Prospective evidence from the population-based HeSSup study. Quality of Life Research, 16(3), 483-493. http://dx.doi.org/10.1007/s11136-006-9130-z, PMid:17091360 [ Links ]
Giorgi, G. (2009). Workplace bullying risk assessment in 12 Italian organizations. International Journal of Workplace Health Management, 2(1), 34-47. http://dx.doi.org/10.1108/17538350910945992 [ Links ]
Grayson, J.P. (2008). Sense of coherence and academic achievement of domestic and international students: A comparative analysis. Higher Education, 56, 473-492. http://dx.doi.org/10.1007/s10734-007-9106-0 [ Links ]
Gropp, L., Geldenhuys, D., & Visser, D. (2007). Psychological wellness constructs: relationships and group differences. South African Journal of Industrial Psychology,33(3), 24-34. [ Links ]
IBM SPSS Statistics for Windows, Version 21.0 [Computer software] (2012). Armonk, NY: IBM Corporation. [ Links ]
Hakanen, J.J., Feldt, T., & Leskinen, E. (2007). Change and stability in sense of coherence in adulthood: Longitudinal evidence from the Healthy Child study. Journal of Research in Personality, 41(3), 602-617. http://dx.doi.org/10.1016/j.jrp.2006.07.001 [ Links ]
Hochwälder, J., & Forsell, Y. (2011). Is sense of coherence lowered by negative life events? Journal of Happiness Studies, 12, 475-492. http://dx.doi.org/10.1007/s10902-010-9211-0 [ Links ]
Jakobsson, U. (2011). Testing construct validity of the 13-item sense of coherence scale in a sample of older people. The Open Geriatric Medicine Journal, 4, 6-13. http://dx.doi.org/10.2174/1874827901104010006 [ Links ]
Kass, G.V. (1980). An exploratory technique for investigating large quantities of categorical data. Applied Statistics, 29, 119-127. http://dx.doi.org/10.2307/2986296 [ Links ]
Larsson, G., & Kallenberg, K.O. (1996). Sense of coherence, socio-economic conditions and health: Interrelationships in a nation-wide Swedish sample. European Journal of Public Health, 6, 175-180. http://dx.doi.org/10.1093/eurpub/63.175 [ Links ]
Lindström, B., & Eriksson, M. (2005). Salutogenesis. Journal of Epidemiology and Community Health, 59(6), 440-442. http://dx.doi.org/10.1136/jech.2005.034777, PMid:15911636 [ Links ]
Liukkonen, V., Virtanen, P., Vahtera, J., Suominen, S., Sillanmäki, L., & Koskenvuo, M. (2010). Employment trajectories and changes in sense of coherence. European Journal of Public Health, 20(3), 293-298. http://dx.doi.org/10.1093/eurpub/ckp171, PMid:19850701 [ Links ]
Lundberg, O., & Nyström, P.K. (1994). Sense of coherence, social structure and health: Evidence from a population survey in Sweden. European Journal of Public Health, 4, 252-257. http://dx.doi.org/10.1093/eurpub/4.4.252 [ Links ]
Mayer, C. (2011). The meaning of sense of coherence in transcultural management. Münster: Waxmann. [ Links ]
Muller, H., Prinsloo, P., & Du Plessis, A. (2007). Validating the profile of a successful first year accounting student. Meditari Accountancy Research, 15(1), 19-33. http://dx.doi.org/10.1108/10222529200700002 [ Links ]
Naaldenberg, J., Tobi, H., Van den Esker, F., & Vaandrager, L. (2011). Psychometric properties of the OLQ-13 scale to measure sense of coherence in a community-dwelling older population. Health and Quality of Life Outcomes, 9(37), 1-9. [ Links ]
Nilsson, B., Holmgren, L., Stegmayr, B., & Westman, G. (2003). Sense of coherence -stability over time and relation to health, disease and psychosocial changes in a general population: A longitudinal study. Scandinavian Journal of Public Health, 31(4), 297-304. http://dx.doi.org/10.1080/14034940210164920, PMid:15099036 [ Links ]
Oosthuizen, J.D., & Van Lill, B. (2008). Coping with stress in the workplace. South African Journal for Industrial Psychology, 34(1), 64-69. [ Links ]
Rothmann, S., & Ekkerd, J. (2007).The validation of the perceived wellness survey in the South African police service. South African Journal for Industrial Psychology, 33(3), 35-42. [ Links ]
Schnyder, U., Büchi, S., Sensky, T., & Klaghofer, R. (2000). Antonovsky's sense of coherence: Trait or state? Psychotherapy and Psychosomatics, 69(6), 296-302. http://dx.doi.org/10.1159/000012411, PMid:11070441 [ Links ]
Urakawa, K., Yokoyama, K., & Itoh, H. (2012). Sense of coherence is associated with reduced psychological responses to job stressors among Japanese factory workers. BMC Public Health, 5, 9 pages. Retrieved June 03, 2013, from http://www.biomedcentral.com/1756-0500/5/247 [ Links ]
Van der Westhuizen, S., De Beer, M., & Bekwa, N. (2011). Psychological strengths as predictors of students' academic achievement. Journal of Psychology in Africa, 21(3), 473-478. [ Links ]
Van der Westhuizen, S., De Beer, M., & Bekwa, N. (2013). The role of gender and race in sense of coherence and hope orientation results. In M.P. Wissing (Ed.), Well-being research in South Africa, Cross-Cultural Advancements in Positive Psychology, 4, 479-500. http://dx.doi.org/10.1007/978-94-007-6368-5_22 [ Links ]
Van Schalkwyk, L., & Rothmann, S. (2008). Validation of the orientation to life questionnaire (OLQ) in a chemical factory. South African Journal for Industrial Psychology, 34(2), 31-39. [ Links ]
Volanen, S., Lahelma, E., Silventoinen, K., & Suominen, S. (2004). Factors contributing to the sense of coherence among men and women. European Journal of Public Health, 14(3), 322-330. http://dx.doi.org/10.1093/eurpub/143.322 [ Links ]
Wainwright, N.W.J., Surtees, S., Welch, A.A., Luben, R.N., Khaw, K.T., & Bingham, S.A. (2008). Sense of coherence, lifestyle choices and mortality. Journal of Epidemiology and Community Health, 62, 829-831. http://dx.doi.org/10.1136/jech.2007.066464, PMid:18701735 [ Links ]
Wiesmann, U., & Hannich, H. (2012). The contribution of resistance resources and sense of coherence to life satisfaction in older age. Journal of Happiness Studies, 13, 18 pages. [ Links ]
 Correspondence:
Antoni Barnard
PO Box 392
Pretoria 0003, South Africa
Email: barnaha@unisa.ac.za
Received: 22 Sept. 2012
Accepted: 13 Aug. 2013
Published: 22 Oct. 2013

