Serviços Personalizados
Artigo
 Inglês (pdf)
 Artigo em XML
 Referências do artigo
Indicadores

Links relacionados
-
 Citado por Google
 -
 Similares em Google
Compartilhar

 Permalink
SA Journal of Industrial Psychology
versão On-line ISSN 2071-0763
versão impressa ISSN 0258-5200
SA j. ind. Psychol. vol.38 no.1 Johannesburg Jan. 2012
ORIGINAL RESEARCH
Evaluating the MBTI® Form M in a South African context
Casper J.J. van Zyl; Nicola Taylor
Jopie van Rooyen & Partners SA, South Africa
ABSTRACT
ORIENTATION: Psychological instruments require continued refinement, updating and evaluation.
RESEARCH PURPOSE: To investigate the reliability, validity and differential item functioning of the MBTI® Form M across groups in South Africa using Classical Test Theory (CTT) and Item Response Theory (IRT) methods.
MOTIVATION FOR THE STUDY: To add to the continual research and improvement of the MBTI® Form M through the investigation of its psychometric properties across groups in South Africa.
RESEARCH DESIGN, APPROACH AND METHOD: This study falls within the quantitative research paradigm. Classical test theory methods and Rasch analysis were used to evaluate the functioning of the MBTI Form M across gender and ethnic groups. A cross-sectional study was completed consisting of 10 705 South African respondents.
MAIN FINDINGS: Excellent reliability was found for the instrument across groups in the sample. Good evidence for construct validity was found using exploratory factor analysis and confirmatory factor analysis. Some evidence for uniform bias was found across ethnic and gender groups and a few items reflected non-uniform DIF across gender groups only. The effect of uniform and non-uniform DIF did not appear to have major practical implications for the interpretation of the scales.
PRACTICAL/MANAGERIAL IMPLICATIONS: The results provided evidence that supports the psychometric validity of the MBTI instrument in the South African context.
CONTRIBUTION/VALUE-ADD: This study is the largest study to date regarding the psychometric functioning of the MBTI instrument in South Africa. It contributes to the evolution of the instrument in line with the legislative requirements concerning the use of psychometric tests in South Africa.
Introduction
The practice of psychometric testing in South Africa has somewhat unique characteristics when compared to countries with more homogenous population groups. This can be ascribed to particular challenges presented by the South African context. In addition to the requirements that a diverse society demands, psychometric testing is also governed by strict legislation. Combined, these two factors place a large responsibility on test developers and distributors to ensure the appropriateness of psychometric instruments employed in the South African context.
Newer methods and techniques are increasingly being utilised in psychometric test development. These methods also allow for new and improved forms of test validation. The investigation of test functioning in psychological assessments has mostly been completed using methods based on the classical test theory (CTT) tradition. The basic premise of CTT methods is that psychological constructs assume a normal distribution in the population, and that a person's observed score on a test is indicative of their true standing on the construct being measured plus a degree of random measurement error (Kaplan & Saccuzzo, 2009). Methods such as exploratory and confirmatory factor analysis, means difference analysis, correlations and item discrimination analysis have featured in studies investigating test functioning across cultural groups (e.g. Cheung & Rensvold, 2000; Meiring, Van de Vijver, Rothmann & Barrick, 2005).
Advances in the use of item response theory (IRT) methods and Rasch analysis have provided a new approach to examining the functioning of psychological tests across cultures (e.g. De Jong, Steenkamp, Fox & Baumgartner, 2008; Eid & Rauber, 2000). IRT allows for the investigation of item properties separately from the characteristics of the sample, and the investigation of individuals separately from the item properties (Henard, 2000). Rasch analysis enforces strict requirements for measurement, including the requirement that scales should have equal intervals for true measurement to occur (Bond & Fox, 2007). Whilst each method has its relative advantages and disadvantages, it is most likely that a combination of CTT and IRT methods provides a useful way of investigating the presence of bias in psychological assessments (Taylor, 2009). The Rasch model was selected as the method of analysis in the present study because of the strict requirements that it sets for measurement.
The Myers Briggs Type Indicator® (MBTI®)1 instrument is arguably the most well-known personality assessment in the world. It is also widely used in South Africa. Internationally, the MBTI assessment has been extensively researched with regards to its psychometric functioning (Harvey, Murry & Stamoulis, 1995; Myers, McCaulley, Quenck & Hammer, 1998; Schaubhut, Herk & Thompson, 2009). To date, there have been no studies reported in scientific journals on the psychometric properties of the MBTI instrument in South Africa. Previous research was mainly conducted on an ad-hoc basis, on older versions of the assessment, and was not comprehensive in nature (De Beer, 1997; De Bruin, 1996; Taylor & Yiannakis, 2007). In contrast to previous versions, the most recent version of the assessment (Form M) was developed using IRT techniques as opposed to CTT methods employed in all previous versions of the tool.
The dearth of psychometric research published on the MBTI instrument in South Africa provides the motivation for this study. Whilst there have been studies carried out in South Africa using the MBTI instrument as an indicator of type preference (e.g., Du Toit, Coetzee & Visser, 2005; Sieff & Carstens, 2006), they have not specifically focused on the psychometric properties of the tool. This study then aims to fill a gap in the literature by attempting to provide some answers to the question: Is the MBTI Form M sufficiently reliable, valid, and unbiased for use in South Africa?
In line with the development of the MBTI assessment, IRT techniques will be used for the purpose of establishing test validity and to examine the tool for differential item functioning (DIF) across different groups. Together with well-known CTT methods, the overall psychometric functioning of the assessment will be investigated to determine whether it is appropriate for use in the South African context. This was achieved by structuring the research outcomes according to the following research objectives:
- Objective 1: To investigate the reliability of the MBTI (Form M) by computing the Cronbach alpha reliability coefficients for each of the dichotomies on the instrument across gender, ethnic and age groups.
- Objective 2: To investigate the construct validity of the assessment by means of exploratory and confirmatory factor analysis.
- Objective 3: To investigate the construct validity of the assessment by means of IRT using Rasch analysis.
- Objective 4: To examine the items of the MBTI Form M with regard to uniform and non-uniform DIF.
- Objective 5: To investigate the difference in type preference between Black and White respondents.
The remainder of this article is structured into four parts. Firstly, the relevant literature concerning the MBTI instrument is reviewed. Secondly, the research methodology is presented along with a description of the data analysis techniques employed in the study. The results are presented next, followed by a discussion of the findings. This article concludes by considering the limitations of the study and directions for future research.
Review of the literature
Development of the MBTI Instrument
A major advantage of personality assessment is that it provides us with information on how personality constructs manifest differently in people's everyday behaviour. This knowledge is extremely valuable in facilitating improved understanding of ourselves and other people. The personal and organisational benefits that stem from improved and constructive human interactions are numerous. The MBTI assessment is one such measure of normal personality that has gone a long way towards this end. It is an inventory based on Carl Jung's theory of psychological types (Read, Fordham, Adler & McGuire, 1974). Fundamental to the theory is the idea that 'much seemingly random variation in behaviour is actually quite orderly and consistent, being due to basic differences in the way individuals prefer to use their perception and judgement' (Myers et al., 1998, p. 3).
Jung developed his own type theory after he spent many years studying typologies postulated by various writers in history, combined with his own clinical experiences (Read et al., 1974). Type usually refers to the sorting of individuals, based on a certain set of criteria, into one type instead of another. One well-known ancient example illustrates the point. Galen (AD 129 - 199/217) categorised individuals into one of the following four temperaments: phlegmatic (calm), sanguine (optimistic), choleric (irritable) and melancholic (depressed) (Read et al., 1974). According to Myers et al. (1998), Jung believed that the psyche contains dichotomous poles which are in opposition with one another and are mutually exclusive. These opposing poles are the basis of Jung's type theory and comprise of attitudes (Extraversion and Introversion), perceiving functions (Sensation and Intuition) and judging functions (Thinking and Feeling). An individual would thus 'habitually' and 'consciously' have a preference for one pole (type) over another.
Jung considered introverts to be individuals who tend to direct their energy inward whilst extraverts largely channel their energy to the external environment (De Beer, 1997). He further distinguished between individuals whose perceptions are based on direct and actual experience gained from the senses, and individuals who have more indirect perceptions based on a combination of outside information with internal associations and ideas (De Beer, 1997). Lastly, he recognised that some people prefer to use facts and clear analysis when making decisions, whereas others prefer an approach using more human factors to make subjective valuations in their decisions (Read et al., 1974).
Katherine Cook Briggs and her daughter Isabel Briggs Myers developed the MBTI assessment with the aim of applying Jung's type theory by making it understandable and practically useful (Myers et al., 1998). The Myers Briggs Type Indicator® is, as the name suggests, a tool which is used to sort rather than measure. It sorts individuals according to their type preferences on four dichotomous scales, namely:
1. Extraversion-Introversion (E-I)
2. Sensing-Intuition (S-N)
3. Thinking-Feeling (T-F)
4. Judging-Perceiving (J-P).
The Judging-Perceiving attitude scale was included by Briggs and Myers as an operationalisation of the judging and perceiving functions in Jung's theory. The overall objective of the assessment is to determine an individual's preferences on each of the opposites for each dichotomy. Thus, an MBTI type consists of a combination of four letters that create one of up to 16 possible type profiles. It is important to note that the whole type is considered to be greater than the sum of its parts.
The Form M instrument is the most recent version of the MBTI assessment. A major distinction from previous versions is that IRT was used in the development of Form M. IRT is a method used to study the way in which individual items are related to the underlying construct being measured. A fundamental difference between CTT and IRT is that with CTT, analysis takes place at the scale level, but with IRT, the analysis focuses on the individual item (Urbina, 2004). IRT has become an increasingly popular tool with which to develop and evaluate assessments. From the family of IRT models available, the MBTI Form M was developed using a three parameter logistic model (Myers et al., 1998). IRT was therefore used to identify and select items that discriminated best at the midpoint between two preferences (Myers et al., 1998).
Psychometric research
Previous research has shown that in general the reliabilities for the MBTI scales are well-established. The manual reports internal consistency reliability results based on split half correlations ranging between 0.89 and 0.92 and Cronbach alpha coefficients ranging between 0.91 and 0.92 on all four of the dichotomies (Myers et al., 1998). With regard to reliabilities across diverse samples, Schaubhut et al. (2009) reported Cronbach alpha coefficients for different levels of employment status ranging between 0.87 and 0.92; across different ethnic groups they ranged between 0.83 and 0.92; for different age groups they ranged between 0.86 and 0.92; and across different international regions the range was between 0.81 and 0.91. In South Africa, research by Taylor and Yiannakis (2007) reported Cronbach alpha coefficients ranging between 0.85 and 0.91 on Form M. It is however important to determine whether the instrument is equally reliable across diverse samples of the population - such as gender, age and ethnic groups - to ensure that it can be reliably used in these groups.
Factor analysis is an appropriate method of establishing structural validity evidence for an assessment. Many factor analytic studies have been carried out to examine the extent to which results match the hypothesised structure of the MBTI assessment. Based on MBTI theory, one would expect four factors to emerge from a factor analysis. Using exploratory factor analysis with Form G (the previous version of the MBTI instrument), several studies have reported results that were almost identical to the hypothesised four factor structure (e.g. Harvey et al., 1995; Thompson & Borrello, 1986; Tischler, 1994; Tzeng, Outcalt, Boyer, Ware & Landis, 1984). However, other studies were not as successful with regard to their factor analytic findings. Comrey (1983), Sipps, Alexander and Friedt (1985), and Saggino and Kline (1995) all reported factor structures other than the predicted factor structure in their research. Myers et al. (1998) criticised some of these studies with regard to how factors were retained, rotations that were used, and the number of participants in the study relative to the amount of items on the assessment. In South Africa, De Bruin (1996) investigated the structural validity of the MBTI Form G using an exploratory factor analysis, and found that a four factor structure emerged that corresponded to the theoretical model. A total of 75% of the items had salient loadings on their expected factors, and low correlations were found between the factors (De Bruin, 1996).
In addition to exploratory factor analysis, a number of confirmatory factor analysis studies have been conducted on the MBTI Form G. According to James, Mulaik and Brett (1982) confirmatory factor analysis provides a more robust test of a theoretical factor structure compared to exploratory factor analysis (Myers et al., 1998). Several such studies have found support for the hypothesised structure of the assessment using this technique (Johnson & Saunders, 1990; Thompson & Borrello, 1989). However, according to Myers et al. (1998), the most effective way in which to use the confirmatory approach, is to evaluate and compare competing structural models. In line with this, Harvey et al. (1995) compared the theoretical four factor structure with the 5 and 6 factor structures reported respectively by Comrey (1983) and Sipps et al. (1985) using exploratory factor analysis. Results from the confirmatory analyses found strong support for the hypothesised four factor model. In addition, confirmatory analysis was also conducted on Form M, which again found strong evidence for the four factor structure of the assessment (Myers et al., 1998). The above research demonstrated that a four factor model provides the best fit and points to the hypothesised model developed by Isabel Briggs Myers as being most appropriate when compared to competing models (Schaubhut et al., 2009). With the factor structure established by confirmatory factor analysis in the United States, it is appropriate to also examine the factor structure of the MBTI Form M in the South African context.
Type tables are a useful way of presenting the proportion of each type within a particular group. In South Africa, type distribution research on Form G found ESTJ (Extravesion-Sensing-Thinking-Judging [23.2%]), followed by ISTJ (Introversion-Sensing-Thinking-Judging [19.9%]) to be the modal type preferences in South Africa, with ISFP (Introversion-Sensing-Feeling-Perceiving [1.72%]) being the least common occurring type preference (De Beer, 1997).
On Form M, Taylor and Yiannakis (2007) reported similar findings with regard to ESTJ (Extraversion-Sensing-Thinking-Judging [20.8%]) and ISTJ (Introversion-Sensing-Thinking-Judging [19.8%]), but they found INFJ (Introversion-Intuition-Feeling-Judging [1.7%]) to be the least occurring type preference. In South Africa, slight differences in type distribution between Black and White respondents have previously been reported (e.g. De Beer, 1997). However, it is important to examine an instrument for the presence of bias before such type distribution differences can be considered meaningful.
The MBTI instrument was developed in the United States, but has been used in South Africa for many years. The assessment is used across a multitude of cultures that are not necessarily similar to the population for which the tool was originally designed. Complex and diverse societies such as South Africa highlighted the need for equivalence when using assessments (Van de Vijver & Rothmann, 2004). According to Marais, Mostert and Rothmann (2009, p. 175) 'psychological theory would be confined to its own cultural boundaries' without cross cultural comparisons. For this reason it is important that the measurement equivalence of the MBTI scales be researched to determine if the items of the inventory are perceived in the same way and have the same meaning for different groups of people. One aspect of measurement equivalence is the presence of item bias, which is investigated using uniform and non-uniform DIF analyses in the present study.
The review of the literature revealed a need to ensure that recent and more comprehensive research is published on the psychometric properties of the MBTI instrument in South Africa. The purpose of this study is therefore to determine whether the MBTI assessment is appropriate for use in the South African context. This was achieved by examining the psychometric properties of Form M, the most recent version of the tool. To achieve this outcome, both CTT and IRT techniques were used to achieve the specific research objectives set out for this study.
Research design
Research approach
The present study falls within the quantitative research paradigm. A cross-sectional survey design was used. Secondary data was used in this study.
Research method
Research participants
The respondents of this sample comprised 10 705 South Africans (5909 men, 4651 women) who completed the MBTI
Form M between 2004 and 2010. From the overall sample, 9806 respondents indicated their age, which ranged between 14 years and 74 years. The average age of the men was 36.74 years (SD = 11.42) and the average age for women was 34.04 years (SD = 10.35).
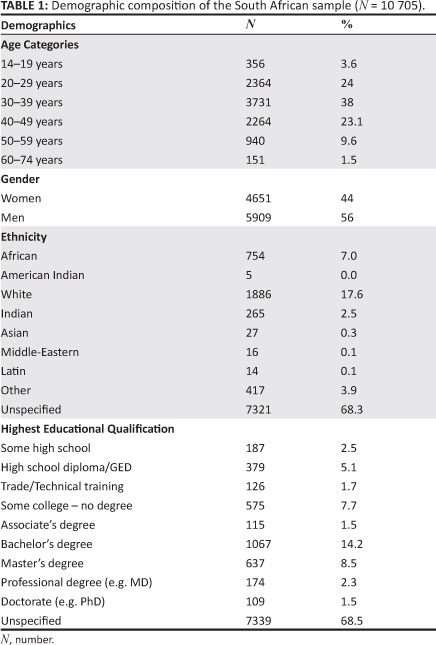
In this study, gender, ethnicity and age categories were used as comparison groups. Only Black and White respondents were compared as the other ethnic groups were too small to be included in the analysis. A total of 2967 respondents indicated their ethnic origin. Of those that reported their ethnicity, 63.6% were White and 36.4% were Black. With regard to gender, 56% were men and 44% were women. These age categories allowed for comparison with international research. Table 1 provides a breakdown of the age, gender, ethnic and educational composition of the sample.
Measuring instruments
The measurement tool employed in this study was the MBTI Form M (Myers et al., 1998). This instrument is a well-known assessment of normal personality. It is a tool that measures and classifies individuals into psychological types based on the theory postulated by Jung (Read et al., 1974). An individual's preferences are measured by means of 93 items on four dichotomies namely, (1) Extraversion-Introversion, (2) Sensing-Intuition, (3) Thinking-Feeling and (4) Judging-Perceiving. Responses to the items on the assessment will categorise an individual into either one of the type preferences on all four of the dichotomies. Thus, an individual will be categorised into one of sixteen possible types on the instrument (e.g. ESTJ).
Statistical analysis
Reliability analysis: The internal consistency reliabilities for each of the four MBTI scales were estimated using Cronbach's coefficient alpha (Cronbach, 1951). In addition to the total sample, the procedure was repeated for various comparison groups to ensure that the assessment is reliable for use across diverse subgroups in the South African population. Thus, reliabilities were computed for Black and White respondents as well as for men and women. With regard to age, the sample was divided into the same categories as those reported in the manual (Myers et al., 1998). This allowed for comparison with international results. Only Cronbach alpha reliabilities were estimated, as Form G analyses demonstrated that the difference between split-half and coefficient alpha methods were negligible (Myers et al., 1998).
Exploratory factor analysis: With the aim of establishing construct validity of the MBTI scales in a South African context, an item-based principal factor analysis was conducted. The four factors extracted were based on the theoretical expectations proposed by the type model. The factors were obliquely rotated by means of the Direct Oblimin criterion.
Confirmatory factor analysis: Following the EFA, the four factor theoretical model was subjected to a confirmatory factor analysis. Maximum likelihood (ML) estimation was used for the analysis. This method does however assume multivariate normality (Kline, 2005), which is often violated in applied social science research (Garson, 2006). Using ML estimation techniques in such cases is problematic because the chi-square fit statistic for the model is then biased toward Type 1 error (Kline, 2005). To account for this possibility, a robust ML estimation technique was specified in the present study. Furthermore, the data analysed in EQS is categorical, which makes it essential that the interpretation of model fit must be based on robust statistical output (Byrne, 2006).
Rasch analysis: Item response theory is a method used to determine how item responses are related to the underlying construct (i.e. ability or personality) within an individual, which we assume produced the obtained responses on a given assessment (Myers et al., 1998). Many IRT models are available, and the choice of which one to use is often determined by the researcher (depending on the objective of the particular project or study). The Rasch model (Rasch, 1960) is known as a fundamental measurement model, and is based on the assumption that the probability of achieving higher scores on a test increases as individuals possess more of a latent trait, and decreases as they possess less of the trait, an indication that items become more difficult to endorse (Green & Frantom, 2002). In other words, the probability of endorsing an item on a test is a function of the difficulty of the item and the ability of the person. For dichotomous items, the Rasch model indicates the probability of endorsing one response option over the other, relative to the individual's level of ability and the difficulty of the item. In terms of MBTI scores, ability is defined by how clearly a person reports their preference for a type (in other words, how consistently a person chooses one preference over another).
The Rasch model is a method of logistic probability modelling that estimates item locations independent of the sample characteristics, allowing the researcher to make inferences about the test regardless of the distribution of the sample (Bond & Fox, 2007). The unit of measurement in Rasch analysis is the logit (or log-odds unit), and is the same for item location parameters as it is for person location parameters. The item and person parameters were estimated with the Winsteps Version 3.70.1. software package (Linacre, 2010). The mean logit score is set at 0, with higher scores indicating greater difficulty and greater ability, and negative scores indicating lesser difficulty and lesser ability (Bond & Fox, 2007). In the case of the MBTI scores, there is no underlying trait as such, so person ability is an indication of how clearly the person indicated their preference for a particular type.
In the Rasch model, the data is required to fit the model. This is a function that sets Rasch modelling apart from other IRT models. Fit to the model is determined by examining the infit mean square statistic. Infit mean square values reveal the difference between the observed scores and the expected scores calculated by the model. The expected infit mean square has a value of one, which means that items that fit the model will have infit mean square values closer to one. According to Wright and Linacre, (1994) items with infit values above 1.40 and below 0.75 should be excluded from analyses. However, Adams and Khoo (1996) recommended using more stringent infit values ranging between 0.75 and 1.33 and these values were used in the present study.
Misfit occurs when items do not behave according to the stringent requirements set by the model. Thus, items that demonstrate poor fit are classified as items that either underfit or overfit the model, depending on the relevant statistical value. Underfit (INFIT > 1.33) indicates that the specific item behaves in an unpredictable way and may be measuring something else. Overfit (INFIT < 0.75) means that the item is too predictable and may be considered superfluous.
The reliability with which the person abilities were calculated is expressed as a person separation reliability index. This measure is similar to Cronbach's alpha coefficient with regard to interpretation (De Bruin & Taylor, 2006). It is also an indicator of how reliably the person parameters were estimated and the likelihood that similar results would be obtained with another sample.
Uniform and non-uniform DIF using Rasch: An important feature of the Rasch model is that the estimated item location parameters should be invariant across demographic groups with different levels of ability. Accordingly, if an item has different location parameters, the item is said to reflect DIF. A DIF-contrast value larger than 0.5 logits was considered to be reflective of DIF according to the recommendation by Lai, Teresi and Gershon (2005). However, for DIF to be practically significant, DIF values have to be large and mostly in one direction (Linacre, 2010).
Given that Rasch is a one-parameter logistic model, which requires parallel slopes, the DIF contrasts obtained in the model is a reflection of uniform-DIF. In order to examine non-uniform DIF - whilst retaining the strict requirements for measurement provided in the Rasch model - analysis of variance (ANOVA) of residuals across the latent construct and ethnicity were examined in a single analysis (Hagquist & Andrich, 2004). Based on the response of each person to each item, the standardised residual is calculated as shown in Equation 1.

Where Z . is the standardised residual of the observed score for person n on item i, Xni is the observed score, E[Xni] the expected score and V[Xni] denotes item variance. Each person is then divided into one of five possible class-interval levels according to ethnicity. The class-intervals were obtained by dividing the person measures into five equal percentile ranges. In this analysis, a significant interaction between class-interval and ethnicity would be indicative of non-uniform DIF (Hagquist & Andrich, 2004). Uniform and non-uniform DIF was investigated for each of the MBTI scales across ethnic and gender groups.
Cross tabulation: Cross tabulation is a method where a variety of tests and measures are used to test the associations on a set of two way tables (Field, 2005). Cross tabulations were computed to investigate differences with regard to the frequency of type preferences between Black and White respondents for each of the dichotomies on the assessment. In this study, the chi-square statistic was used as an indicator of statistical significance.
Results
Reliability analysis
In addition to investigating the overall reliability of the MBTI Form M in a broad South African context, it is also necessary to examine its reliability across various subgroups, to ensure that the instrument is indeed reliable for use with diverse groups in the general population. Towards that end, reliability coefficients were calculated for subgroups based on ethnicity, gender and age categories. The Cronbach alpha internal consistency reliability coefficients for each of these groups and the total sample are reported in Table 2. Very good reliabilities were found with alpha coefficients ranging between 0.88 and 0.92 for the total South African sample.
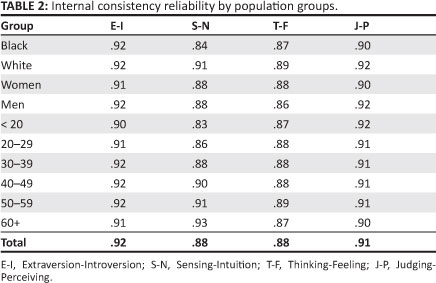
Similarly satisfactory reliabilities between the diverse subgroups in the total population, would demonstrate that the instrument is reliable for use across a broad range of possible samples in the South African context. Inspection of the results in Table 2 reveals Cronbach alpha internal consistency coefficients for Black and White respondents ranging between 0.84 and 0.92. The number of respondents from other ethnic groups in the sample was not large enough to merit inclusion for this analysis. A slightly lower reliability coefficient was found on the S-N scale for Black respondents compared to the total population, however it can still be described as good (α = 0.84).
Internal consistency reliability coefficients for men and women ranged between 0.86 and 0.92 and are very similar across both groups. Furthermore, these results are similar to those found for the ethnic groups as well as the general population. Reliability coefficients were also calculated for the different age groups on each of the dichotomies. Inspection of Table 2 reveals remarkable stability across the age groups on all of the dichotomies. The most variability was identified on the S-N scale with reliability coefficients ranging between 0.83 and 0.93. The internal consistency reliability increased with age, suggesting that individuals respond more consistently to items in the S-N scale as they become older. Overall, these results demonstrate that the MBTI Form M can be used reliably across a variety of ethnic, gender, and age groups in South Africa.
Exploratory factor analysis
The 93 items of the MBTI Form M were subjected to a principal factor analysis. Four factors were successfully extracted and rotated to an oblique simple structure by means of the Direct Oblimin criterion. The four factors that emerged closely match the theoretical structure proposed by the Myers et al. (1998). The full pattern matrix is displayed in Table 3. Only pattern loadings greater than 0.3 were regarded as salient.

All of the items assigned to the Extraversion-Introversion (21 items), Thinking-Feeling (24 items) and Judging-Perceiving (22 items) scales had primary salient loadings on their posited factors. All three scales therefore had a 100% loading rate. None of the items had secondary loadings greater than 0.3 on any other factor.
The Sensing-Intuition factor was defined by 24 of the 26 items on the scale. Items SN1 and SN2 failed to load as expected on the S-N structure. Thus, 92% of the items allocated to the S-N scale loaded on its expected factor. None of the items in this scale, including the two items that failed to load, had salient secondary loadings above 0.3 on another factor. Overall, the items of the MBTI Form M had a 98% loading rate.
Confirmatory factor analysis
Encouraged by the results obtained in the EFA, the hypothesised four factor model was further subjected to a confirmatory factor analysis. A four factor model was specified for the analysis, based on the research completed in the United States by Harvey et al. (1995) and Myers et al. (1998) that showed that a four factor model for the MBTI instrument had superior fit when compared to alternative factor models.
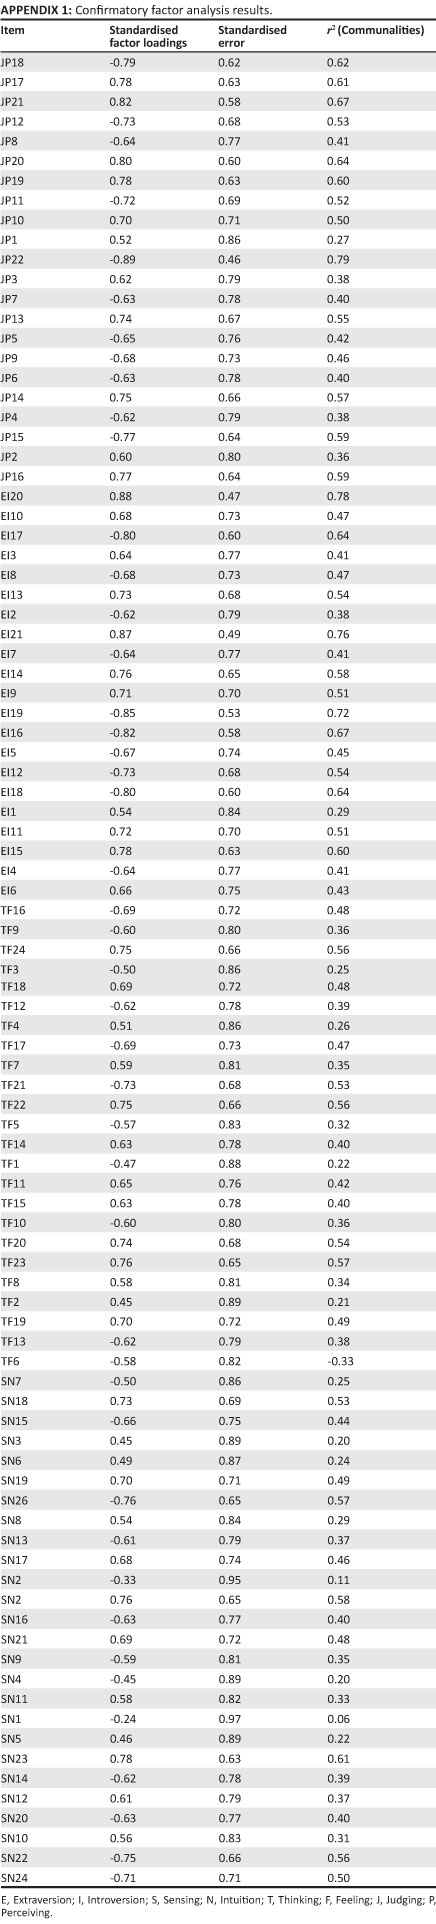
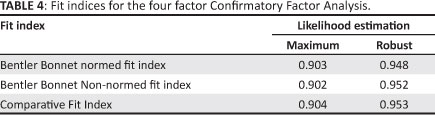
Results revealed that this model appears to be tenable and seems to support the four factor theoretical structure of the MBTI instrument. For comparison purposes, both the ML and Robust ML fit indices generated by EQS for categorical data are reported in Table 4. It appears that RMSEA fit indices and confidence intervals cannot be calculated when using the robust ML estimations for categorical data. Overall, the robust analysis seems to suggest that the specified four factor model seems to fit the data relatively well, and to justify the inspection of model parameters. The standardised factor loadings, standardised error and r2 values for each item are reported in Appendix 1.
Item response theory analysis
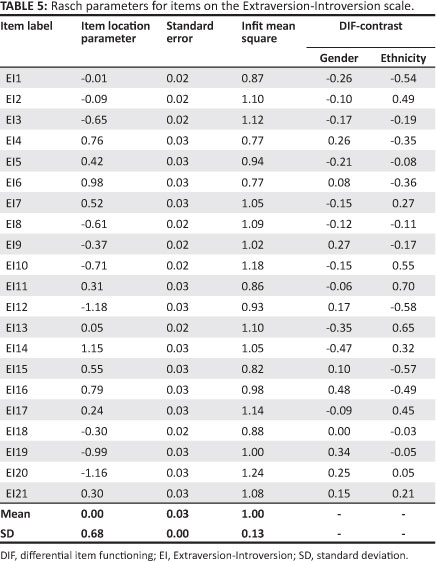
The psychometric properties of the four dichotomies were further investigated by subjecting the items of each dichotomy to Rasch analysis. This method also allows for the examination of DIF for men and women as well as for Black and White respondents. These findings are reported in the next section. Firstly, the extent to which the items of each dichotomy fit the requirements set by the Rasch scale model was examined. The results in Table 5 show that the mean of the infit mean squares for the Extraversion-Introversion scale was 1.00 (SD = 0.13). This is equal to the expected value and indicates overall satisfactory fit. The infit mean square values of the individual items ranged between 0.77 for item EI21 and 1.24 for item EI1. No INFIT values of < 0.75 and > 1.33 were found, which means that all the items on the Extraversion-Introversion scale demonstrated satisfactory fit. The person separation reliability was 0.84, which can also be described as satisfactory. The item location parameters ranged between -1.18 and 1.15 logits. Table 4 also presents the DIF-contrast values for gender and ethnicity groups.
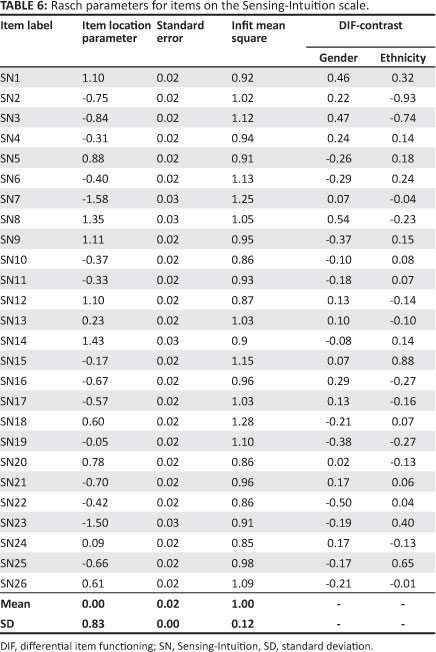
The results in Table 6 show that the mean of the infit mean squares on the Sensation-Intuition scale was 1.00 (SD = 0.12), which is equal to the expected value, indicating overall scale fit that is satisfactory. The infit mean squares for all the individual items ranged between 0.85 for item SN26 and 1.28 for item SN2. All items had infit mean square values that fall well into the suggested range. This indicates that all of the items on the Sensing-Intuition scale demonstrated satisfactory fit. The person separation reliability was 0.84, which can also be described as satisfactory. The item location parameters ranged between -1.58 and 1.35 logits. Table 6 also presents the DIF-contrast values for gender and ethnicity groups.
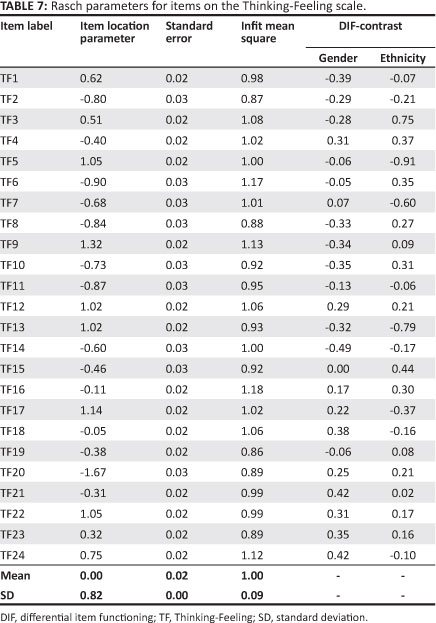
The results in Table 7 indicate that the mean of the infit mean squares for the Thinking-Feeling scale is 1.00 (SD = 0.09). The expected value is also one, which indicates satisfactory overall fit in the scale. The individual items had infit mean square values ranging between 0.86 for item TF24 and 1.18 for item TF2. This means that no misfit was identified, indicating that all of the items on the Thinking-Feeling scale demonstrated satisfactory fit. The person separation reliability was 0.84, which is satisfactory. The item location parameters ranged between -1.67 and 1.32 logits. Table 7 also presents the DIF-contrast values for gender and ethnicity groups.
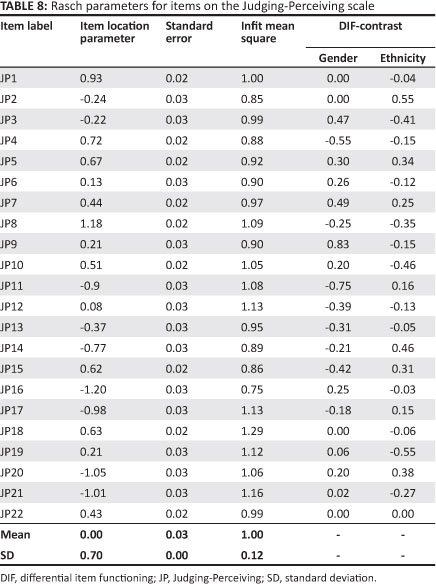
The item location parameters and infit mean-square values for each of the items on the Judging-Perceiving scale are reported in Table 8. The mean of the infit mean squares was 1.00 (SD = 0.12), which is equal to the expected value and demonstrates good overall fit. The values of the infit mean square statistics ranged between 0.75 for item JP22 and 1.29 for item JP1. This indicates that no misfit could be identified for any of the items on the scale. Person separation reliability for the Judging-Perceiving scale was 0.83 and can be described as satisfactory. The item location parameters ranged between -1.20 and 1.18 logits. Table 8 also presents the DIF-contrast values for gender and ethnicity groups.
Differential item functioning: Uniform differential item functioning (DIF)
Assuming that the items discriminate equally well at the midpoint between gender and ethnic groups, uniform DIF was investigated by comparing the item location parameters for men and women as well as for Black and White respondents on each of the four dichotomies. On the Extraversion-Introversion scale, none of the item location parameters differed by more than 0.5 logits between men and women. Thus, uniform DIF could not be identified for any of the items on the E-I scale related to gender. The correlation between item locations for men and women on the E-I scale was 0.94, indicating that items that were more difficult for men were also more difficult for women to endorse.
With regard to Black and White respondents, 6 of the 21 items in the scale could be flagged as reflecting uniform DIF.
These were items EI1, EI10, EI11, EI12, EI13 and EI15. For items EI10, EI11 and EI13, the Black respondents found it easier to endorse the Extraversion option, whereas the White respondents found it easier to endorse to the Extraversion option on items EI1, EI12 and EI15. The correlation between item locations for Black and White respondents on the E-I scale was 0.88, indicating that items that were more difficult for Black respondents were also more difficult for White respondents to endorse.
Two items from the 26 Sensing-Intuition items were identified as possibly reflecting uniform DIF for the gender groups. These were items SN8 and SN22. Women found it relatively easier to endorse the Sensing option on item SN8 whereas men found it relatively easier to endorse the Sensing option on item SN22. The correlation between item locations for men and women on the S-N scale was 0.95, indicating that items that were more difficult for men were also more difficult for women to endorse.
With regard to ethnicity on the Sensing-Intuition scale, four of the items were identified as reflecting uniform DIF. These were items SN2, SN3, SN15, and SN25. The White respondents found it relatively easier to endorse the Sensing option on items SN2 and SN3, whilst Black respondents found it relatively easier to endorse the Sensing option on items SN15 and SN25. The correlation between item locations for Black and White respondents on the S-N scale was 0.92, indicating that items that were more difficult for Black respondents were also more difficult for White respondents to endorse.
With regard to gender on the Thinking-Feeling scale, no items were identified as reflecting uniform DIF. This demonstrates that there is no evidence of uniform DIF for any of the items on the T-F scale pertaining to men and women. The correlation between item locations for men and women on the T-F scale was 0.94, indicating that items that were more difficult for men were also more difficult for women to endorse.
Examining item locations across ethnicity highlighted four of the 24 items on the T-F scale as reflecting uniform DIF. These were items TF3, TF5, TF7, and item TF13. Black respondents found it relatively more difficult to endorse the Feeling option on item TF3 and White respondents found it relatively more difficult to endorse the Feeling option on items TF5, TF7 and TF13. The correlation between item locations for Black and White respondents on the T-F scale was 0.89, indicating that items that were more difficult for Black respondents were also more difficult for White respondents to endorse.
With regard to gender differences on the Judging-Perceiving scale, 3 of the 22 items could be flagged as reflecting uniform DIF. These were items JP4 and JP11, where men found it more difficult to endorse the Perceiving option and item JP9 where women found it more difficult to endorse the Perceiving option. The correlation between item locations for men and women on the J-P scale was 0.88, indicating that items that were more difficult for men were also more difficult for women to endorse.
For Black and White respondents on the Judging-Perceiving scale, two items were identified that reflected uniform DIF. These were items JP2 where Black respondents found it more difficult to endorse the Perceiving option and item JP19 where White respondents found it more difficult to endorse the Perceiving option. The correlation between item locations for Black and White respondents on the J-P scale was 0.92, indicating that items that were more difficult for Black respondents were also more difficult for White respondents to endorse.
Non-uniform differential item functioning (DIF)
To protect against Type 1 error in this analysis, a Bonferroni correction was applied to a significance level of 0.05. In this analysis, three probabilities were computed for each item, namely, (1) the demographic variable, (2) the class interval and (3) class interval ÷ demographic variable. The Bonferroni criterion applied was calculated following the recommendations by Hagquist and Andrich (2004). Given the 21 items of the EI scale, the criterion level was taken as 0.05/63 = 0.00079. The same procedure was applied to the JP, SN, and TF scales.
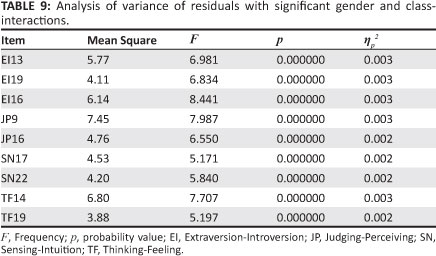
Table 9 shows the analysis of variance of residuals for those items reflecting non-uniform gender-DIF. Three items from the EI scale and two items each from the JP, SN, and TF scales had statistically significant interactions between class-interval and gender. Table 9 also provides partial eta squared effect sizes for these results, which can be described as small (Cohen, 1988). There were no significant interactions between class-interval and ethnicity on any of the four MBTI scales.
Type distribution
Type distribution was investigated for Black and White respondents as it was determined that there was little evidence that item bias is likely to adversely impact scores on the overall scales. Different type distributions between Black and White respondents reflect actual differences regarding their type preferences. Table 10 provides descriptive information for the 16 type preferences of the overall population group. It shows the number of cases for each possible type combination and the percentage that this represents in the total population. Inspection of the table reveals that the most common type preference was ESTJ (22.2%), closely followed by ISTJ (18.6%). The least common type preference for the total South African sample was INFJ (1.5%). This corresponds with previous research, which also found ESTJ and ISTJ to be the modal type preferences in South Africa, however ISFP (1.72%) was found to be the least occurring type preference (De Beer, 1997).
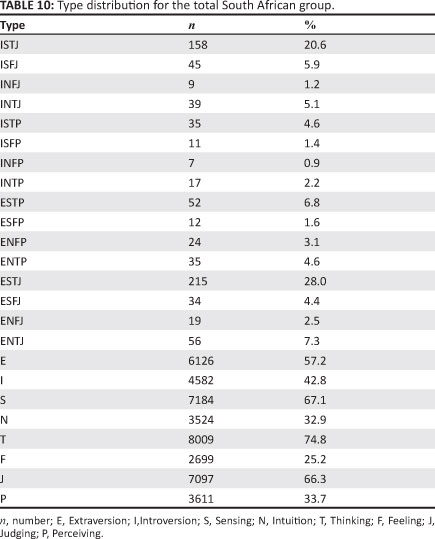
Table 11 reports the type distribution for Black respondents in the sample. In the Black group the most commonly preferred type was ESTJ (28%), followed by ISTJ (20.6%). However, the difference between them is more pronounced than in the general population. De Beer (1997) also found a larger discrepancy between ESTJ (38.17%) and ISTJ (29.35%) in the Black group. In this study INFP (0.9%) was the least commonly preferred type, but De Beer (1997) reported ESFP (0.22%) to be the least preferred type for Black South Africans (De Beer, 1997).
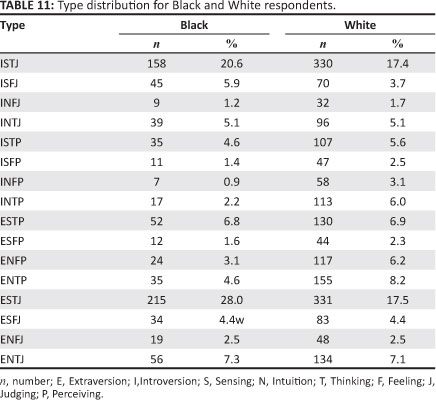
Table 11 also reports the type distribution for White respondents in the sample. For White South Africans the most commonly preferred types were almost equally divided between ESTJ (17.5%) and ISTJ (17.4%). This corresponds to findings by De Beer (1997), with ESTJ (20.54%) also being the most frequently occurring type followed closely by ISTJ (18.04%) for White South Africans. In both cases, the difference is smaller in the White groups than in the Black groups. For the White group, the least frequently occurring type preference reported by De Beer (1997) was ISFP (1.96%), whereas in the current study it was found to be INFJ (1.70%).
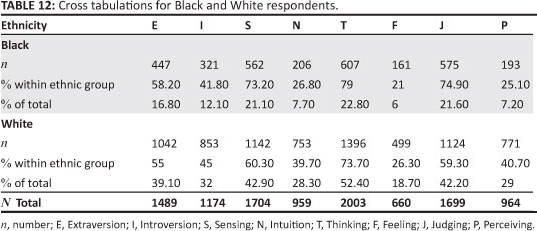
Type distribution tables for Black and White respondents in this study and previous research seem to suggest that more Black respondents have a preference for Extraversion, Sensing, Thinking and Judging than White respondents (De Beer, 1997). To further investigate this possibility, cross tabulations were computed on each dichotomy between Black and White respondents. Statistically significant differences in the frequency of type distribution between the Black and White respondents were found for the S-N (÷2(1) = 39.548, p < 0.01), T-F (÷2(1) = 8.451, p < 0.01) and J-P (÷2(1) = 57.261, p < 0.01) preferences. These results are provided in Table 12. The results shown in the table indicate that more Black respondents have a preference for Sensing, Thinking and Judging compared to White respondents. Important to note is that Sensing, Thinking and Judging are still the preferred type for White respondents although the difference is just more pronounced for Black respondents. The differences between Black and White respondents on the Extraversion-Introversion (÷2(1) = 2.293,p > 0.05) scale were not significant.
Discussion
The objective of the present study was to contribute to the international research on the MBTI Form M by investigating the functioning of the instrument in the South African context. The data allowed for a thorough examination of its psychometric properties across diverse groups in the sample by means of CTT and IRT. In line with South African legislation, the use of IRT also demonstrated that the instrument does not appear to discriminate unfairly across gender or ethnic groups.
Summary of the research results
Reliability analyses confirmed that the instrument can be reliably used in South Africa with a variety of different subgroups in the population. Slightly lower reliabilities were found only on the S-N scale for Black respondents and for respondents younger than 20 years; however they can still be described as highly satisfactory. With regard to age groups on the S-N scale, reliabilities increased systematically from youngest to oldest, suggesting that individuals respond more consistently to items on this scale as they become older. This pattern was not found on any of the other dichotomies. It would be inadvisable to over-interpret this finding, as the differences were slight, and reliabilities excellent for all age groups on the S-N scale. Overall, the South African reliabilities are in line with international results obtained in North America, Australia, Asia, the Middle East, Europe and Latin America (Schaubhut et al., 2009).
The results of the exploratory factor analysis provided strong evidence for the theoretical structure of the MBTI scales. A four-factor structure was found, which is in line with previous factor analytic findings reported in South Africa (De Bruin, 1996). All except two items loaded saliently on their posited factors, and none of the items had secondary loadings on any factor. On the E-I scale, De Bruin (1996) reported that 90% of the items loaded as expected on Form G Self Scorable, however 100% of the items loaded according to the scoring key on Form M. The two items that failed to load as expected were located on the S-N scale, but the scale still improved from a 65% loading rate on Form G to 98% on Form M. Furthermore, salient factor loadings on the T-F scale improved from 73% on Form G to 100% on Form M, and on the J-P scale the previous 75% successful loading rate also improved to 100% on Form M.
In line with the findings obtained by Harvey et al. (1995), the CFA results obtained in this study further supported the four factor theoretical structure of the MBTI instrument in South Africa. The robust statistics indicated that the four factor model provided a reasonable fit to the data. The four factor model previously provided superior fit when compared to alternative models (Harvey et al., 1995), and the fact that the EFA results seemed to provide strong support for this model, there appeared to be no rationale to test for alternative CFA models.
The vast improvement from Form G to Form M can likely be attributed to the use of IRT in the development of the assessment. The implications thereof is that this method ensured the selection of items that provided better information about the respondents' preferences, as the accuracy of preference identification was improved. The almost pure factor structure that emerged in this study corresponded closely with the hypothesised structure as well as other studies reporting four factor models (Harvey et al., 2005; Thompson & Borrello, 1986; Tischler, 1994; Tzeng et al., 1984).
From the Rasch analysis it was possible to confirm that for each of the four scales a single line of enquiry runs through the items, making it appropriate to combine items into a single scale. None of the items appeared to measure something different to the other items in the scale, nor were any redundant items identified. Along with the factor analytic results, this provides further evidence that the items on each of the dichotomies indeed measure similar constructs.
IRT was also utilised to evaluate the functioning of the assessment with regard to DIF. Overall, the results from the uniform DIF analyses revealed that there were items on each of the four scales to which men and women, as well as the Black and White groups responded consistently differently. When considering the total number of items displaying uniform DIF in the MBTI assessment (total of 93 items), 5 items showed signs of uniform DIF for gender and 16 items for ethnicity. The items identified for the gender and ethnic groups did not overlap. Importantly, there was no pattern observable with regard to the direction of the DIF, in the sense that the relevant items were in some cases easier and in other cases more difficult to endorse for all groups in the analyses.
According to Linacre (2010), if the uniform DIF obtained in Rasch is not mostly in one direction, the impact on measurement is generally small. The uniform DIF identified in this study is unlikely to be of practical significance because no particular direction could be identified in any of the groups. In other words, the presence of uniform DIF in the current is unlikely to translate to test bias, as the items displaying DIF in either direction are likely to cancel each other out. Correlations between the item locations for men and women and Black and White respondents respectively ranged from 0.88 to 0.95, indicating that items men found easy to endorse were also easy to endorse for women, and items that Black respondents found easy to endorse were also easy to endorse for White respondents.
With regard to non-uniform DIF, results revealed that there were no significant interactions between class-interval and ethnicity. Thus, no evidence for non-uniform DIF related to ethnic differences could be found for any items on the MBTI scales. Some evidence for non-uniform DIF across the gender groups was found. Three items on the EI scale and two items each on the JP, SN and TF scales reflected non-uniform DIF. However, inspection of the effect sizes revealed that these differences appeared to be of little practical value.
Thus, the MBTI assessment does not appear to display consistent bias against any one group in terms of gender or ethnicity, although evidence for differential responding at an item level was found. The assessment could further be improved by removing or rewriting items that may be functioning somewhat differently across the relevant demographic groups. An additional investigation into the specific content of the items to identify the source of differential responding across groups should also be conducted.
Type distributions of the MBTI Form M were investigated for the South African population. ESTJ was the most commonly occurring type preference followed by ISTJ. This is in line with previous findings regarding type distributions in South Africa (De Beer, 1997; Taylor & Yiannakis, 2007). In this study, type distributions were also determined for Black and White respondents separately, which revealed that more Black respondents have a preference for ESTJ compared to White respondents. The distribution between ESTJ and ISTJ for the White group was almost equal. Cross tabulations revealed that there was a statistically significant difference in the frequency of type distributions between Black and White respondents on the Sensing-Intuition, Thinking-Feeling and Judging-Perceiving scales.
Limitations of the study
Limitations of the study include the fact that secondary data was used based on a sample of convenience. However, most of the individuals who have completed the MBTI Form M were represented in the study. Despite having a large sample, demographic information was only available for smaller portions of the total sample as many respondents chose not to indicate their ethnic or gender group. Another limitation is that the White group made up the majority of respondents in the sample compared to Black respondents and that most of the other minority groups in the population were not represented in this study, the reason being the limited amount of available demographic data. Future studies regarding the psychometric properties of the MBTI instrument should be more representative of the South African population with regard to minority groups other than the Black and White groups.
Conclusion
In summary, the results of this study are in line with international research regarding the functioning of the MBTI Form M. South African reliabilities closely resemble those of international studies, and the factor structure obtained in this study matches the factor analytic findings in the majority of other studies. Overall, the South African results are comparable to international findings regarding basic psychometric properties. The identified uniform and non-uniform DIF does not appear to be overly problematic. However, it will be important to replicate these findings in future studies related to bias in assessment. The results of this study will also inform future adaptations of the MBTI instrument in South Africa.
Acknowledgement
Competing interests
Both authors are employees of Jopie van Rooyen & Partners SA, which holds the license for distributing the MBTI® instrument in South Africa.
Authors' contributions
C.v.Z. (Jopie van Rooyen & Partners SA) was the project leader, conducted the analyses, and was involved in preparing the manuscript. N.T. (Jopie van Rooyen & Partners SA) contributed to the design of the study and was involved in preparing the manuscript.
References
Adams, R.J., & Khoo, S.T. (1996). Quest: The interactive test analysis system version 2. Campbell, Australia: ACER. [ Links ]
Bond, T.G., & Fox, C.M. (2007). Applying the Rasch model. (2nd edn.). Mahwah, N.J.: Lawrence Erlbaum Associates. [ Links ]
Byrne, B.M. (2006). Structural Equation Modelling with EQS. (2nd edn.). Mahwah, N.J.: Lawrence Erlbaum Associates. [ Links ]
Cheung, G., & Rensvold, R. (2000). Assessing extreme and acquiescence response sets in cross-cultural research using structural equation modeling. Journal of Cross-Cultural Psychology, 31, 187-212. http://dx.doi.org/10.1177/0022022100031002003 [ Links ]
Cohen, J. (1988). Statistical power analysis for the behavioral sciences. (2nd edn.). Hillsdale, N.J.: Lawrence Earlbaum Associates. [ Links ]
Comrey, A.L. (1983). An evaluation of the Myers Briggs Type Indicator. Academic Psychology Bulletin, 5, 115-129. [ Links ]
Cronbach, L.J. (1951). Coefficient alpha and the internal structure of tests. Psychometrika, 16, 297-344. http://dx.doi.org/10.1007/BF02310555 [ Links ]
De Beer, J. (1997). South African Myers Briggs Type Distribution: A comparative study. Unpublished doctoral thesis, University of Johannesburg, Johannesburg, South Africa. [ Links ]
De Bruin, G.P. (1996). An item factor analysis of the Myers-Briggs Type Indicator® (Form G Self-scorable) for a South African sample [Technical report]. Johannesburg, South Africa: Jopie van Rooyen and Partners. [ Links ]
De Bruin, G.P., & Taylor, N. (2006). The job demand-control model of job strain across gender. South African Journal of Industrial Psychology, 32(1), 66-73. [ Links ]
De Jong, M.G., Steenkamp, J-B.E.M., Fox, J-P., & Baumgartner, H. (2008). Using item response theory to measure extreme response style in marketing research: A global investigation. Journal of Marketing Research, 45, 104-115. http://dx.doi.org/10.1509/jmkr.45.1.104 [ Links ]
Du Toit, F., Coetzee, S., & Visser, D. (2005). The relation between personality type and sense of coherence among technical workers. Southern African Business Review, 9(1), 51-65. [ Links ]
Eid, M., & Rauber, M. (2000). Detecting measurement invariance in organisational surveys. European Journal of Psychological Assessment, 16, 20-30. http://dx.doi.org/10.1027//1015-5759.16.1.20 [ Links ]
Field, A. (2005). Discovering Statistics using SPSS. London, UK: Sage. [ Links ]
Garson, G.D. (2006). Structural Equation Modelling. Retrieved March 12, 2007, from http://www2.chass.ncsu.edu/garson/pa765/factor.htm [ Links ]
Green, K.E., & Frantom, C.G. (2002). Survey development and validation with the Rasch model. Paper presented at the International Conference on Questionnaire development, Evaluation, and Testing, 14-17November2002. Charlesston, SC. [ Links ]
Hagquist, C., & Andrich, D. (2004). Is the Sense of Coherence-instrument applicable on adolescents? A latent trait analysis using Rasch-modelling. Personality and Individual Differences, 36, 955-968. http://dx.doi.org/10.1016/S0191-8869(03)00164-8 [ Links ]
Harvey, R.J., Murry, W.D., & Stamoulis, D. (1995). Unresolved issues in the dimensionality of the Myers-Briggs Type Indicator®. Educational and Psychological Measurement, 55, 535-544. http://dx.doi.org/10.1177/0013164495055004002 [ Links ]
Henard, D.H. (2000). Item response theory. In L.G. Grimm & P.R. Yarnold (Eds.), Reading and understanding more multivariate statistics, (pp. 67-97). Washington, DC: American Psychological Association. [ Links ]
James, L.R., Mulaik, S.A., & Brett, J.M (1982). Causal analysis. Newbury Park, CA: Sage [ Links ]
Johnson, D.A., & Saunders, D.R. (1990). Confirmatory factor analysis of the Myers-Briggs Type Indicator® Expanded Analysis Report. Educational and Psychological Measurement, 50, 561-571. http://dx.doi.org/10.1177/0013164490503010 [ Links ]
Kaplan, R.M., & Saccuzzo, D.P. (2009). Psychological Testing: Principles, Applications, and Issues. (7th edn.). Belmont, CA: Wadsworth Cengage Learning. [ Links ]
Kline, R.B. (2005). Principles and Practice of Structural Equation Modelling. (2nd edn.). New York: The Guilford Press. [ Links ]
Lai, J.S., Teresi, J., & Gershon, R. (2005). Procedures for the analysis of differential item functioning (DIF) for small sample sizes. Evaluation & the Health Professions, 28, 283-294. http://dx.doi.org/10.1177/0163278705278276 [ Links ]
Linacre, J.M. (2010). A users guide to Winsteps Ministep Rasch computer programs [Computer software]. Retrieved from http://www.winsteps.com [ Links ]
Marais, C., Mostert, K., & Rothmann, S. (2009). The psychometrical properties of translated versions of the Maslach Burnout Inventory - General Survey. SA Journal of Industrial Psychology, 35(1), 175-182. [ Links ]
Meiring, D., Van de Vijver, F.J.R., Rothmann, S., & Barrick, M.R. (2005). Construct, item, and method bias of cognitive and personality tests in South Africa. SA Journal of Industrial Psychology, 31, 1-8. [ Links ]
Myers, I.B., McCaulley, M.H., Quenck, N.L., & Hammer, A.L. (1998). MBTI® Manual. Palo Alto, CA: CPP, Inc. [ Links ]
Rasch, G. (1960). Probabilistic models for some intelligence and attainment tests. Copenhagen, Denmark: Paedagogiske Institiuut. [ Links ]
Read, H., Fordham, M., Adler, G., & Mcguire, W. (1974). Psychological Types. Princeton, N.Y: Princeton Press. [ Links ]
Saggino, A., & Kline, P. (1995). Item factor analysis of the Italian version of the Myers-Briggs Type Indicator®. Personality and Individual Differences, 19, 243-249. http://dx.doi.org/10.1016/0191-8869(95)00023-Y [ Links ]
Schaubhut, N.A., Herk, N.A., & Thompson, R.C. (2009). MBTI® Form M Manual Supplement. Palo Alto, CA: CPP Inc. [ Links ]
Sieff, G., & Carstens, L. (2006). The relationship between personality type and leadership focus. SA Journal of Human Resource Management, 4(1), 52-62. [ Links ]
Sipps, G.J., Alexander, R.A., & Friedt, L. (1985). Item analysis of the Myers-Briggs Type Indicator®. Educational and Psychological Measurement, 45, 789-796. http://dx.doi.org/10.1177/0013164485454009 [ Links ]
Taylor, N. (2009). Construct, item and response bias across cultures in personality measurement. Unpublished doctoral thesis, University of Johannesburg, Johannesburg, South Africa. [ Links ]
Taylor, N., & Yiannakis, C. (2007). South African MBTI® Form M Data Supplement [Technical Report]. Johannesburg, South Africa: Jopie van Rooyen and Partners. [ Links ]
Thompson, B., & Borrello, G.M. (1986). Construct validity of the Myers-Briggs Type Indicator®. Educational and Psychological Measurement, 46, 745-752. http://dx.doi.org/10.1177/0013164486463032 [ Links ]
Thompson, B., & Borrello, G.M. (1989). A confirmatory factor analysis of data from the Myers-Briggs Type Indicator®. Paper presented at the annual meeting of the Southwest Educational Research Association, Houston, TX. [ Links ]
Tischler, L. (1994). The MBTI® factor structure. Journal of Psychological Type, 31,24-31. [ Links ]
Tzeng, O.C.S., Outcalt, D., Boyer, S.L., Ware, R., & Landis, D. (1984). Item validity of the Myers-Briggs Type Indicator®. Journal of Personality Assessment, 48, 255-256. http://dx.doi.org/10.1207/s15327752jpa4803_4, PMid:16367525 [ Links ]
Urbina, S. (2004). Essentials of psychological testing. Hoboken, NJ: Wiley & Sons, Inc. [ Links ]
Van de Vijver, F.J.R., & Rothmann, S. (2004). Assessment in multicultural groups: The South African case. South African Journal of Industrial Psychology, 20(4), 1-7. [ Links ]
Wright, B.D., & Linacre, J.M. (1994). Reasonable mean-square fit values. Rasch Measurement Transactions, 8(3), 370. [ Links ]
 Correspondence to:
Casper van Zyl
PO Box 2560, Pinegowrie 2123, South Africa
Email:casper@jvrafrica.co.za
Received: 07 Mar. 2011
Accepted: 08 May 2012
Published: 14 Sept. 2012
1.MBTI, Myers-Briggs, and Myers-Briggs Type Indicator, and the MBTI logo are trademarks or registered trademarks of the MBTI Trust, Inc., in the United States and other countries.