


Services on Demand
Article
 English (pdf)
 Article in xml format
 Article references
Indicators

Related links
-
 Cited by Google
 -
 Similars in Google
Share

 Permalink
SA Journal of Industrial Psychology
On-line version ISSN 2071-0763
Print version ISSN 0258-5200
SA j. ind. Psychol. vol.37 n.1 Johannesburg Jan. 2011
ORIGINAL RESEARCH
Differential item functioning of the UWES-17in South Africa
Leanne Goliath-Yarde; Gert Roodt
Department of Industrial Psychology and People Management, University of Johannesburg, South Africa
ORIENTATION: South Africa's unique cultural diversity provides a constant challenge about the fair and unbiased use of psychological measures in respect of their cross-cultural application.
RESEARCH PURPOSE:This study assesses the Differential Item Functioning (DIF) of the Utrecht Work Engagement Scale (UWES-17) for different South African cultural groups in a South African company.
MOTIVATION FOR THE STUDY:Organisations are using the UWES-17 more and more in South Africa to assess work engagement. Therefore, research evidence from psychologists or assessment practitioners on its DIF across different cultural groups is necessary.
RESEARCH DESIGN, APPROACH AND METHOD: The researchers conducted a Secondary Data Analysis (SDA) on the UWES-17 sample (n = 2429) that they obtained from a cross-sectional survey undertaken in a South African Information and Communication Technology (ICT) sector company (n = 24 134). Quantitative item data on the UWES-17 scale enabled the authors to address the research question.
MAIN FINDINGS: The researchers found uniform and/or non-uniform DIF on five of the vigour items, four of the dedication items and two of the absorption items. This also showed possible Differential Test Functioning (DTF) on the vigour and dedication dimensions.
PRACTICAL/MANAGERIAL IMPLICATIONS:Based on the DIF, the researchers suggested that organisations should not use the UWES-17 comparatively for different cultural groups or employment decisions in South Africa.
Contribution/value add: The study provides evidence on DIF and possible DTF for the UWES-17. However, it also raises questions about possible interaction effects that need further investigation.
Introduction
People often call South Africa the 'rainbow nation'. This illustrates the country's unique cultural diversity. This very uniqueness provides a platform for the constant challenge of testing whether psychological measures (like the UWES-17) are unbiased for different cultural or race groups. We call psychological measures that are not as 'culturally biased'.
One of the criteria for deciding whether a psychological instrument is valid is whether it is appropriate as a measure for a person, group or organisation from another context, culture or society. We cannot assume that it is appropriate without investigating possible test bias and without considering whether it needs adapting and re-norming (Foxcroft & Roodt, 2009). The Employment Equity Act (No. 55 of 1998) and the Amended Employment Equity Act of South Africa (Republic of South Africa, 1998) obliges all test developers and users to consider the effect of psychometric assessments on different groups. The Employment Equity Act No. 55 of 1998, Chapter II par. 8, states that:
Psychological testing and similar assessments are prohibited, unless the test is scientifically valid and reliable, can be applied fairly to all employees, and is not biased against any employee or group .
(Employment Equity Act No. 55 of 1998, Chapter II par. 8)
Therefore, measuring instruments have to meet these specific requirements so that one can use them for different cultural and race groups in South Africa. Schaufeli and Bakker (2003) developed the UWES-17 in the Netherlands to measure work engagement. Work engagement emerged as the opposite or positive antipode of 'burnout', a construct that Maslach and Leiter (1997) developed.
One cannot assume that we can generalise the results one obtains on the UWES in one culture to other cultural groups. Van de Vijver and Leung (1997) stated that, before one compares scores for cultural groups, one should test items for possible bias. Therefore, this study will investigate DIF more closely. DIF is a difference in item scores between two groups that match on the concept of interest (Zumbo, 1999).
Schaufeli and Bakker (2010) stated that different (mostly European) studies reported that the factor structure of the UWES-17 remained invariant across different national samples. Although organisations use the UWES-17 widely in South Africa, only two studies reported validation results. These are the Storm and Rothmann (2003) and the Barkhuizen and Rothmann (2006) studies. Both studies referred to problematic items in the instrument and that one needs to examine these carefully for South African samples. Storm and Rothmann (2003) found evidence that suggests that item content may need improving. This implies that the wording of certain items needs modifying to make them more appropriate for a specific context. These findings show potential item bias or differential item functioning in respect of the UWES-17. No specific studies reported on the DIF of the UWES-17 in the South African context.
Given the diverse cultural landscape of South Africa, it is necessary for organisations to measure work engagement levels scientifically. Furthermore, because South African research frequently uses or cites the scale, it is necessary for the instrument to measure work engagement in different South African cultural groups validly and reliably. The main research question is whether the UWES-17 shows DIF between cultural groups in South Africa. Therefore, the main objective of this study is to assess the DIF on all three of the UWES-17 sub-scales for different cultural groups in a large ICT sector company. More specifically, the sub-objectives of the study are to:
• test the vigour sub-scale for DIF in different cultural groups
• test the dedication sub-scale for DIF in different cultural groups
• test the absorption sub-scale for DIF in different cultural groups.
The structure of the rest of the article follows. Firstly, it will present a review of the literature on current research undertaken on the UWES-17. A description of the research method and procedures the researchers used follows, as well as a description of the results. Finally, it discusses the findings, its implications for managers, its limitations and recommendations for future research.
Literature review
Measuring work engagement
In one of the first discussions of work engagement, Khan (1990) defined personal engagement as the 'harnessing of organisation members' selves to their work roles; in engagement, people employ and express themselves physically, cognitively and emotionally during role performances' (p. 694).
Maslach and Leiter (1997) assumed that work engagement is the opposite or positive antipode of burnout. One assesses it using the opposite pattern of scores of the three dimensions of burnout (energy, involvement and efficacy) as the Maslach Burnout Inventory measures them. However, Schaufeli and Bakker (2004) argued that burnout and engagement are independent states and that one should assess them independently. Schaufeli, Salanova, Gonzalez-Roma and Bakker (2002, p. 74) defined work engagement as a '...positive, fulfilling, work-related state of mind that is characterised by vigour, dedication and absorption'. It refers to a persistent and pervasive affective-cognitive state that does not focus on any particular object, event, person or behaviour.
High levels of energy and mental resilience whilst working, the willingness to invest effort in one's work and persistence in the face of difficulties characterise vigour. A sense of significance, enthusiasm, inspiration, pride and challenge from one's work characterise dedication. Being fully concentrated and deeply engrossed in one's work, when time passes quickly and one has difficulty in detaching from work, characterise absorption (Schaufeli et al., 2002).
In their research, Maslach and Leiter (1997) felt that the opposite scores of the Maslach Burnout Inventory measures work engagement adequately. Schaufeli, Martínez, Marques-Pinto, Salanova and Bakker (2002) argued that burnout and engagement were opposite concepts and that one should measure them independently using different instruments. Therefore, they operationalised work engagement with the UWES-17, a self-reporting instrument that includes the three dimensions of vigour, dedication and absorption. VIgour (VI) consists of six items like 'At my work, I feel bursting with energy'. DEdication (DE) consists of five items like 'My job inspires me'. ABsorption (AB) consists of six items like 'I feel happy when I am working intensely'. Using specific words or idiomatic expressions may result in different interpretations or meanings attaching to these words or phrases when one applies them cross-culturally.
Studies in the Netherlands and Portugal (Schaufeli, Martinez et al., 2002) further demonstrated the psychometric soundness of the UWES-17 in a cross-national study, where the instrument was translated from Dutch to Portuguese, on burnout and engagement of university students. Schaufeli and Bakker (2010) reported that the factor structure of the UWES-17 remained invariant across different national samples, as different studies by Llorens, Bakker, Schaufeli and Salanova (2006); Schaufeli, Bakker and Salanova (2006); Schaufeli, Martínez, Marques-Pinto, Salanova and Bakker (2002); Xanthopoulou, Bakker, Demerouti and Kantsas (in press) reported. However, the question arises of whether this conclusion is still valid when one includes other traditionally non-European cultures in the comparisons. To find answers to this question needs further investigation.
The key concepts of item bias and differential item functioning
Metric or measurement equivalence in cross-cultural comparisons is a key concern in cross-cultural comparative research. One cannot determine equivalence using unequal comparisons (Foxcroft & Roodt, 2009) because the essence of what one is measuring will be questioned. Constructs are equivalent for different cultural groups when one obtains the same or similar scores when using the same or different language versions of the items or measures. If not, the items are culturally biased or the measures are not equivalent. Therefore, cultural bias indicates the presence of factors that challenge the validity of cross-cultural comparisons. One can ascribe the presence of these factors to a host of reasons, all with the generic term of cultural bias. Van de Vijver and Leung (1997) presented three types of bias. These are construct, method and item bias. They describe sources for each of these.
'Construct bias' will occur when the construct one measures is not identical in different cultural groups. This can happen when:
• there is an incomplete overlap of definitions of the construct in different cultures
• poor sampling of a domain in the instrument (where a small number of items in a questionnaire represents broad constructs)
• many studies have been exported from Western to non-Western countries and some of the issues have little or no relevance to non-Western cultures.
'Method bias' will occur because of particular characteristics of the instrument, its administration and aspects that the methods sections of research reports describe. It usually affects scores at the level of the whole instrument. Typical sources are:
• differential response styles
• differential familiarity with the stimuli measures, often because of the different backgrounds of the respondents
• differences in environmental conditions during administration
• communication problems between the examiner and examinee or interviewer and interviewee.
'Item bias' refers to differential item functioning. Incidental differences in the appropriateness of the item content, poor item translation and inadequate item formulation usually produce it. The consequences for equivalence are least clear in the case of item bias (Berry et al., 2002). If a single item or a few items show evidence of bias, one can eliminate them to improve the equivalence of scores. However, evidence of item bias might also indicate that an instrument does not have identical traits. Therefore, it is clear that bias (construct, method and item) will lower the level of equivalence.
Kanjee and Foxcroft (in Foxcroft & Roodt, 2009) stated that item bias implies an unfair advantage or disadvantage to one or more groups. By way of comparison, Wa Kivilu (2010, p. 309) states that test (or item) bias represents score differences that nuisance abilities cause. These abilities are not the focus of measurement. Item Response Theory (IRT), according to Kanjee and Foxcroft (2009), is a test theory used to develop and assemble test items, detect bias (own emphasis) in measuring instruments and analyse test data. They state that, by applying IRT, it is possible to analyse the relationship between the characteristics of the individual and responses to the individual items. An Item Characteristic Curve (ICC) can represent this relationship graphically.
DIF is another term related to item bias. According to Kristjansson, Aylesworth, Mcdowell and Zumbo (2005, p. 936), DIF occurs if there is a difference in an item score between two groups that are matched on the concept of interest. Therefore, an item is unbiased if all people with the same underlying ability one is measuring have the same probability of answering the item correctly, irrespective of their group membership.
Kristjansson et al. (2005) also distinguish between uniform DIF and non-uniform DIF. For dichotomous (binary) items, uniform DIF occurs when the item is more difficult at all ability levels for one group than for the other. Wa Kivilu (2010), by way of contrast, states that there is uniform DIF when there is dependence on group membership but no interaction between score category and group membership (indicated by two parallel ICCs). According to Kristjansson et al. (2005), non-uniform DIF occurs when there is an interaction between ability level and group so that the item is more difficult, for example, for one group at lower levels of ability but more difficult for the other groups at higher levels of ability. This, according to Wa Kivilu (2010), indicates an interaction term that two non-parallel ICCs characterise. Differential Test Functioning (DTF) will occur if several items in the test, or a dimension of the test, show DIF.
One can trace possible reasons for DIF according to Kanjee and Foxcroft (2009). They include using language, concepts or examples that are unfamiliar, inappropriate, or ambiguous; or test speediness and unfamiliar item format. One can use different procedures for detecting DIF in ordinal items (using Likert-type scales). Some of these are the Mantel, the Generalized Mantel-Haenszel, the logistic discriminant function analysis or an unconstrained cumulative logits approach to ordinal logistic regression (Kristjansson et al., 2005). The researchers used a variation of the Ordinal Logistic Regression approach in this study (see Kristjansson et al. 2005).
South African validation studies on the UWES-17
Storm and Rothmann (2003) validated the UWES-17 in the South African Police Service. They investigated the internal consistencies of the three engagement scales of the UWES as well as the construct equivalence and bias for different race groups in their sample. They found the scales had acceptable levels of internal consistency:
• Vigour α = 0.78
• Dedication α = 0.89
• Absorption α = 0.78.
Using exploratory factor analysis and bias analysis, they found the results acceptable for different race groups and showed no uniform or non-uniform bias. This study confirmed that the UWES-17 was acceptable for comparing the work engagement of different race groups. Their study also revealed 'problematic items'. These were:
• items 4 and 14 in the three-factor model (item 4: 'I feel strong and vigorous in my job' and item 14: 'I get carried away by my work')
• items 3, 11, 15 and 16 in the one-factor model (item 3: 'Time flies when I am working', item 11: 'I am immersed in my work', item 15: 'I am very resilient mentally, in my job' and item 16: 'It is difficult to detach myself from my job').
Storm and Rothmann (2003) suggested that the items might be problematic because they are ambiguous, or sample or country specific, and that some of the problems in the items may relate to difficult words that the participants struggled to understand and/or interpret. Examples are 'vigorous', 'immersed' and 'resilient'. Idiomatic expressions like 'I get 'carried away' by my work'; 'At my work, I feel bursting with energy'; or 'Time flies when I am working' (own emphasis) may also be culture- or country-specific and may present similar problems to other cultural groups.
Storm and Rothmann (2003) suggested that we need further research in other occupations in South Africa to establish norms for engagement levels. They encouraged using larger samples because larger samples might yield increased reliability. They suggested that study findings would be consistent in similar groups and recommended modifying the content of the problematic items.
Barkhuizen and Rothmann (2006) conducted another study. The objectives of their study were to assess the psychometric properties of the UWES-17 for academic staff in South African higher education institutions and to investigate differences in work engagement of the different demographic groups. In this study, different demographic groups referred to position in the organisation, qualification, age and gender. The study confirmed that the UWES-17 shows high internal consistency. However, they identified problems with items 9 and 12 (item 9: 'I feel happy when I am engrossed in my work' and item 12: 'In my job, I can continue working for very long periods of time'). These two items showed high standardised residuals and the findings suggested that these items may require deletion or content modification.
In both these studies (Barkhuizen & Rothmann, 2006; Storm & Rothmann, 2003) some of the items on the vigour and absorption scales were problematic. This indicated that item bias of the UWES-17 in South Africa was possible. However, these studies reported no ICCs. Therefore, the main objective of the current study is to assess the DIF in all three of the UWES-17 sub-scales for different cultural groups in a large ICT sector company. In order to achieve this aim, the researchers used the research design that follows for the study.
Research design
Research approach
The researchers used an existing data set. The basis of the SDA was a dataset of the UWES-17 that the researchers obtained from an empirical quantitative research survey undertaken in a South African ICT sector company as part of a larger research project. They focused specifically on the responses to the UWES-17 scale items in order to address the research objective.
Research method
Research participants and sampling
The primary data the researchers used for this study came from a South African ICT sector company that has a workforce of 24 134 full-time employees in positions up to middle management level. They represent all ethnic groups in South Africa. From this pool of employees, the researchers used a census-based approach (where everyone in the target population had an equal chance of participating) to generate the sample. This resulted in a sample of 2 429, a 10.5% response rate. They conducted the SDA on the UWES portion of the larger data set for the purposes of this study. The researchers collected the demographic data that follows from the participants:
• age
• years of service
• gender
• level in organisation
• marital status
• highest qualification
• ethnic group
• number of months in current position
• organisation unit number
• number of other companies for which they had worked.
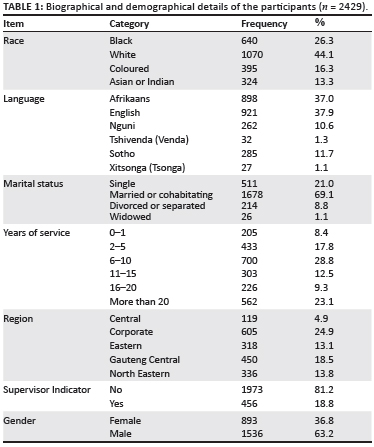
Most participants were White (44.1%) and Black (26.3%). Asians or Indians (13.3%) were the minority group in the sample. Of the participants, 63.2% were men. Only 37.9% of the sample had English as their first language, whilst 37% had Afrikaans as their first language. Of the sample, 28.8% had between six and eight years of service with the organisation. Table 2 presents the cross-tabulations between levels of education, job levels and different cultural groups.
Table 2 shows that most respondents have a Grade 12 or lower qualification (40.7%), a national diploma or national higher diploma (26.9%). Most respondents are in operational positions (55.3%) or in specialist positions (26.7%). Most respondents are from the White group.
Measuring instrument
The researchers used the UWES-17 (Schaufeli et al., 2002) to measure the levels of work engagement. The scale consists of three dimensions. These are vigour (six items) like 'At my work, I feel bursting with energy', dedication (five items) like 'My job inspires me' and absorption (six items) like 'I feel happy when I am working intensely'. The internal consistencies (Cronbach's Alpha) of the UWES-17 usually range between 0.70 and 0.90 (Barkhuizen & Rothmann, 2006; Storm & Rothmann, 2003; Schaufeli et al., 2002). Therefore, they exceed the value of 0.70 that researchers traditionally use as a rule of thumb (Foxcroft & Roodt, 2009).
Research procedure
The researchers sent a web link to the selected respondents via email. The email contained a message giving the purpose and importance of the study and a certificate that confirmed confidentiality. The web link contained an online web-based questionnaire, ready for completion. The researchers captured data in a Structured Query Language (SQL) database that was available immediately after completion.
Statistical analysis
The researchers conducted the statistical analysis using the SPSS programme (2006 version). They performed first exploratory factor and reliability analyses to establish the reliability of the scale and its sub-scales. They initially used analysis of variance tests (ANOVAs) to assess the statistical significance of mean score differences between the different cultural groups on the UWES-17 at an item level. They also used a variation of ordinal logistic regression to detect DIF between cultural groups by using several comparisons for different response categories on each item.
Results
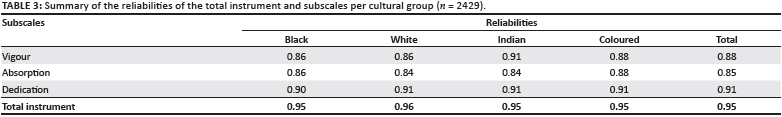
Table 3 shows the reliabilities of the instrument and its sub-scales for the different race groups.
Table 3 gives the Cronbach Alphas for the total instrument and its sub-scales. These coefficients range between 0.85 and 0.95. The different groups also show high reliabilities on the three sub-scales and the total instrument.
Table 4 gives the ANOVA results for the mean scores on the overall instrument and its sub-scales between and within cultural groups.
Table 4 shows that there are statistically significant differences in the mean scores between different cultural groups on the overall scale and its sub-scales. Brown-Forsythe tests show significant differences between different groups for the means of the overall scale and the sub-scales. The results up to this point only suggest significant differences in engagement levels but reveal nothing about DIF.
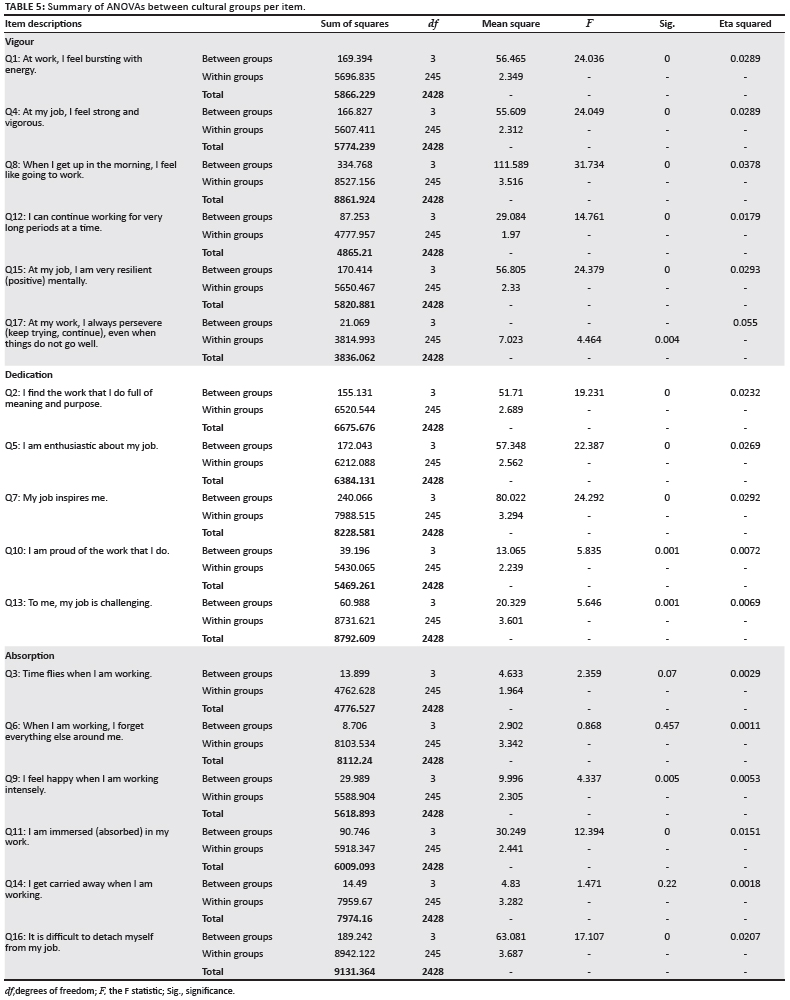
Table 5 gives the ANOVA results for the mean item scores between and within groups.
Table 5 indicates that there are significant mean differences between the cultural groups on all the items except for item 3, 6 and 14 on the absorption sub-scale. Brown-Forsythe tests show that all item means for vigour and dedication are significantly unequal. Therefore, the researchers applied the Dunette T3 post hoc contrast tests. In the case of the absorption items, the item means for items 9, 11 and 16 were significantly unequal. For these items, the researchers applied the Dunette T3 post hoc contrast test. The effect sizes (Eta squared) appear to be small (smaller than 0.05).
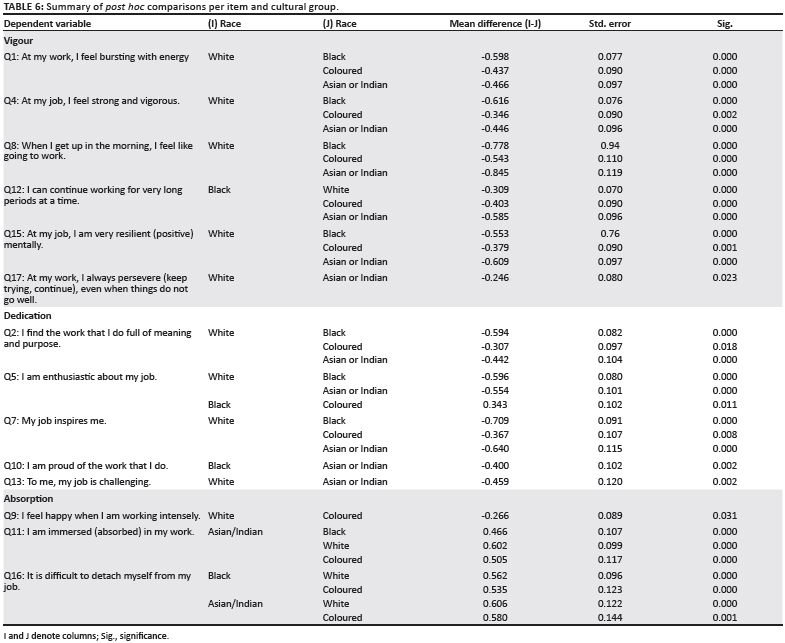
Table 6 gives the results of comparisons per item and race group.
Table 6 indicates that there are significant item score differences mainly between the White group and the other groups or the Black group and the some of the other groups. These differences on an item level provide a sound basis for investigating DIF further.
Results of the DIF analyses
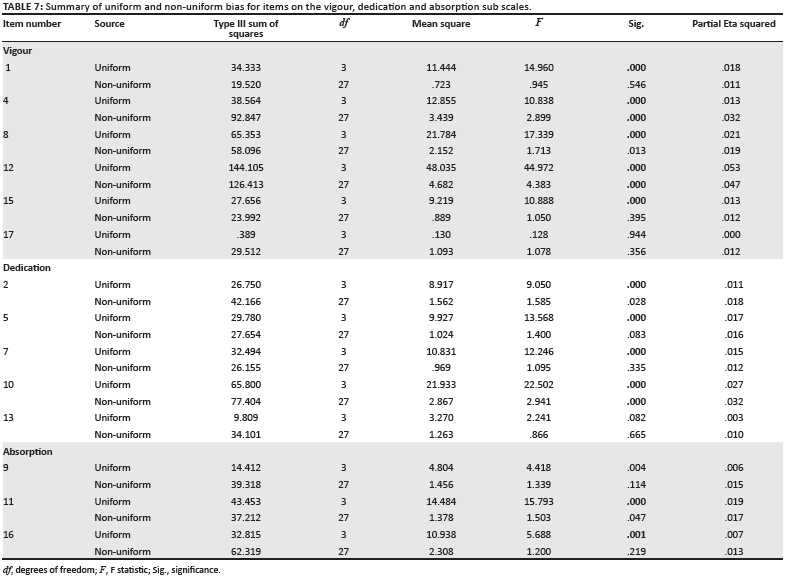
Table 7 gives the summarised results of the ordinal logistic regression analyses. They show both uniform and non-uniform bias for the items. Non-uniform bias refers to influences that are not identical for all score levels (Kristjansson et al., 2005; Van de Vijver & Leung, 1997; Wa Kivilu, 2010). The researchers used the Bonferroni correction (Tabachnik & Fidell, 2001) to take into account the significance levels of all items. Therefore, the researchers will consider only p-values less than 0.001 (those indicated in bold in Table 7) as statistically significant. Table 7 gives a summary of the uniform and non-uniform bias for the vigour, dedication and absorption items.
Table 7 shows that, on the vigour sub-scale for items 1, 8 and 15, the uniform bias is statistically significant whilst for items 4 and 12 both the uniform and the non-uniform bias are statistically significant. This shows item bias between cultural groups. On the dedication sub-scale, the uniform bias is statistically significant for items 2, 5 and 7. For item 10, both the uniform and the non-uniform bias are statistically significant. On the absorption sub-scale, only the uniform bias for item 11 and 16 is statistically significant. The partial Eta squared coefficients show that the practical significance of these differences is, in most cases, small (< 0.03). However, some items recorded slightly higher coefficients.
The graphs below show the distribution of engagement scores in 10 equal categories on the X-axis. The Y-axis gives the item mean scores for the different groups in each category. Figures 1, 2 and 3 are exemplary models of the three types of ICC patterns that the researchers found. Figure 1 shows an exemplary ICC for non-uniform bias (dissimilar engagement score category differences for item 12) between the different groups, especially towards the lower end of the scale.
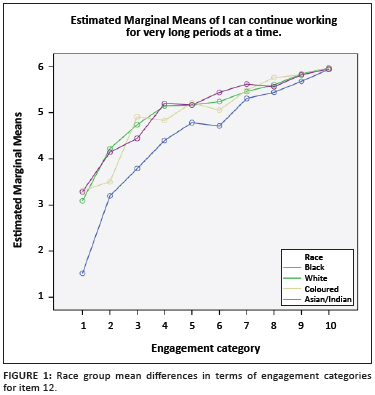
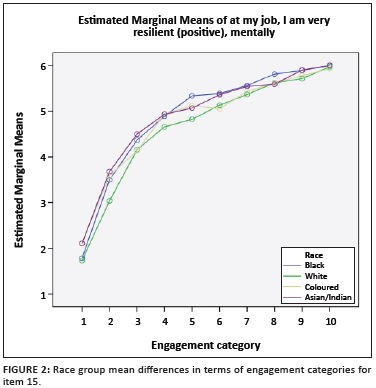
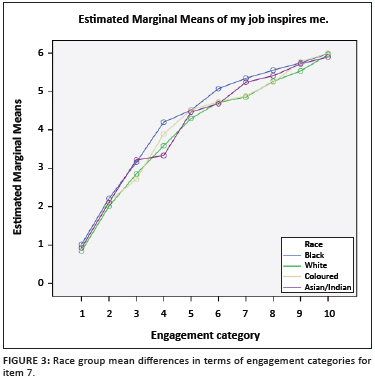
Figure 1 shows the distribution of the responses for each cultural group for item 12 on the vigour sub-scale. Note the clear differences between Black and other race groups for categories 1 to 6. There is a similar distribution for item 10 on the dedication sub-scale and for item 11 (although only uniform DIF is significant in this case) on the absorption sub-scale, where there are larger differences between race groups in the lower categories and smaller differences in the higher categories. The effect sizes (Eta squared and partial Eta squared) may not provide a true picture of these differences because the smaller differences average out the larger differences.
Figure 2 shows an exemplary ICC for uniform DIF (about equal differences in the engagement score categories in respect of item 15) between the different cultural groups.
Figure 2 gives the distribution of the responses for each race group on item 15 on the vigour sub-scale. Throughout the 10 categories, the differences are relatively small but about equal. There is a similar distribution for item 5 on the dedication sub-scale. Effect sizes (Eta squared and partial Eta squared) may provide an accurate assessment of the differences for only these two items (5 and 15), where category differences are about equal between groups.
Figure 3 shows an exemplary ICC for the dissimilar engagement score category differences between the different race groups, especially in the middle categories.
Figure 3 gives the distribution of the scores for each race group for item 7 on the dedication sub-scale. Note that there are larger differences in categories 4 to 8 between some cultural groups. There is a similar distribution for item 8 on the vigour sub-scale, item 2 on the dedication sub-scale and item 16 on the absorption sub-scale, where there are bigger differences between groups in the middle categories. Again, affect sizes (Eta squared and partial Eta squared) may not present a true reflection of differences here, where smaller differences in the lower and higher categories may average out larger differences in the middle categories.
Discussion
The purpose of the study was to assess the DIF of the UWES-17 for different South African cultural groups in a South African ICT sector company. The researchers took the objective further by testing for DIF on the dedication, absorption and vigour sub-scale items of the UWES-17 using ordinal logistic regression analyses. This is the first DIF study on the UWES-17 in South Africa.
The study shows that the UWES displays DIF on all three sub-scales between different cultural groups in South Africa. Therefore, it is not suitable for comparative applications and employment decisions.
Summary of results
The high internal consistency reliabilities (Cronbach Alphas), as given in Table 3, confirm the overall reliability of the instrument and its sub-scales. This is consistent with the findings of other South African studies that Barkhuizen and Rothmann (2006) and Storm and Rothmann (2003) conducted. Overseas studies, which Schaufeli et al. (2002), Schaufeli, and Bakker (2010) reported, also found high internal consistencies for the instrument. These high reliabilities for the different groups should not lead one to believe erroneously that there are no grounds to investigate measurement bias between different cultural groups in South Africa.
The researchers found statistically significant differences between cultural groups on the overall scale level, and on a sub-scale level, for the instrument according to Table 4 (albeit that it reports small Eta squared values). These established differences were helpful in guiding the search for DIF, but do not suggest any item bias or DIF, or DTF, at this time. The first set of ANOVA analyses the researchers conducted on an item level showed that there are statistically significant differences in item mean scores between the White group and most other groups on most of the items. This is true except for item 3 ('Time flies when I am working'), item 6 ('When I am working I forget everything else around me') and item 14 ('I get carried away when I am working') on the absorption sub-scale. The researchers excluded these three items from further analyses. These mean response differences do not indicate DIF per se, but it helps to identify those items that researchers should investigate further for possible DIF.
This study differs in one important respect from the Barkhuizen and Rothmann (2006) and the Storm and Rothmann (2003) studies. Of the pool of 17 items, 14 showed some statistically significant differences between groups. These were all the items on the vigour sub-scale (six), all the items on the dedication subscale (five) and three items on the absorption sub-scale. Their studies highlighted differences for items on the vigour and absorption sub-scales only. One could possibly attribute this to the bigger sample size the researchers used in the current study.
The researchers conducted ordinal logistic regression analyses to assess DIF in order to compare the ICCs on 10 different response categories. They ranged from low (1) to high (10) engagement levels for group differences on each of these 10 categories. These ordinal logistic regression results, per response category for each item, show that there is uniform bias (including those in bold) between groups on the vigour items (1, 4, 8, 12, 15), the dedication items (2, 5, 7, 10) and the absorption items (11, 16). They exclude items 9, 13 and 17, where the researchers found no form of DIF.
The items in bold (4, 10, 12) also showed statistically significant non-uniform bias. Non-uniform bias refers to influences that are not identical for all score levels (Kristjansson et al., 2005; Van de Vijver & Leung, 1997; Wa Kivilu, 2010). Non-parallel ICCs also characterise them. The studies of Barkhuizen and Rothmann (2006), as well as Storm and Rothmann (2003), also flagged items 4, 11, 12, 15, 16 as problematic but did not indicate the nature of the bias.
Small effect sizes for items 5 and 10 may be a true reflection of score category differences. This may not be the case for the remaining items, where score category differences are 'averaged out' between larger and smaller differences. Therefore, these effect sizes may not present a 'true' reflection of the actual group differences in score categories and may lead researchers to apply them blindly. One could attribute the sources of the DIF to a multitude of incidental differences like the appropriateness of the item content (choice of wording), poor item translation and inadequate item formulation, as Kanjee and Foxcroft (2009) as well as Van de Vijver and Leung (1997) pointed out.
Implications for managers and recommendations
The researchers found most differences in the engagement scores between cultural groups, at an item level, between Whites and other groups or Blacks and other groups. It is not clear why these differences have occurred, but an estimated guess would be that these differences relate to language issues. The authors suspect that idiomatic expressions of European origin may have played a large role in these differences. One may also not rule out the possible effects of level of education or language proficiency. Therefore, the authors suggest that, if organisations are to use the UWES in an African context, the wording of the respective items needs careful revision.
Considering that the sample consisted of groups with different cultural backgrounds, different mother tongues and different levels of education, appropriateness of item content and poor understanding of item content could very well be a reality. One should carefully revisit, re-phrase and test these factors for future use. Therefore, the authors recommend that one can only use the UWES-17 on White populations in South Africa and not in comparative settings that include respondents from Coloured, Indian or Asian or Black population groups.
Suggestions for future research
The researchers did not control for the possible moderating effects of language proficiency, education levels, training or work experience levels or other similar effects in this study. If one can separate these possible effects, it may yield a very different picture. Future studies can explore the influence of these effects. The researchers suggest that a similar type of study is conducted between different European and Southern African countries to test whether similar differences also occur between them.
Limitations of the study
The researchers conducted the study in a single organisation. Although they used quite a large sample, which represents the different race groups fairly, it is still limited to a single organisation that does not fully represent the diverse South African population. Furthermore, the study does not report on possible DIF in respect of language, education levels or gender groups. They fell outside the scope of this study.
Conclusions
The purpose of the study was to assess the DIF of the UWES-17 for different South African cultural groups in a South African ICT sector company. The results show no item bias for item 3, 6 and 14, where the researchers obtained no overall statistical significant mean score differences.
Ordinal regression analyses the researchers conducted to detect DIF on each item show statistically significant uniform bias on items 1, 8, 15, 2, 5, 7, 11 and 16. However, the researchers found no form of bias on items 9, 13 and 17 despite significant overall mean difference scores. Items 4, 10 and 12 also show statistical significant non-uniform bias. Therefore, five items of the vigour sub-scale and four items of the dedication sub-scale show DIF and DTF. The researchers have achieved the objectives of the study.
Acknowledgements
The authors thank Roslyn de Braine and Chris Bothma for the use of their dataset to conduct the secondary data analysis of this study.
The authors gratefully acknowledge the suggestions that Prof. Deon de Bruin made and the analyses he conducted to detect item bias.
Authors' competing interests
The authors declare that they have no financial or personal relationship(s) that may have inappropriately influenced them in writing this paper.
Authors' contributions
Gert Roodt was the project leader and responsible for the experimental and project design. Leanne Goliath-Yarde was responsible for executing the study and writing the research article.
References
Barkhuizen, N., & Rothmann, S. (2006). Work engagement of academic staff in South African higher education institutions. Management Dynamics, 15(1), 38-46. [ Links ]
Berry, J.W., Poortinga, Y.H., Segall, M.H., & Dasen, P.R. (2002). Cross-Cultural Psychology Research and Applications. (2nd edn). Cambridge: Cambridge University Press. [ Links ]
Foxcroft, C., & Roodt, G. (2009). Introduction to psychological assessment in the South African context. (3rd edn). Cape Town: Oxford University Press. [ Links ]
Kanjee, A., & Foxcroft, C. (2009). Cross-cultural test adaptation, translation and test in multiple languages. In C. Foxcroft & G. Roodt, Introduction to Psychological Assessment in the South African context. (3rd edn), (pp. 82-84). Cape Town: Oxford University Press. [ Links ]
Khan, W.A. (1990). Psychological conditions of personal engagement and disengagement at work. Academy of Management Journal, 33(4), 692-724. http://dx.doi.org/10.2307/256287 [ Links ]
Kristjansson, E., Aylesworth, R., Mcdowell, I., & Zumbo, B.D. (2005). A comparison of four methods for detecting Differential Item Functioning in Ordered Response Items. Educational and Psychological Measurement, 65(6), 935-953. http://dx.doi.org/10.1177/0013164405275668 [ Links ]
Leiter, M.P., & Bakker, A.B. (eds) (2010). Work Engagement: A Handbook of Essential Theory and Research. New York: Psychology Press. [ Links ]
Llorens, S., Bakker, A., Schaufeli, W.B., & Salanova, M. (2006). Testing the robustness of the Job Demands-resources model. International Journal of Stress Management, 13, 378-391. http://dx.doi.org/10.1037/1072-5245.13.3.378 [ Links ]
Maslach, C., & Leiter, M.P. (1997). The truth about burnout: How organisations cause personal stress and what to do about it. San Francisco, CA: Jossey-Bass. [ Links ]
Republic of South Africa (1998). Employment Equity Act No 55 of 1998. Chapter II, para 8. The South African Department of Labour [Government Gazette Law]. [ Links ]
Schaufeli, W.B., & Bakker, A.B. (2010). Defining and measuring work engagement: Bringing clarity to the concept. In M.P. Leiter & A.B. Bakker (eds). Work Engagement: A Handbook of Essential Theory and Research, (pp. 10-24). New York: Psychology Press. [ Links ]
Schaufeli, W.B., & Bakker, A.B. (2004). Job demands, job resources and their relationship with burnout and engagement: a multiple-sample study. Journal of Organisational Behaviour, 25(3), 293-315. http://dx.doi.org/10.1002/job.248 [ Links ]
Schaufeli, W.B., & Bakker, A. (2003). Utrecht Work Engagement Scale. Utrecht University, Occupational Health Psychology Unit. [ Links ]
Schaufeli, W.B., Bakker, A., & Salanova, M. (2006). The measurement of work engagement with a short questionnaire: A cross-national study. Educational and Psychological Measurement,66, 701-716. http://dx.doi.org/10.1177/0013164405282471 [ Links ]
Schaufeli, W.B., Martínez, I., Marques-Pinto, A., Salanova, M., & Bakker, A.B. (2002). Burnout and engagement in university students: a cross national study. Journal of Cross-cultural Psychology, 33(5), 464-481. http://dx.doi.org/10.1177/0022022102033005003 [ Links ]
Schaufeli, W.B., Salanova, M., Gonzalez-Roma, V., & Bakker, A.B. (2002). The measurement of engagement and burnout: a two sample confirmatory factor analytic approach. Journal of Happiness Studies, 3(1), 71-92. http://dx.doi.org/10.1023/A:1015630930326 [ Links ]
Storm, K., & Rothmann, S. (2003). A psychometric analysis of the Utrecht work engagement scale in the South African Police Service. SA Journal of Industrial Psychology, 29(4), 62-70. [ Links ]
Tabachnick, B.G., & Fidell, L.S. (2001). Using Multivariate Statistics. (4th edn). Boston, MA: Allyn and Bacon. [ Links ]
SPSS version 15 [Computer software] (2006). Cape Town, SPSS Inc. [ Links ]
Van de Vijver, F., & Leung, K. (1997). Method and data analysis for cross-cultural research. Thousand Oaks, CA: Sage [ Links ]
Wa Kivilu, J.M. (2010). Determination of Differential Bundle Functioning (DBF) of numeracy and literacy tests administered to Grade 3 learners in South Africa. South African Journal of Psychology, 40(3), 308-317. [ Links ]
Xanthopoulou, D., Bakker, A.B., Demerouti, E., & Kantsas, A. (in press). The measurement of burnout and work engagement: A comparison of Greece and The Netherlands. New Review of Social Psychology. [ Links ]
Zumbo, B.D. (1999). A handbook on the theory and methods of differential item functioning (DIF): Logistic regression modelling as a unitary framework for binary and Likert-type item scores. Ottawa, Canada. Directorate of Human Resources Research and Evaluation, Department of National Defense. [ Links ]
 Correspondence to:
Gert Roodt
Postal address: PO Box 524
Auckland Park 2006
South Africa
Email: groodt@uj.ac.za
Received: 26 Feb. 2010
Accepted: 05 Sept. 2011
Published: 15 Nov. 2011
© 2011. The Authors. Licensee: AOSIS OpenJournals. This work is licensed under the Creative Commons Attribution License.
The authors acknowledge the financial support from the South African Netherlands research Program on Alternatives in Development (SANPAD) for conducting this research. The conclusions the authors reach and the opinions they express do not necessarily reflect the views of SANPAD.
The research this article reports is the product of a collaborative research project between the University of Johannesburg and the Vrije University, Amsterdam.

