


Servicios Personalizados
Articulo
 Inglés (pdf)
 Articulo en XML
 Referencias del artículo
Indicadores

Links relacionados
-
 Citado por Google
 -
 Similares en Google
Compartir

 Permalink
SA Journal of Industrial Psychology
versión On-line ISSN 2071-0763
versión impresa ISSN 0258-5200
SA j. ind. Psychol. vol.37 no.1 Johannesburg ene. 2011
ORIGINAL RESEARCH
A preliminary factor analytic investigation into the first-order factor structure of the Fifteen Factor Plus (15FQ+) on a sample of Black South African managers
Seretse Moyo; Callie Theron
Department of Industrial Psychology, University of Stellenbosch, South Africa
ABSTRACT
ORIENTATION: The Fifteen Factor Questionnaire Plus (15FQ+) is a prominent personality questionnaire that organisations frequently use in personnel selection in South Africa.
RESEARCH PURPOSE: The primary objective of this study was to undertake a factor analytic investigation of the first-order factor structure of the 15FQ+.
MOTIVATION FOR THE STUDY: The construct validity of the 15FQ+, as a measure of personality, is necessary even though it is insufficient to justify its use in personnel selection.
RESEARCH DESIGN, APPROACH AND METHOD: The researchers evaluated the fit of the measurement model, which the structure and scoring key of the 15FQ+ implies, in a quantitative study that used an ex post facto correlation design through structural equation modelling. They conducted a secondary data analysis. They selected a sample of 241 Black South African managers from a large 15FQ+ database.
MAIN FINDINGS: The researchers found good measurement model fit. The measurement model parameter estimates were worrying. The magnitude of the estimated model parameters suggests that the items generally do not reflect the latent personality dimensions the designers intended them to with a great degree of precision. The items are reasonably noisy measures of the latent variables they represent.
PRACTICAL/MANAGERIAL IMPLICATIONS: Organisations should use the 15FQ+ carefully on Black South African managers until further local research evidence becomes available.
CONTRIBUTION/VALUE-ADD: The study is a catalyst to trigger the necessary additional research we need to establish convincingly the psychometric credentials of the 15FQ+ as a valuable assessment tool in South Africa.
Introduction
Key focus of the study
Selection is a critical human resource management procedure in organisations because it regulates the movement of employees into and through organisations to improve their work performance (Theron, 2007).
Personnel selection procedures should act as filters that allow only those employees to pass through who will perform optimally on the multi-dimensional criterion construct. However, measures of the criterion construct are not the basis of section decisions. Rather, clinical or mechanical estimates of the criterion performance, which one could expect from each applicant, are (Ghiselli, Campbell & Zedeck, 1981; Schmitt, 1989; Theron, 2007).
An accurate (clinical or mechanical) estimate of measures of the criterion construct is possible from predictor information that is available at the time of the selection decision if it meets three conditions. Firstly, the predictor needs to correlate with a (valid and reliable) measure of the criterion. Secondly, the selection decision-maker has to understand the nature of the predictor-criterion relationship in the appropriate applicant population accurately. Finally, construct valid measures of the predictor construct must be available (Ghiselli et al., 1981; Guion, 1998).
In terms of a construct-orientated approach to predictor development (Binning & Barrett, 1989), a performance hypothesis is developed in the form of a job performance structural model using competency potential latent variables (Saville & Holdsworth, 2000; 2001). They determine performance on the multidimensional criterion construct. If the performance hypothesis is valid, it is possible in principle to estimate job performance from measures of the competency potential latent variables. However, one can only realise this possibility if one understands the nature of the relationship between the performance construct and its person-centred determinants accurately and if one can measure the predictor constructs in a construct valid manner at the time of the selection decision.
To establish the validity of the performance hypothesis, one derives operational hypotheses deductively from the substantive performance hypothesis by defining the performance construct and the explanatory psychological constructs operationally. The operational definition of the performance construct is a premise in a deductive argument, as are the operational definitions of the explanatory psychological constructs.
The validity of the deductive argument depends on the validity of these premises (Copi & Cohen, 1990). In a valid deductive argument, the premises provide conclusive grounds for the truth of the conclusion (Copi & Cohen, 1990). The conclusion that one derives from the initial statement will be true only if the premises are true.
Therefore, one can only claim that empirical tests of the operational performance hypotheses will shed light on the validity of the theoretical performance hypothesis if one can show that the criterion and predictor measures are valid measures of the performance construct and the explanatory psychological latent variables.
In South Africa, highly relevant questions are:
• do the assessment techniques organisations use for selecting personnel succeed also to measure the intended predictor constructs as constitutively defined in members of constitutionally-protected groups
• do the assessment techniques measure the target constructs in the same way in protected and non-protected groups (Vandenberg & Lance, 2000)?
Should one find empirical confirmation of the operational performance hypotheses (assuming that the deductive argument mentioned earlier was valid), one may regard the substantive performance hypothesis as corroborated because it has not been refuted (Popper, 1972).
Therefore, in testing the performance hypothesis and in using the predictors during selection, construct validity is a necessary but insufficient condition to achieve a valid outcome.
Background to the study
Evidence about the construct validity and the measurement equivalence of the criterion and predictor measures, although critically important, does not provide enough evidence to justify the actual criterion estimates that one derives clinically or mechanically (Gatewood & Feild, 1994; Grove & Meehl, 1996) from measures of the predictor constructs. Practical selection decisions use criterion inferences as bases. One derives them clinically or mechanically from predictor information that is available at the time of the selection decision (Bartram, 2005; Ghiselli, Campbell and Zedeck, 1981; Theron, 2007). The final analysis needs to show that these criterion inferences, on which organisations base their selection decisions, are permissible because they relate systematically to the actual level of job performance that applicants will deliver if organisations appoint them.
Furthermore, one can only justify selection procedures fully if one can show that one derived the inferences in a way that does not discriminate unfairly against the members of any group and that the value of the improved performance, which the selection procedure brought about, exceeds the investment the organisation needs to run the selection procedure (Guion, 1998).
The confident use of any predictor, in specific personnel selection procedures that aim at filling vacancies in specific positions in specific organisations, would therefore require credible evidence of its predictive validity, fairness and utility as well as evidence about the construct validity and measurement equivalence of the predictor (Guion, 1998) of the selection procedure. Because the instruments organisations use in selection procedures provide valid, reliable and invariant measures of the construct they claim to measure does not, by itself, offer any guarantee that the criterion inferences will be valid, fair and have positive utility.
Evidence about the construct validity and the measurement equivalence of the criterion and predictor measures are insufficient to justify the actual criterion estimates that one derives from measures of the predictor constructs. Nevertheless, the evidence is still indispensible for constructing a watertight case for the specific use of a selection battery.
There is a definite need in South Africa for psychological measures that meet the standard requirements of validity and reliability and which give unbiased measures of the target construct across race, gender and cultural groups (Foxcroft, Roodt & Abrahams, 2001).
There is a concern that too many measures came from overseas in the past and that organisations used them locally without first establishing whether they were psychometrically suitable for all segments of the South African population (Foxcroft et al., 2001). It is also worrying that organisations have used psychometrically questionable psychological measures inappropriately in the past, especially when assessing members of groups that the constitution now protects.
It should have been standard practice all along to use scientifically valid, reliable and unbiased instruments to measure the psychological construct of interest. However, the commitment to avoid the mistakes of the past brings with it a more keen awareness of the importance of unbiased and valid construct measures.
This places a responsibility on practitioners, and especially test developers and distributors, to produce sophisticated, indisputable scientific evidence that the instruments that organisations use in South Africa are psychometrically appropriate for, and relevant to, the South African context.
Consequently, this challenges the industrial-organisational psychology fraternity to show that the assessment techniques organisations use in personnel selection in South Africa succeed in measuring the intended predictor constructs, as defined constitutively, in the different ethnic groups and that the assessment techniques measure their target constructs in the same way.
Trends from the literature
Organisations frequently use measures of personality as predictors in personnel selection (Morgeson, Campion, Dipoye, Hollenbeck, Murphy & Schmitt, 2007a).
The term 'personality' comes from the Latin word persona, which means mask. It refers to the mask that people wear when dealing with others as they play various roles in life. Therefore, personality refers to the behavioural trends or tendencies that people display when they respond to the demands of social conventions and traditions (Hall & Lindzey, 1957). John and Srivastava (1999) see personality as a set of more or less stable characteristics that others assess and judge to distinguish one person from another.
We assume that these characteristics remain consistent across time and place and underlie behaviour. However, this assumption has been difficult to prove empirically (Mischel, 2004). One way of accounting for the variability in behaviour in different contexts is to argue that it reflects the influence of extraneous variables and measurement error (Mischel, 2004).
An alternative way of accounting for the variability in behaviour in different situations is to treat the situations as necessary and integral components of personality theory. The context in which people behave affects the nature of their behaviour. In this approach, the interaction between personality and situational characteristics holds the clue to understanding and predicting behavioural variability in different situations. More specifically, the objective situations are not important. Instead, it is how people interpret those situations subjectively. Consequently, one would only expect behavioural consistency in a variety of situations if one appraises the situations similarly. Therefore, one would expect more complex 'if ... then' situation-behaviour relationships to exist in terms of this line of reasoning (Mischel, 2004).
Using measures of personality for selection has oscillated in an out of favour over the years. In a review of 12 years of research, which the Journal of Applied Psychology and Personnel Psychology published between 1952 and 1963, Guion and Gottier (1965) concluded that one should not use personality tests for personnel selection.
This position had general acceptance until the publication, in 1991, of the meta-analyses of Barrick and Mount (1991) as well as Tett, Jackson and Rothstein (cited in Morgeson et al., 2007a).
Personality, as an influential causal antecedent of job performance (Borman & Motowidlo, 1997), and especially contextual performance (Borman & Motowidlo, 1993; Van Scotter & Motowidlo, 1996), now enjoys wider acknowledgement.
The interest in personality assessment in personnel selection has recently received renewed research interest (Mount & Barrick, 1995; Ones, Dilchert, Viswesvaran & Judge, 2007; Tett & Christiansen, 2007). One can attribute the resurgence of research that focuses on using personality variables as predictors in selection research partly to the realisation that meaningful validation research requires more than relating a multitude of personality dimensions indiscriminately to measures of overall job performance.
However, there are researchers who argue against the over-enthusiastic acceptance of personality as a predictor of performance (Morgeson et al., 2007a; Morgeson et al., 2007b). The central issue that concerns Morgeson et al. (2007a; 2007b) is the rather low validity of personality tests for predicting job performance. The meta-analytic studies, which led to a resurgence of interest in personality as a predictor of job performance, corrected the observed validity coefficients for factors like range restriction, criterion unreliability and predictor reliability. However, researchers usually do not control the effect of these factors when inferring criterion performance from personality assessments in practice.
The call by Morgeson et al. (2007a; 2007b) to use personality measures carefully in personnel selection has merit. However, abandoning the use of personality measures would be an overly rash response. The likelihood that personality plays no role in job performance seems small.
Researchers will only obtain practically significant validity coefficients if they model how personality affects job performance more accurately. The basic premise should be that job performance is complexly determined (Cilliers, 1998).
An approach that hypothesises through theorising how a more manageable and limited set of second-order personality factors, affects specific job performance dimensions seems to improve the likelihood of revealing the intricate logic in terms of which personality affects job performance. In addition, the personality x situation interaction hypothesis, which Mischel (2004) proposed, seems to have a bearing on this debate.
The Fifteen Factor Questionnaire Plus - 15FQ+ (Psytech International, 2000) - is a prominent personality questionnaire organisations frequently use for personnel selection in South Africa1, 2. The 15FQ+ is a normative, trichotomous factor-based measure of occupational personality, developed as an update of the much-used 15FQ that Psytech International first published in 1991. Psytech International developed the 15FQ as an alternative to the 16PF series of tests that measure the normal personality structure that Cattell and his colleagues first identified in 1946 (Meiring, Van de Vijver, & Rothmann, 2006; Tyler, 2003).
Psytech International designed both versions of the test (15FQ and 15FQ+) for use in industrial and organisational settings. According to Tyler (2003), Psytech International developed the original version of the 15FQ to assess 15 of the 16 personality dimensions that Cattell and his colleagues identified in 1946.
For practical reasons, the 15FQ excluded Factor B of the 16PF. This is a measure of reasoning ability or intelligence. The reason was the understanding that one cannot measure intelligence using untimed personality tests, as was the case with Cattell's Factor B in the 16PF test series. Consequently, the authors of the 15FQ+ reconstructed Factor B as a meta-cognitive personality variable, known as 'intellectance', instead of an ability factor. The reinterpretation of Factor B, as a personality trait, warranted its inclusion in an untimed personality questionnaire.
Since its inception, organisations across the world have used the 15FQ+ widely (Tyler, 2003). Meiring et al. (2006) and Tyler (2003) report reasonable to strong reliability coefficient values of between 0.60 and 0.85 for the 15FQ+ scales. Meiring et al. (2006) cite reliability findings, with a mean of 0.75, for South African professional and management development candidates.
Studies in South Africa include, amongst others, a study of managers in a manufacturing company, a study of South African insurance sales consultants, a study of South African police officers tested for promotion or placement and a study of marketing personnel in a tobacco manufacturing company (Psytech South Africa, 2004). Tyler (2003), who has extensively researched the 15FQ+, interpreted the available reliability study results as showing that the 15FQ+ scales have acceptable levels of reliability.
A question that arises from Tyler's conclusion is how to define an acceptable level of reliability. Gliem and Gliem (2003) offer these rules of thumb for interpreting Cronbach's alpha: "> 0.90 - excellent, > 0.80 - good, 0.70 - acceptable, > 0.60 - questionable, > 0.50 - poor, and < 0.50 - unacceptable" (p. 231).
The existing reliability studies did not only deal with Black management candidates. Studies that Meiring, Van de Vijver, Rothmann & Barrick (2005) and Meiring et al., (2006) conducted on the 15FQ+ included Black respondents.
Meiring et al. (2005) and Meiring et al. (2006) report very low internal consistency reliability for some of the 15FQ+ subscales for some of the African language groups they compared. Generally, the reliability coefficients that Meiring et al. (2005) and Meiring et al. (2006) reported for the African language groups on the various subscales are reasons for concern. Based on information from Psytech South Africa (2007), there is no known research on an exclusive Black management sample. The present study is the first of its kind in South Africa.
The concurrent administration of the 15FQ and the 15FQ+ to 70 Psytech International course delegates, as part of their practical experience, showed that ten of the corrected correlations between the two instruments showed, or approached, unity.
The researchers made corrections because of differences in the meaning of the scales. The 15FQ+ technical manual gives further construct validity evidence. The 15FQ+ technical manual reports evidence, in the form of correlations with other personality measures, like the Bar-on Emotional Quotient Inventory (BAR-ON EQ-I), the Jung Type Indicator (JTI) and the NEO Personality Inventory - Revised (NEO PI-R), that supports the construct validity of the 15 FQ+.
Meiring, Van de Vijver and Rothmann (2006) also cite Tyler's (2002) evidence that supports the construct validity of the 15FQ+ based on the instrument's correlations with other personality measures like the 16PF, the revised 16 Personality Questionnaire (16PF5) and the big-five personality factor model. The pattern of results is similar to the pattern of correlations, which Psychometrics International reported, between the NEO PI-R and the 16PF5 (Psychometrics International, 2002).
These correlations undoubtedly point to the construct validity of the 15FQ+. However, Tyler (2003) mentions that there is little criterion-related validity evidence for the 15FQ+. Nevertheless, Psytech South Africa (2004) reports on a few studies that show that the 15FQ+ can predict performance appraisal outcomes for managers, supervisors and equity managers in a manufacturing company and for those in insurance policy sales (Tyler, 2003; Psytech South Africa, 2004).
Various local and international studies support the hypothesis that the 15FQ+ is a construct valid measure of personality. However, the available evidence is not very strong. Apparently, researchers have not evaluated the fit of the measurement model, which the constitutive definition of the personality construct and the design of the 15FQ+ implies using confirmatory factor analysis (CFA). They have also not evaluated the fit of a fully-fledged structural model that maps the first-order personality factors onto latent variables to which they are conceptually supposed to relate.
In addition, researchers will have to test the tentative conclusion that the 15FQ+ is a construct valid measure of personality to determine whether it holds in South Africa and particularly for Black South African managers. The confident use of the 15FQ+ in personnel selection in South Africa means that researchers must develop a convincing argument as to why and how personality (as the 15FQ+ interprets it) should relate to job performance. It also means that a structural model, which follows from the previous argument, fits the empirical data and shows that there is support for the performance hypothesis.
Furthermore, researchers should show that the predictor and criterion constructs are validly and reliably measured in the various subgroups that typically comprise applicant groups in South Africa.
Lastly, researchers should at least show that membership of race and gender groups does not affect how the predictor and criterion constructs express themselves in observed measures.
The objective of this research is to contribute to the available psychometric evidence about the last aspect mentioned above.
Research objectives
A specific interpretation of personality is the basis of the 15FQ+. The structure of the instrument reflects a specific design intention. The structural design of the 15FQ+ reflects the intention to construct sixteen essentially3 one-dimensional sets of twelve items each to reflect variance in each of the sixteen latent personality dimensions that collectively comprise the personality construct. The 15FQ+ items should function as stimuli to which testees respond with behaviours that are primarily relatively uncontaminated expressions of a specific underlying latent personality dimension.
The developers of the instrument chose specific items for a specific subscale because they believe that they reflect (and consequently correlate with) that specific first-order personality dimension.
This does not imply that the first-order personality dimensions have narrow definitions or are very specific constructs. Instead, the personality traits the 15FQ+ measure are broad personality dimensions. The development of the 15FQ+ used the factor analytic perspective of Cattell (Cattell, Eber & Tatsuoka, 1970).
Cattell favoured an approach to constructing subscales in which each item primarily represents a specific personality dimension. However, at the same time, each item also
It is impossible to isolate behavioural indicators that reflect only a single personality dimension. Although the behavioural indicators in a specific subscale would primarily reflect the personality dimension that subscale measures, all the remaining personality factors would also influence the behavioural indicators positively and negatively, albeit to a lesser degree. When computing a subscale total score, the positive and negative loading patterns on the remaining factors cancel each other out in what Cattell called a 'suppressor action' (Cattell et al., 1970; Gerbing & Tuley, 1991). Because the personality dimensions the 15FQ+ measures are broader constructs, one would expect individual item indicators of each first-order personality dimension to load relatively lower onto a single factor. In addition, one would expect the subscale items to correlate relatively lower in terms of the Cattellian approach to constructing subscales.
Nevertheless, the scoring key of the 15FQ+ still reflects the expectation that all items, which comprise a specific subscale, should load onto a single dominant factor. It is because of this assumption that one can use these items to derive an observed score for that specific personality dimension (and only that one). When one calculates a subscale score for a specific personality dimension, one combines only the items that comprise that specific subscale.
This does not imply that the 16 first-order personality dimensions do not share variance to some degree. The 15FQ+ assumes that the first-order personality dimensions correlate and that one can explain the correlation in terms of a limited set of second-order factors (Psytech International, 2000). Therefore, it implies a specific first-order measurement model in which each specific latent personality dimension, which contains the 15FQ+ interpretation of personality, reflects itself primarily in the specific items written for the specific subscale. In addition, one could expand the basic first-order measurement model into a second-order measurement model that also reflects how second-order personality factors express themselves in first-order personality dimensions.
The objective of the study is to evaluate the fit of the (first-order) 15FQ+ measurement model on a sample of Black South African managers. It does not evaluate the fit of the second-order 15FQ+ measurement model.
The substantive hypothesis this study tested is that the 15FQ+ is a valid and reliable measure of personality, as the instrument defines it, amongst Black South African managers.
The substantive hypothesis converts into the specific operational hypotheses that follow:
• the measurement model the scoring key of the 15FQ+ implies can reproduce closely the observed covariances between the item parcels4 formed from the items that comprise each of the subscales
• the factor loadings of the item parcels onto their designated latent personality dimensions are significant and large
• the measurement error variances associated with the parcels are small
• the latent personality dimensions explain large proportions of the variance in the item parcels that represent them
• the latent personality dimensions correlate low to moderately with each other.
Research design
A number of test publishers and distributors of psychological tests compete in the South African market. The 15FQ+ is a prominent personality test that organisations use extensively in South Africa.
The results of studies of this nature, when published, can significantly affect the market reputation of the instruments being evaluated. Therefore, it becomes imperative that, when test publishers allow independent researchers to evaluate their instruments, the researchers reach valid verdicts about the psychometric merits of the instruments.
The credibility of the verdicts depends on the methodology the researchers use to reach them (Babbie & Mouton, 2001). If the methodology is flawed, it will jeopardise the chances of valid conclusions about the success of the instruments in measuring the specific constructs they intend to measure.
To ensure that scientific methodology serves the epistemic ideal of science, scientific researchers should subject their methods to critical inspection by knowledgeable members of the scientific community in which the researchers perform the research. In this sense, science is rational (Babbie & Mouton, 2001). However, scientific rationality can only serve the epistemic ideal of science if the researchers describe the methods they use in their scientific inquiries comprehensively and if they motivate thoroughly the methodological choices they make.
Research approach
The researchers pursued their research objective by quantitatively testing the operational hypotheses they stated earlier.
However, they are not suggesting that a single study of this nature will allow for a decisive verdict on the construct validity of the 15FQ+ as a measure of personality amongst Black South African managers. Apart from the fact that the sample is too small and not representative of the population of Black South African managers, satisfactory measurement model fit would constitute insufficient evidence to establish the construct validity of the 15FQ+ conclusively.
To achieve a comprehensive investigation into the construct validity of the 15FQ+ requires the explication of the nomological network in which the personality construct is imbedded and confronting the resulting structural model with empirical data.
In addition, the researchers do not suggest that, if the study obtained satisfactory measurement model fit, it would clear the 15FQ+ unequivocally for use as an instrument for selecting Black South African managers. However, absence of measurement model fit would seriously erode confidence in the construct validity of the instrument and would raise questions about using the instrument for selecting Black South African managers.
The researchers tested the operational hypotheses using a correlational ex post facto research design. In terms of the logic of the ex post facto correlational design, researchers observe the indicator variables5 and calculate the covariance between the variables they observed. The researchers subsequently obtained estimates for the freed measurement model parameters in an iterative fashion in order to reproduce the observed covariance matrix as accurately as possible (Diamantopoulos & Siguaw, 2000).
If the fitted model fails to reproduce the observed covariance matrix accurately, it means that the measurement model the 15FQ+ scoring key implies does not explain the observed covariance matrix. Therefore, the 15FQ+ does not measure the personality domain, as the designers intended it to, in the sample of Black South African managers (Byrne, 1989; Kelloway, 1998).
However, the converse is not true. If the covariance matrix derived from the estimated model parameters corresponds closely to the observed covariance matrix, it does not imply that the processes the measurement model postulates must necessarily have produced the observed covariance matrix and therefore that the 15FQ+ does measure the personality domain as the developers intended it to. A high degree of fit between the observed and estimated covariance matrices means that the processes the measurement model outlines only give one plausible explanation for the observed covariance matrix.
Research method
Research participants
The researchers drew the data for this study from a large 15FQ+ database that Psymetric (Pty) Ltd, a human capital assessment and consulting company, provided with the permission of Psytech South Africa.
The database contained the individual raw item scores for each of the items in the 15FQ+ and self-reported information about each respondent's gender, age, language, disability, referral organisation and education. The original database represented all races. The researchers selected all Black South African management respondents in the database for the study.
Psymetric obtained the data through a series of non-probability samples of South African Black professionals. Psymetric had assessed them for various positions as requested by their client organisations in different industries and occupations. Psymetric completed the assessments between April 2001 and May 2006 in different settings but in the same standardised conditions.
The initial sample comprised 290 respondents. Of these, 49 cases had incomplete scores and the researchers excluded them from the final sample. The final sample comprised 241 (148 men and 93 women) respondents. The respondents' ages ranged between 22 and 57.
Some applicants' information, like age, qualifications and occupation, was missing. The researchers made a decision to include these respondents as long as their test scores were complete. However, this might have slightly compromised the accuracy of reporting the sample's average level of education, age and occupation. An accurate description of the composition of the research sample was desirable because these characteristics probably influence how subjects respond to the items in the 15FQ+.
Because of the sampling methodology and the sample size, this study cannot claim to have examined a representative section of the target population of Black South African managers in organisational settings. Therefore, the researchers cannot reach a definite conclusion about the applicability of the 15FQ+ to Black South African managers in organisational settings in South Africa. Nevertheless, if the measurement model that the instrument design implies does fit the sample data well, it would be relevant but limited evidence that one can use the 15FQ+ as a measure of the personality construct amongst Black professionals in South Africa.
Measuring instruments
The researchers used the standard 15FQ+, a self-report personality assessment instrument that comprised two hundred questions. Psytech International developed it in the United Kingdom (UK) to measure personality in industrial and organisational settings.
The instrument was not especially adapted for South African conditions. The questionnaire consists of single statement items that require responses on a 3-point Likert scale. The sixteen scales (primary personality factors) were developed using a construct-orientated approach (Hough & Paullin, 1994). A rational procedure scores items in each of the scales.
Research procedure
The respondents completed the 15FQ+ using answer sheets and pencils. Qualified test users, registered as psychometrists or psychologists with the Health Professions Council of South Africa, administered the test. They adhered to standardised procedures and testing conditions in all venues. Before they began the testing, they asked every respondent to complete consent forms. They then presented the questionnaire in booklet form. Participants had to choose from three options and record their responses in the corresponding spaces on their answer sheets. There was no time limit for this test, but the administrators told respondents how long it usually takes subjects to complete the test.
The aim of the study was not to evaluate whether the 15FQ+ can provide item parcel indicator variable measures for personality latent variables in a structural model. Instead, its aim was to evaluate the 15FQ+ psychometrically as a freestanding measure of personality. Therefore, the ideal approach would have been to fit a measurement model in which the individual items serve as indicator variables of the latent personality dimensions. The researchers would then have treated the individual 15FQ+ items as ordinal variables because of the nature of the three-point scale they used to capture the responses of the subjects (Jöreskog & Sörbom, 1996a; 1996b). Fitting a measurement model, in which each individual item serves as an indicator variable of the latent personality dimension, would have meant estimating 504 model parameters (192 factor loadings, 192 measurement error variances and 120 covariance terms). The sample of Black South African managers would not have allowed the researchers to fit the measurement model because the number of observations has, at least, to exceed the number of parameters that LISREL had to estimate (Jöreskog & Sörbom, 1996a; 1996b).
To avoid this problem, the researchers created two parcels of manifest variables (each containing six items) from each subscale by parcelling items that underlie each of the latent personality constructs. They parcelled the items by placing all the uneven-numbered items in parcel 1 and all the even-numbered items in parcel 2. The mean score each respondent obtained on the set of items the researchers allocated to each parcel was the item parcel score. The researchers treated the parcels scores as continuous indicators (Little, Cunningham, Shahar & Widaman, 2002).
Statistical analysis
Before developing the 32 item parcels, the researchers used item analysis to examine the assumption that the items that comprise each subscale of the 15FQ+ do reflect a common underlying latent variable. The developers of the 15FQ+ intended to construct essentially one-dimensional sets of items to reflect the variance in each of the sixteen latent personality traits that collectively comprise the personality domain. The items should function as stimulus sets to which subjects respond with behaviours that are relatively uncontaminated expressions primarily of a specific underlying first-order personality latent variable (although without negating the suppressor action effect).
However, high internal consistency reliability for each subscale, high item subscale total correlations, high squared multiple correlations when regressing items on linear composites of the remaining items that comprise the subscale and other favourable item statistics will not provide sufficient evidence that the common underlying latent variable is, in fact, a one-dimensional latent variable.
When the designers conceptualised the personality construct and designed the 15FQ+, the fundamental assumption was that each of the sixteen first-order personality factors was a one-dimensional latent variable. One needs to remember that this does not imply that each of the sixteen first-order personality dimensions is a narrow and very specific construct. Instead, each primary personality dimension represents a broader facet of personality that expresses itself in a wide array of specific behaviours.
Nevertheless, we expect each of the items that comprise each of the sixteen subscales of the 15FQ+ to load (albeit rather modestly) onto a single factor. None of the publications on the 15FQ or the 15FQ+ asserts that one can further subdivide the primary factors into more specific sub-factors. There is provision to fuse the sixteen primary factors into five global factors. However, there is no provision for splitting the primary factors into narrower and more specific sub-factors. There is provision for a suppressor action effect because of a random pattern of positive and negative loadings onto the remaining personality dimensions (Cattell et al., 1970; Gerbing & Tuley, 1991).
Consequently, the researchers performed unrestricted principal axis factor analysis, with varimax rotation, on each on the sixteen 15FQ+ subscales. Each represents a facet of the multi-dimensional personality construct to evaluate this assumption.
In addition, the exploratory factor analyses the researchers performed on the subscales would shed additional light (via the magnitude of the factor loadings) on the success with which each item represents the common core underlying the subscale of the items of which it is part.
The researchers chose principal axis factor analysis as the analysis technique instead of principal component analysis because the aim was to determine the number of underlying factors that they needed to assume to account for the observed covariance between the items that comprise each subscale.
They chose varimax rotation as the rotational technique rather than an oblique rotational technique because the expectation was that the dimensionality analyses would corroborate the assumption that the items that comprise each subscale of the 15FQ+ do reflect a single dominant common underlying latent variable. Therefore, they would not need to rotate the extracted solution. If more than one factor emerged, orthogonal rotation would allow for interpreting and reporting the results in more straightforward ways than oblique rotation would (Tabachnick & Fidell, 2001). However, it is possible that assuming orthogonal factors can be criticised as unrealistic6.
The 15FQ+ measurement model can be defined in terms of a set of measurement equations. See equation 1.

Where:
• X is 32 x 1 column vector of observable indicator (item parcel) scores
• ΛX is a 32 x 16 matrix of factor loadings
• ζ is a 1 x 16 column vector of first-order latent personality dimensions
• δ is a 32 x 1 column vector of unique or measurement error components that consists of the combined effects on X of systematic non-relevant influences and random measurement error (Jöreskog & Sörbom, 1993).
The researchers used a hypothesis testing, restricted and confirmatory factor analytic approach for the psychometric evaluation of the 15FQ+. Therefore, they made specific structural assumptions about the number of latent variables that underlie personality, the relationships between the latent variables and the specific pattern of the loadings of the indicator variables (Theron & Spangenberg, 2004).
The confirmatory factor analysis technique is a hypothesis-testing procedure designed to test hypotheses about the relationships between items and factors whose number and interpretation one specifies upfront (Skrondal & Rabe-Hesketh, 2004).
The order of the factor loading matrix ΛX (specifically the number of columns in lambda-X) and the pattern of freed and fixed factor loadings within the matrix reflect these assumptions primarily but not exclusively.
The researchers freed the factor loadings of each of the latent personality variables of the 15 FQ+ to estimate the item parcels that contain the items designed to reflect each of the sixteen personality factors. They fixed all the remaining elements of ΛX at zero loadings, thereby reflecting the assumption that each item parcel only reflects a single specific latent personality dimension.
The 15FQ+ assumes that the suppressor action (Cattell et al., 1970; Gerbing & Tuley, 1991) operates on the level of dimension scores. The assumption in this study is that the suppressor action also operates on the item parcel level. Because of the random pattern of small positive and negative loadings of subscale items onto non-target factors, the researchers assumed that calculating item parcel scores would cancel out the effect of these factors, thereby justifying the decision not to free all the elements of ΛX.
The researchers freed the off-diagonal elements of the symmetric 16 x 16 covariance matrix Φ (phi) for estimation. The 15FQ+ measurement model assumes that the primary personality factors correlate. The researchers defined the 16x16 variance-covariance matrix Θδ (theta-delta) as a diagonal matrix. This implies that the measurement error terms δi and δj do not correlate across the indicator variables (Jöreskog and Sörbom, 1993).
In specifying the model, the researchers did not specify the measurement scales of the latent variables by setting the factor loadings on the first observed variable to unity. In the case of a single-group analysis, Jöreskog and Sörbom (1993; 1998) recommend that one should rather standardise the latent variables instead of defining the origin and unit of the latent variable scales in terms of observable reference variables. The unit of measurement then becomes the standard deviation σi(ζ) (Jöreskog and Sörbom, 1993).
To determine the goodness-of-fit of the proposed measurement model, expressed as equation 1, the researchers used LISREL 8.54 (Du Toit & Du Toit, 2001) to test the null hypotheses of exact and close fit. They read the data into PRELIS to compute the covariance and asymptotic covariance matrices they needed because of the assumed continuous nature of the item parcels. They used maximum likelihood estimation to derive the model parameter estimates because the data satisfied the assumption of multivariate normality.
Results
Dimensionality analysis
The researchers used the Statistical Package for the Social Sciences (SPSS) 11.0 for Windows (2004) to perform a series of 16 exploratory factor analyses on the items that comprise the subscales of the 15FQ+.
Table 1 gives a summary of the results of the factor analyses. A more detailed account of the separate exploratory factor analyses the researchers performed on each subscale is available in Moyo (2009).
In the case of each of the 16 subscales the one-dimensionality assumption that the 12 items, which comprise each subscale, all reflect a single common underlying personality factor, were investigated. The SPSS exploratory factor analysis results suggested that one would need between three and five factors to explain the observed correlations between the items of the subscales.
The eigenvalue-greater-than-unity rule of thumb and the scree plot generally agreed about the number of factors that the researchers needed to extract. The results they obtained for each of the subscales are problematic, not so much because they needed more than one factor to account satisfactorily for the observed inter-item correlations, but because all 12 items do not show at least reasonably high loadings onto the first factor in the rotated factor solution.
The researchers need to make a comment about the suppressor action principle that underlies the construction of the instrument. One would expect that extracting a single dominant factor (albeit possibly with a relatively high percentage of large residual correlations) or extracting several factors from all items, would yield adequate loadings onto the first factor and a random scatter of low positive and negative loadings on the remaining factors.
The question arises whether these outcomes illustrate a meaningful fission of the various primary factors. To examine this possibility, the researchers examined the item loadings of the items on each of the extracted factors for each of the subscales. From the rotated factor matrices, no clear and interpretable pattern of loadings emerged to suggest a meaningful fission of the various primary factors. In addition, the manner in which the 15FQ+ interprets personality does not provide for a further breakdown of the primary personality factors into meaningful subfactors (Cattell et al., 1970; Psytech South Africa, 2004).
The objective of the subsequent confirmatory factor analysis was to evaluate the fit of the measurement model that reflects how organisations currently use the 15FQ+. The researchers did this by combining the items of each subscale into two linear composites or item parcels. To examine how well the 12 subscale items represent the single underlying factor the item parcels should represent, they instructed SPSS to extract a single factor for each subscale.
For each of the 16 subscales, the loadings of the 12 items onto a single extracted factor were generally low. Table 1 shows that only a small number of items in each subscale had loadings higher than 0.50 onto the single extracted factor (with the exception of subscale H). The single factor therefore explains less than 25% of the variance in most of the items in each subscale.
The researchers computed the residual correlations for the multi-factor and the one-factor solutions. Table 1 shows that the multi-factor solutions had relatively small percentages (0% - 21%) of non-redundant residuals with absolute values greater than 0.05. This suggests that the rotated factor solutions generally give very credible explanations for the observed inter-item correlation matrices. However, for the 1-factor solutions, large percentages (33% - 60%) of non-redundant residuals had absolute values greater than 0.05. This suggests that the forced factor solutions do not give credible explanations for the observed inter-item correlation matrices.
The results of the dimensionality analyses do not correspond to the results one would have expected if the design intention of the 15FQ+ had succeeded. The results of the dimensionality analyses suggest that, for each of the 16 subscales, the behavioural responses of Black South African managers to the set of subscale items is not primarily an expression of the specific first-order personality dimension the set of items should reflect. Instead, the items in each subset seem to reflect a collection of latent variables. The researchers achieved little success in establishing the identity of these latent variables. They could not isolate any convincing common theme related to the personality dimension of interest. This does not answer the question of what the extracted factors represent. The researchers have examined the possibility that they represent artefact factors that reflect differences in item statistics to some degree. They found no evidence of differential skewness on any of the subscales. However, there could be differences in other item statistics that might account for the extracted factors.
Another possibility that this study has not explored is that the factors may represent systematic differences in the wording of the items. Examples are whether the items contain idiomatic expressions or whether they contain positive or negative wording. A further possibility that the study has not explored is that the factors may represent salient characteristics of situations (Mischel, 2004) that moderate how the personality dimensions express themselves in behaviour.
Item analysis
To determine how well the items of each subscale represent the underlying factor the designers intended them to represent, the researchers calculated various descriptive item statistics. The purpose of calculating these item statistics is to detect poor items. These are items that do not discriminate between different states of the latent variable the designers intended them to reflect and items that do not, in conjunction with their subscale colleagues, reflect a common latent variable.
The researchers calculated classical measurement theory item statistics for each of the 15FQ+ subscales. The statistics include the item-total correlation, the squared multiple correlation, the change in subscale reliability when one deletes the item, the change in subscale variance if one deletes the item, the inter-item correlations, the item mean and the item standard deviation (Murphy & Davidshofer, 2005).
Table 2 gives a summary of the item analysis results for each of the 15 FQ+ subscales. A more detailed account of the separate item analyses the researchers performed on each subscale is available in Moyo (2009).
Table 2 gives a somewhat sombre psychometric picture because it shows that most subscales retained values for the coefficient of internal consistency lower than those reported for an sample of predominantly White South African managers and those reported for a sample of predominantly White South African professional and management development candidates (Psytech South Africa, 2004; Tyler, 2003).
Only two subscales (Factor G and Factor H) meet the benchmark reliability standard of 0.70. The reliability coefficients for two subscales (Factor I and Factor C) approach the 0.70 standard. However, one needs to acknowledge, in fairness, that personality measures generally tend to show lower coefficients of internal consistency (Smit, 1996).
Several items analysed in Table 2, although they were all meant to measure a specific designated factor, do not seem to respond in unison to systematic differences in a single underlying latent variable. The item statistics include the item-total correlations, the squared multiple correlations, the change in subscale reliability coefficients when one deletes the item, the change in subscale variance if one deletes the item, the inter-item correlations, the item means and the item standard deviations the researchers calculated for each of the 16 subscales. They all show somewhat incoherent sets of items.
The researchers consistently found low (and at times negative) item-total correlations, low squared multiple correlations and low (and at times negative) inter-item correlations for each of the subscales (Moyo, 2009). Substantial increases in the subscale Cronbach alphas (if the researchers were to delete subscale items), along with the small item-total correlation and squared multiple correlation values associated with these items, point to problematic items that do not reflect a common core.
When the researchers considered the basket of evidence the item statistics provided, they had to conclude that the 15FQ+ subscales generally show a worrisome lack of coherence in the set of items that should reflect a specific source trait. The available item statistic evidence suggests that numerous items do not successfully represent the underlying personality dimension the designers intended them to measure.
Measurement model fit
One could regard creating item parcels as contentious given the results the researchers obtained on the dimensionality and item analyses.
The item parcels are indicator variables of the latent variables. If the objective of the analysis was to evaluate the structural relations that exist between the latent personality dimensions, then it was critical to ensure that each item parcel gives a valid measure of the latent variable the designers intended it to represent. If it fails to do, it would prevent a valid and credible test of the hypothesised structural model (see the earlier argument about the validity of the deductive argument in terms of which one operationalises substantive hypotheses). In order to test the fit of a structural model, it is imperative to use the results of the dimensionality and item analyses to identify and remove inappropriate items to ensure that one combines only the items that validly reflect the latent variable of interest in a parcel.
However, the objective of the current research was not to test specific structural relations the researchers hypothesised to exist between specific latent variables. Instead, the objective was to evaluate the relationships that exist between the latent variables and indicators that the designers intended them to reflect. The ideal would have been to evaluate the success with which items represent the latent personality dimension the designers intended them to reflect by fitting the measurement model to the individual items as indicator variables.
This was not feasible in this study because the sample size was too small. Therefore, the researchers combined all the items into parcels. They then evaluated the success with which these sets of items represented the latent personality dimension the designers intended them to reflect. Therefore, one should not see creating item parcels as inappropriate given the results the researchers obtained on the dimensionality and item analyses. However, the researchers expected the confirmatory factor analysis to corroborate the findings they obtained from the dimensionality and item analyses.
In addition, one could argue that creating item parcels allowed the suppressor action to operate.
The suppressor action is a core design feature of the 15FQ+. It originates in the assumption that the items of the 15FQ+ reflect the whole personality. Each item should primarily reflect a specific personality dimension. However, the items also reflect, positively and negatively, the remaining personality dimensions, albeit to a lesser degree (Gerbing & Tuley, 1991).
When one fits the measurement model to the individual items as indicators, modelling the suppressor effect presents a more challenging and not yet fully resolved problem. However, when fitting the model to the items of a subscale combined into two parcels, the same affect that one assumes will operate when calculating the subscale scores should also operate when calculating the item parcels.
The default method one uses to estimate model parameters when fitting a measurement model to continuous data is maximum likelihood estimation. However, this method of parameter estimation assumes that the data follows a multivariate normal distribution (Mels, 2003). An inappropriate analysis of continuous non-normal variables in structural equation models can result in incorrect standard errors and chi-square estimates (Du Toit & Du Toit, 2001; Mels, 2003).
Consequently, the researchers evaluated the univariate and multivariate normality of the composite indicator variables using PRELIS (Jöreskog & Sörbom, 1996b). They had to reject the null hypothesis of univariate normality (p < 0.05) for 13 of the 32 composite indicator variables.
Table 3 gives the results of the test for multivariate normality. Somewhat surprisingly, despite the fact that the researchers had to reject the null hypothesis of univariate normality for 13 item parcels, they did not need to reject the null hypothesis of multivariate normality (p > 0.05).
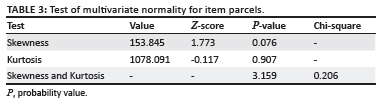
Because the assumption of multivariate normality holds, the researchers used maximum likelihood estimation (rather than robust maximum likelihood estimation) to estimate the freed measurement model parameter.
Table 4 gives the full spectrum of indices that LISREL provides to assess the absolute and comparative fit of the proposed measurement model. Bollen and Long (1993), Schumacker and Lomax (1996), Diamantopoulos and Siguaw (2000), Thompson and Daniel (1996) as well as Thompson (1997) argue that one should not give a conclusive verdict on the fit of a model using any single indicator of fit (or a favourable select few). Instead, one should make an integrative judgment by considering the full spectrum of fit indices that LISREL produces.
The normal theory weighted least squares Chi-square test statistic (410.24) is highly significant (p < 0.01). This led the researchers to reject the null hypothesis of the exact model fit (H01: RMSEA = 0). This implies that the first-order measurement model cannot reproduce the observed covariance matrix to a degree of accuracy explainable in terms of sampling error only.
The RMSEA indexes the discrepancy between the observed population covariance matrix and the estimated population covariance matrix that the model implies by degrees of freedom. Values below 0.05 generally indicate good model fit; values above 0.05 but less than 0.08 indicate reasonable fit; values greater than or equal to 0.08, but less than 0.1, indicate mediocre fit; and values that exceed 0.10 generally indicate poor fit (Brown & Cudeck, 1993; Diamantopoulos & Siguaw, 2000).
A value of zero shows the absence of any discrepancy. Therefore, it would show a perfect fit between the model and the data (Mulaik & Millsap, 2000). When one evaluates the RMSEA value of 0.028 against the interpretation convention outlined above, it shows that the measurement model has very good fit (Diamantopoulos & Siguaw, 2000).
The 90% confidence level for RMSEA, shown in Table 4 (0.02 - 0.04), shows that the fit of the structural model is good. In addition, because the upper bound of the confidence interval falls below the critical cut-off value of 0.05, it shows that the researchers would not reject the null hypothesis of close fit.
LISREL performs a formal test of close fit by testing H02: RMSEA < 0.05 against Ha2: RMSEA > 0.05. Table 4 shows that the conditional probability for the observed sample RMSEA value under H02 is sufficiently large (p > 0.05) for the researchers not to reject H02.
Whilst the non-centrality parameter (NCP) and the RMSEA both focus on error because of approximation, which is (the discrepancy between σ and σ(Θ), Byrne (1998) states that the expected cross-validation index (ECVI) focuses on overall error. Overall error is the difference between the reproduced sample covariance matrix (Sˆ), which one derives from fitting the model onto the sample at hand and the expected covariance matrix that one would obtain from an independent sample of the same size from the same population.
This means that the ECVI focuses on the difference between Sˆ and σ. Given its purpose, Diamantopoulos and Siguaw (2000) suggest that the ECVI is a useful indicator of a model's overall fit.
The model value for ECVI (3.24) is smaller than the value for the independent or null model (17.05) and the ECVI value associated with the saturated model (4.40). This finding suggests that one has a better chance of replicating the fitted model in a cross-validation sample than one has of replicating the more complex saturated model or the less complex independent model. Kelloway's suggestion (1998), that smaller values on this index indicate a more parsimonious fit, is the basis of this argument.
One can always improve the model fit by adding more paths to the model and estimating more parameters until one achieves a perfect fit as a saturated or just-identified model with no degrees of freedom.
The objective of building models is to achieve satisfactory fit with as few model parameters as possible. The objective is to find the most parsimonious model. PNFI (0.62) and PGFI (0.59), shown in Table 4, approaches model fit from this perspective. Davidson (2000) describes the PGFI as a modified goodness-of-fit index that takes into account the parsimony of the model. The closer this fit index is to 1.00, the better is the fit of the model (Davidson, 2000). Therefore, the values the researchers obtained on the PNFI and the PGFI suggest a less satisfactory model fit.
An assessment of the values of the AIC (778.24), presented in Table 4, suggests that the fitted measurement model provides a more parsimonious fit than the independent or null model (4091.04) and the saturated model (1056.00) do because smaller values on these indices indicate a more parsimonious model (Kelloway, 1998).
The values for CAIC (1603.44) also suggest that the fitted measurement model provides a more parsimonious fit than either the independent or null model (4243.56) or the saturated model (3423.97) do. For these two indices, small values suggest a parsimonious fit, although there is no consensus about precisely how small these values should be. This suggests, together with the ECVI results, that the fitted model does not provide an account of the process underlying the 15FQ+ that is too simplistic because it fails to model one or more influential paths.
The indices of comparative fit that LISREL reports, as shown in Table 4, suggest good model fit compared to that of the independent model. NFI (0.89), NNFI (0.97), CFI (0.98) and IFI (0.98) can all assume values between 0 and 1, whilst 0.90 generally indicates a model that fits well (Bentler & Bonnett, 1980; Kelloway, 1998).
Three of these four indices exceed the critical value of 0.90. Therefore, they show good comparative fit compared to the independent model. Diamantopoulos and Siguaw (2000) recommend that one should rely on the NNFI and CFI indices for assessing fit. If one placed more emphasis on these two indices, it would suggest that the model fits the data quite well.
RMR (0.0094), which represents the average value of the residual matrix (S-Sˆ), and the standardised RMR, which represents the fitted residual divided by its estimated standard error (0.051), indicate reasonable to good fit. Diamantopoulos and Siguaw (2000) state that values lower than 0.05 on the latter index suggest a model that fits the data well.
The goodness-of-fit index gives an indication of the relative amount of variances and covariances that the model explains (Diamantopoulos & Siguaw, 2000). The adjusted goodness-of-fit index and the parsimony goodness-of-fit index reflect the success with which the reproduced sample covariance matrix recovered the observed sample covariance matrix (Diamantopoulos & Siguaw, 2000). The AGFI adjusts the GFI for the degrees of freedom in the model whilst the PGFI makes an adjustment based on model complexity (Diamantopoulos & Siguaw, 2000; Jöreskog & Sörbom, 1993; Kelloway, 1998).
The two measures should be between zero and unity. One usually interprets values that exceed 0.90 as an indication of good fit to the data. Evaluating the fit of the model using these two indices (0.85 and 0.90) allows for a relatively favourable conclusion about model fit.
However, Kelloway (1998) warns that these guidelines for interpreting GFI and AGFI, which rely on experience, are somewhat arbitrary. Therefore, one should use them cautiously. Diamantopoulos and Siguaw (2000) argue that acceptable values for the PGFI tend to be more conservative, even when other indices indicate acceptable fit. Therefore, Diamantopoulos and Siguaw (2000) suggest that, of the three indices discussed above, the GFI is the most reliable measure of absolute fit in most circumstances.
The integrated results the researchers obtained from the full spectrum of fit statistics suggest a good to reasonable fitting model that clearly outperforms the independent model. In addition, the results seem to suggest that the fitted model does not provide an account that is too simplistic of the processes that underlie the 15FQ+ in the sense that it fails to model one or more influential paths.
The distribution of the standardised residuals is slightly negatively skewed (Moyo, 2009). Large standardised residuals would show covariance (or the lack thereof) between indicator variables that the model fails to explain. One could regard standardised residuals, with absolute values that are greater than 2.58, as large at a significance level of 1% (Diamantopoulos & Siguaw, 2000).
The fitted measurement model resulted in eight large negative residuals and twelve large positive residuals. A large positive residual suggests that the model underestimates the covariance between the two observed variables. Therefore, adding paths to the model that could account for the covariance should rectify the problem.
Conversely, a large negative residual suggests that the model overestimates the covariance between two specific observed variables. The remedy lies in eliminating the paths that are associated with the indicator variables in question (Diamantopoulos & Siguaw, 2000; Kelloway, 1998).
However, the existence of the twelve large positive and eight large negative residuals means that the derived model parameter estimates 20 of the 496 observed covariance terms in the sample covariance matrix (4%) poorly. The small percentage of large residuals would again suggest reasonable to good model fit. If the researchers had found no large standardised residuals, it would have indicated good model fit. In addition, the rather slight deviation from the 45º reference line in the Q-plot suggests reasonable to good model fit (Moyo, 2009).
The desire to improve the fit of the measurement model did not motivate the researchers to examine the modification indices. Instead, they wanted to evaluate the fit of the model further. If one cannot improve the fit of the current model, with the constraints that fixing specific model parameters at zero impose, by freeing any of the currently fixed parameters, it reflects positively on the merits of the model. On the other hand, numerous additional currently fixed model parameters, which would improve the fit of the model significantly if freed, would raise questions about the credibility of the current model.
The modification indices that LISREL calculates estimate the decrease that one should find in the χ2 statistic if one frees the currently fixed parameters and estimates the model again. Large modification index values (Chi-square values that exceed 6.6349) indicate parameters which, if set free, would improve the fit of the model significantly (p < 0.01).
Examination of the modification indices the researchers calculated for the factor-loading matrix (ΛX) yields 24 additional paths that would significantly improve the fit of the 15FQ+ measurement model. Therefore, only 24 of 480 (32 x 16 elements in ΛX minus 32 freed factor loadings) factor loadings currently fixed at zero (5%) would, if freed, result in a significant improvement in model fit (p < 0.01).
It is worth noting that all the significant modification index values the researchers calculated for the factor-loading matrix involve the item parcels that contain items from the Openness to Change (Q1), Self-reliance (Q2) and Perfectionism (Q3) subscales. More specifically, the modification indices suggest that the two Q3 item parcels also serve as indicators of factors B, C, E, H, L, M and O. The two Q2 item parcels also reflect factors F and N. The two Q1 item parcels also reflect factors H, L and Q2. The small percentage of significant modification index values in the factor loading matrix (p < 0.01) comment favourably on the fit of the 15FQ+ measurement model.
Examination of the modification indices the researchers calculated for the variance-covariance matrix (Θδ ) indicate six covariance paths (of the (32 x 31) ÷2 = 496 covariance terms currently fixed at zero) that would significantly improve the fit of the 15FQ+ measurement model if one relaxed the current assumption of uncorrelated measurement error terms. The small percentage (1.2%) of significant modification index values (p < 0.01) in the variance-covariance matrix (Θδ ) comments favourably on the fit of the 15FQ+ measurement model.
In addition, the findings on adding one or more paths corroborate the inferences derived from the values of ECVI, CAIC and AIC discussed above. The small percentage of significant modification index values (p < 0.01) in the factor loading matrix and, to a smaller extent, the small percentage of significant modification index values (p < 0.01) in the variance-covariance matrix (Θδ ) provides some support for the argument that creating item parcels allows the suppressor action to operate to some extent.
The researchers used the completely standardised factor loading matrix (ΛX), shown in Table 5 and which reflects the regression of the item parcels Xj on the latent personality dimensions ζi, to evaluate the significance and the magnitude of the first-order factor loadings the proposed measurement model hypothesised (see Equation 1). An evaluation of the results shown in Table 5 indicates that all the freed first-order factor loadings are significant (p < 0.05).
Therefore, one can reject all 32 null hypotheses (H0i: λjk = 0; i = 3, 4, ..., 34; j = 1, 2, ..., 32; k = 1, 2, ..., 16) in favour of Hai: λjk≠0; i = 3, 4, ..., 34; j = 1, 2, ..., 32; k = 1, 2, ..., 16. Therefore, the fit of the model would deteriorate significantly if one eliminated any of the existing paths in the measurement model by fixing the corresponding parameters in ΛX at zero. This would effectively eliminate the subset of items in question from the subscale that currently includes them.
Therefore, none of the existing paths in the model is redundant. All statistically significantly item parcels (p < 0.05) reflect the latent personality dimension the designers intended it to measure.
Although the item parcels significantly reflect the latent personality dimension the designers expected them to represent, the factor-loading matrix has problems. Most of the loadings are quite low, indicating that the item parcels generally do not represent the relevant latent personality dimensions very well. This, in turn, suggests that at least some of the items that comprise each item parcel generally do not represent the relevant latent personality dimensions very well.
This inference is consistent with the conclusion derived from the dimensionality and item analyses reported earlier. The completely standardised Λ parameter estimates reflect the average change in standard deviation units in a manifest variable X that result directly from a one standard deviation change in a first-order exogenous latent variable ζ to which the researchers linked it. It keeps the effect of all other latent variables constant.
The results presented in Table 5 lead to the conclusion that all the indicator variables generally load weakly to moderately onto the first-order factors to which the researchers assigned them. Therefore, the sensitivity with which the indicator variables respond to changes in the latent variables they represent is reasonably poor. One will not be able to detect relatively small changes in the latent variables in a corresponding change in the indicator variable. On the other hand, one would expect somewhat lower factor loadings because of the broad nature of the personality dimensions and because the whole personality determines responses to the items.
The squared multiple correlations for the observed indicator variables values, reported in Table 6, corroborate the finding that the indicator variables generally do not reflect the latent variables very well. Table 6 reports the proportion of the item parcel variance that the latent variable explains. It shows that the latent personality dimension the developers designed it to reflect, in terms of the measurement model (Eqn 1), explains only a modest proportion of the item parcel variance.
One can break the total variance in the ith item parcel (Xi) down into variance because of variance in the latent variable the item set should reflect (ζi); variance because of variance in the other systematic latent effects the item parcel should not reflect; and variance because of random measurement error. Equation 1, through the measurement term (δi), acknowledges the latter two sources of variance in the item parcels.
Table 7 gives the measurement error variances for the item parcels.
Therefore, the measurement error term δ does not differentiate between systematic and random sources of error or non-relevant variance. The values in Table 7 reiterate the conclusion derived from Table 5 and Table 6. The items of the 15FQ+ are relatively noisy measures of the latent personality dimensions the developers designed them to reflect. This inference also dovetails with the conclusions derived from the item and dimensionality analyses the researchers performed on each subscale. When the researchers combined the results on the items of the subscales of the 15FQ+, it shows that they generally provide relatively contaminated reflections of their designated latent personality dimensions.
Table 8 gives the phi-matrix of correlation between the 16 latent personality dimensions.
The off-diagonal elements of the Φ-matrix are the inter-personality dimension correlations disattenuated for measurement error. Not all correlations are significant (p < 0.05). The correlations between the latent personality dimensions vary from low to moderate in magnitude. One should regard this as a positive result because it supports the discriminant validity of the 16 first-order personality dimensions the 15FQ+ assumes.
Statistical power analysis
The researchers did not reject the close fit null hypothesis. Therefore, one could assume that the observed population covariance matrix (Σ) approximates closely the reproduced population covariance (Σˆ) matrix derived from the model parameters. The concern that arises is whether this result is because of a lack of statistical power or whether it reflects the true state of affairs. This concern increases as sample size decreases. If the decision not to reject the null hypothesis of close fit results under conditions of low power, it causes ambiguity because it is not clear whether the decision was because of the accuracy of the model or the insensitivity of the test to detect specification errors in the model. Statistical power refers to the conditional probability of rejecting the null hypothesis given that it is false (P [reject H0: RMSEA < 0.05)|H0 false]). In the context of structural equation modelling (SEM), the close fit null hypothesis states that the proposed model approximates closely the process that is really operating. In the context of SEM, statistical power therefore refers to the probability of rejecting an incorrect model. The decision not to reject H02: RMSEA < 0.05 would provide convincing evidence of the merit of the model, to the extent that the statistical power of the test for close fit would be high.
Therefore, the researchers estimated the power associated with the test of close fit. To determine the power of a test of the close fit hypothesis, one needs to assume a specific value for the parameter under Ha2 because there are as many power estimates as there are possible values for the parameter in terms of Ha2. A value that makes good sense to use in this instance is RMSEA = 0.08, because RMSEA = 0.08 is the upper limit of reasonable fit. In this specific analysis, the researchers also considered two additional possible values for RMSEA under Ha2: 0.70 and 0.60.
With the information about H02 and Ha2, a significance level (α) of 0.05 and a sample size of N, the power of the test becomes a function of the degrees of freedom (ν) in the model (v = ½[(p][p + 1] -t) = 528 - 184 = 3447). With everything else being equal, the more degrees of freedom, the greater will be the power of the test (Diamantopoulos & Siguaw, 2000).
The power tables that MacCallum, Browne, and Sugawara (1996) compiled provide only for degrees of freedom less than 100 and N < 500. Consequently, the researchers used a SPSS conversion of the SAS syntax that MacCallum et al. (1996) provided to derive power estimates for the tests of close fit given the effect size assumed above, a significance level (α) of 0.05 and a sample size of 241. Table 9 gives the results of the power analysis.
Table 9 shows that the probability of rejecting the null hypothesis of close fit under the true condition of mediocre fit (RMSEA = 0.80) is unity. If the model fit in the population were mediocre, the researchers would have rejected H02. However, they did not. Therefore, true model fit must be better than mediocre.
Table 9 shows that the probability of rejecting the null hypothesis of close fit is 0.998157 if the value of RMSEA, in terms of Ha2, is 0.70. If one assumed that the true model fit in the population were RMSEA = 0.60, the power of the test of close fit would be 0.716736. These power estimates, taken in conjunction with the decision not to reject the null hypotheses of close fit, suggest that one should regard the conclusion of close model fit as highly credible in that the test was very sensitive to misspecifications in the model.
Discussion
The 15FQ+ (Psytech International, 2000) is a prominent personality questionnaire that organisations frequently use, amongst others, for personnel selection in South Africa. For organisations to use the 15FQ+ for personnel selection in South Africa confidently requires that:
• there is a convincing argument why and how personality (as the 15FQ+ interprets it) is related to job performance
• a structural model derived from the argument fits the empirical data (i.e. there is support for the performance hypothesis)
• there is evidence that the predictor and criterion constructs are valid and measured reliably in the various sub-groups that comprise the applicant groups in South Africa
• there is evidence that membership of race and gender groups does not affect how the predictor and criterion constructs express themselves in observed measures
• there is evidence that the nature of the relationship between the predictor and criterion measures do not differ between racial and gender groups.
The objective of this article is to contribute to the available psychometric evidence on the third point mentioned above.
Previous research (Psytech South Africa, 2004; Tyler, 2002, 2003) has explored the psychometric properties of the 15FQ+ in various settings inside and outside of South Africa on inclusive groups. To-date, there are no known studies on an exclusively Black South African sample of managers. Nevertheless, organisations use the instrument regularly to assess personality amongst Black South Africans. Consequently, it is necessary to investigate the validity of this instrument as a measure of personality in this group in South Africa.
The substantive hypothesis this study tested is that the 15FQ+ provides a valid and reliable measure of personality, as the instrument defines it, amongst Black South African managers. In operational terms, the hypothesis is that:
• the measurement model, which the scoring key of the 15FQ+ implies, can closely reproduce the observed covariances between the item parcels formed from the items that comprise each of the subscales
• the factor loadings of the item parcels onto their designated latent personality dimensions are significant and large
• the measurement error variances associated with each parcel are small
• the latent personality dimensions explain large proportions of the variance in the item parcels that represent them
• the latent personality dimensions correlate low to moderately with each other.
All the 16 subscales failed the one-dimensionality test. The researchers had to extract more than one factor from all sixteen subscales to give a satisfactory explanation of the observed correlation matrix.
The result the researchers obtained for the various subscales are problematic because more than one factor is required to account satisfactorily for the observed inter-item correlations and because all twelve items of each subscale do not show at least reasonably high loadings on the first factor.
In terms of the suppressor action principle that underlies the construction of the instrument, one would assume that one needed to extract a single factor or several factors. In the latter case, all items would have to show adequate loadings onto the first factor and a random scatter of low positive and low negative loadings onto all the remaining factors. Extracting a single factor resulted in an unsatisfactory explanation of the observed correlation matrix in the case of all sixteen subscales. In the case of all sixteen subscales, most items had loadings of lower than 0.50 when the researchers forced the extraction of a single underlying factor.
One possibility is that a fission of the primary factors occurred. However, the researchers could not establish a meaningful identity for the extracted factors. There was no clear and common theme in the items that loaded onto the extracted factors. This makes it unlikely that one could explain the failure of the one-dimensionality test on the sixteen subscales by splitting the primary factors (source traits) into narrower sub-factors.
In addition, the theoretical basis of the 15FQ+, with regard to the primary source traits as the fundamental building blocks of personality, does not provide for a finer dissection of personality. The test construction principle of suppressor action suggests that several factors should emerge. The factor structure that should emerge is one in which all 12 subscale items load onto a single factor with a random pattern of small positive and negative loadings onto the remaining factors. However, the researchers did not find this factor structure.
The results of the descriptive item statistics suggest that the items of each subscale are more heterogeneous than one would expect even when one considers the suppressor action design principle. The items that comprise each subscale do not seem to operate as stimulus sets to which respondents react with behaviour that is primarily an expression of a specific underlying primary personality factor.
The relatively low values of the subscale coefficient alphas reinforce this concern. Thirteen of the sixteen subscales (81.25%) showed a coefficient alpha slightly greater than 0.50 but below the generally accepted Cronbach alpha of 0.70. Only two scales (12.5%) showed acceptable coefficient alpha values slightly above 0.70. One should also keep in mind Nunnally's (1978) critical stance on the rather liberal cut-off value of 0.70 for evaluating the reliability of measures one uses in an applied setting.
One could also suggest various possible diagnostic hypotheses in an attempt to explain the relatively low reliabilities. Lack of English proficiency is one. An inability to understand the instrument's items will negatively affect the reliability of the subscales. However, one should not criticise the instrument for this as much as one should question the test user.
The 15FQ+ has a Eurocentric origin. Therefore, items contain Eurocentric behavioural expressions of the various first-order personality factors. However, personality might express itself differently in another cultural group8. Therefore, the possibility that the behavioural denotations of the various first-order personality dimensions differ across racial and cultural groups is another hypothesis. A more subtle variation of this hypothesis is also possible. It could be that different situational cues regulate the nature of the behavioural expression of personality across racial and cultural groups.
The current study, together with those of Meiring et al. (2005) and Meiring et al. (2006) highlights the problem but does not really assist in diagnosing the problem. Too little attention has been devoted to diagnosis in the past. A prerequisite to solving the problem is to find an accurate reason for the low reliabilities of existing personality measures with a Eurocentric origin for Black respondents. Embarking on initiatives to develop new endemic personality measures, in the absence of an accurate diagnosis of the problem, seems to have a poor prognosis of succeeding.
When assessing the model fit, the results the researchers obtained show that the model's overall fit is acceptable. This conclusion used the findings that follow:
• the researchers did not reject null hypothesis of close fit
• the basket of fit indices that LISREL reported show close to reasonable fit
• a small percentage of the standardised covariance residuals are large
• a small percentage of the modification indices the researchers calculated for the ΛX and Θδ matrices are large.
The measurement model fits the data closely. This means that the specific measurement model provides a plausible description of the psychological process that underlies the 15FQ+. More specifically, it means that the measurement model provides a plausible account of the process that generated the observed covariance matrix because one could satisfactorily explain the pattern of inter-correlations (or covariances) the researchers observed between the combinations of items by using the measurement model.
However, because the model could closely reproduce the observed covariance matrix does not mean that the process that the model portrays is the one that determines the responses of the subject to the test items. It simply means that the process is one possible process that could have produced the observed covariance matrix. Furthermore, the close measurement model fit does not necessarily mean that the 15FQ+ successfully measures the personality construct it intends to. The degree of success it achieved in measuring the personality construct lies in the significance and magnitude of the freed measurement model parameter estimates. The good fit essentially means that the measurement model parameter estimates are credible.
The measurement model parameter estimates give reason for concern. The factor loadings, although significant, tend to be rather moderate, the measurement error variances are uncomfortably large and the proportion of variance that the latent variables explain in the linear item composites is disappointingly low. Therefore, the 15FQ+ seems to provide a noisy measure of personality amongst Black South African managers. It has moderate reliability and validity.
Therefore, the results of the confirmatory factor analysis suggest that the claim the 15FQ+ makes is tenable. This is that the specific items included in each subscale reflect one of the 16 specific latent personality dimensions that collectively comprise the personality domain as the 15FQ+ interprets it. In addition, the results of the confirmatory factor analysis are consistent with the assumption that a suppressor effect operates to cancel out the effect of other personality dimensions.
The measurement model in which the researchers linked specific items - combined in parcels - to specific first-order personality factors but not to others, succeeded in reproducing a covariance matrix that closely approximates the observed covariance matrix. In that sense, the model provides a plausible account of the nature of the construct that the instrument measures and how the instrument measures it.
The magnitude of the estimated model parameters suggests that the items generally do not reflect the latent personality dimensions the designers intended them to with a great degree of success. The items are reasonably noisy measures of the latent variables they represent. A sizable proportion of the variance in the items of each subscale is because of measurement error. The results the researchers obtained in the item analysis and the dimensionality analysis also reflect this.
However, one should remember that personality measures generally seem to be prone to the problem that the reliability of the item measures are somewhat lower than those one usually finds in cognitive ability and aptitude tests (Roodt, 2009; Smit, 1996). One also needs to remember that the personality dimension tests measure are broad constructs and that each item, designed to reflect a specific personality dimension, reflects the other dimensions of personality in varying degrees (Gerbing & Tuley, 1991).
Conclusions, recommendations and limitations
The results the researchers obtained in this study do give some reason for concern about using the 15FQ+ for assessing personality in Black South African managers.
The present study suggests that most of the 15FQ+ items do not measure the personality dimension they purport to measure in Black South African managers satisfactorily. To authenticate this view, we need more research on larger and more representative samples of the population of Black South African managers.
Given the current results, one is bound to conclude that one should use this instrument with caution on Black South African managers and in conjunction with other assessment instruments to cross-validate inferences derived from the 15FQ+, as has been best practice in assessment in general.
The current results echo the results that Tyler (2002; 2003) obtained in Asia on a sample that was different from his UK sample in several ways. His findings led Tyler to propose that the 15FQ+ should be adjusted to meet the characteristics of his sample. Possibly the same argument holds if organisations are to use this instrument in the South African multi-cultural industrial and organisational setting. Therefore, the researchers suggest that this measure should be customised to meet local conditions given the results of this study.
The size of the sample was satisfactory given the nature of the methodology the researchers used in this study (specifically the parcelling of items). However, the method of sampling prevents any claim that the sample is representative of Black South African managers. Consequently, the researchers cannot reach any definite conclusions about the construct validity of the 15FQ+ for this specific group. Before one can consider any structural changes to the 15FQ+, it is necessary to investigate the psychometric properties of the measure further with a larger and more representative black sample than the researchers used for this study.
The researchers fitted the measurement model by representing each of the latent personality dimensions using two item parcels. Given the objective of the research, which was to evaluate the 15FQ+ psychometrically as a measure of personality, it would have been better to fit the measurement model by using the individual items as indicator variables.
This was not possible in this study because of the size of the sample. A follow-up study should attempt to fit the measurement model using the individual items as indicator variables.
However, such a study would have to deal with the rather troublesome question of how to model satisfactorily the suppressor action that one presumes to originate from the fact that the items of a subscale also show a pattern of positive and negative loadings onto the other dimensions of the personality space.
To free all elements of the ΛX matrix unconditionally would not accurately model the design intentions of the test developers. To fix the loadings of items on non-target latent variables to some specific low values would also not model the hypothesised suppressor effect accurately. One possibility would be to constrain the loadings of items on non-target latent variables to a range of low values (like -0.25 to 0.25). However, it is not clear whether this is technically possible to achieve using LISREL. If this avenue turns out to be technically feasible, it would require one to estimate a large number of measurement model parameters with the concomitant implications for the size of the sample.
An important question that the researchers did not investigate in this study is whether the measurement model that underpins the 15FQ+ is similar with regard to the number of latent personality dimensions and model parameter estimates in Black and White South African managers. Therefore, two questions need answering. The first is whether the 15FQ+ measures the same personality construct in these two populations. The second is whether the manner in which the observed responses to items relate to the latent personality dimensions is the same.
One can answer the questions using a series of multi-group SEM analyses in which one fits the measurement model simultaneously to representative samples from the two populations initially, with all parameters freely estimated. One then fits the model simultaneously to representative samples from the two populations with gradually increasing constraints imposed on the equality of the model parameters. This raises another question of whether the model fit will deteriorate significantly if one imposes increasing equality constraints on the measurement model parameters. If it does not, it would imply measurement model invariance across the two populations (Bontempo & Mackinnson, 2006).
Two related research questions that arise in this regard are whether there is a universal personality construct and whether the manifestation of personality dimensions is universal across cultures.
Personality is an intellectual construct that people have created to assist them to think about their own behaviour, make sense of it and explain it. The personality construct that people in different cultures create might differ in the nature and number of personality dimensions that comprise the construct. However, whether these differences are interesting and relevant to industrial psychology is debatable. There is no doubt that this is an interesting and relevant question to a discipline like cross-cultural psychology.
Industrial psychology studies the behaviour (or work performance) of working people scientifically because this knowledge helps to improve employees' work performance in a way that serves the interests of organisations and society. From the perspective of industrial psychology, a more fruitful research theme to explore could be how the various latent personality dimensions affect the dimensions of task and contextual performance and how these relationships differ across cultures.
However, this still does not answer the question of which conceptualisation of personality would be the most fruitful to use if one assumes differences across cultures. In addition, when one measures the same personality construct, with the same constitutive definition, in different cultures, the question remains whether the behavioural manifestations of the personality dimensions are the same across cultures.
Of these two questions, the latter seems more relevant to industrial-organisational psychologists. In addition, the question of whether one can attribute the findings of this study to the fact that the current 15FQ+ items do not capture the most pertinent behavioural denotations of the various primary personality dimensions of Black South African managers remains.
Demonstrating that the 15FQ+ measures the personality construct in a sample of Black South African managers successfully, although necessary, is not enough to justify using the instrument for personnel selection from a diverse applicant pool in South Africa. It is also not enough to demonstrate that the measurement model that underpins the 15FQ+ is invariant in different racial groups.
In addition to demonstrating construct validity and measurement equivalence, one would also have to show that specific personality dimensions (like the second-order factors) significantly explain unique variance in a composite management competency measure. In addition, if group membership does explain variance in managerial success (as a main effect and/or in interaction with personality), and personality does not explain it, it should reflect in how one derives criterion inferences from the personality assessments.
Alternatively, one would have to show that correspondence to an ideal personality profile explains variance in a composite management competency measure significantly. If the manner in which profile similarity relates to managerial success is not the same in White and Black managers, one would have to acknowledge this difference formally in how one derives criterion inferences from profile scores.
These limitations are important and one must consider them. Nevertheless, this study does contribute to a better understanding of the psychometric properties of the 15FQ+on samples that differ from the UK samples on which the measure was originally developed.
Hopefully, the study will trigger the research we need to establish the psychometric credentials of the 15FQ+ convincingly as a valuable measure of personality in South Africa in different gender, race and ethnic groups. In the interim, organisations should use the instrument cautiously on Black South African managers.
Acknowledgements
The authors gratefully acknowledge the insightful and valuable comments and suggestions for improving the manuscript that an anonymous reviewer made. However, liability for the views the manuscript expresses remains that of the authors.
Authors' contributions
The authors contributed equally to this article.
Author competing interests
The authors declare that they have no financial or personal relationship(s) which may have inappropriately influenced them in writing this paper.
References
Babbie, E., & Mouton, J. (2001). The practice of social research. Cape Town: Oxford University Press. [ Links ]
Barrick, M.R., & Mount, M.K. (1991). The big five personality dimensions and job performance: a meta-analysis. Personnel Psychology, 44, 1-25. http://dx.doi.org/10.1111/j.1744-570.1991.tb00688.x [ Links ]
Bartram, D. (2005). The great eight competencies: A criterion-centric approach to validation. Journal of Applied Psychology, 90(6), 1185-1203. http://dx.doi.org/10.1037/0021-9010.90.6.1185, PMid:16316273 [ Links ]
Bentler, P.M., & Bonnet, D.G. (1980). Significance tests and goodness of fit in the analysis of co-variance structures. Psychological Bulletin, 88(3), 588-606. http://dx.doi.org/10.1037/0033-2909.88.3.588 [ Links ]
Binning, J.F., & Barrett, G.V. (1989). Validity of personnel decisions: a conceptual analysis of the inferential and evidential bases. Journal of Applied Psychology, 74(3), 478-494. http://dx.doi.org/10.1037/0021-9010.74.3.478 [ Links ]
Bollen, K.A., & Long, J.S. (1993). Testing structural equation models. Newbury Park: Sage Publications, Inc. [ Links ]
Bontempo, D.E., & Mackinnon, A. (2006, July). Measurement equivalence/invariance of the Developmental Behaviour Checklist: factorial invariance of categorical factor models. Paper presented at the 19th Biannual meeting of the International Society for the Study for Behavioural Development, Melbourne. [ Links ]
Borman, W.C., & Motowidlo, S.J. (1997). Task performance and contextual performance: The meaning of personnel selection research. Human Performance, 10(2), 99-110. http://dx.doi.org/10.1207/s15327043hup1002_3 [ Links ]
Borman, W.C., & Motowidlo, S.J. (1993). Expanding the criterion domain to include elements of contextual performance. In N. Schmitt & W.C. Borman (Eds.), Personnel Selection in Organisations, (pp. 71-98). San Francisco: Jossey Bass. [ Links ]
Browne, M.W., & Cudeck, R. (1993). Alternative ways of assessing model fit. In K. A. Bollen & J. S. Long (Eds.), Testing structural equation models, (pp. 136-162). Newbury Park, CA: Sage. [ Links ]
Byrne, B.M. (1998). Structural equation modelling with LISREL, PRELIS and SIMPLIS: Basic concepts, applications, and programming. New Jersey: Lawrence Erlbaum. [ Links ]
Byrne, B.M. (1989). A Primer of LISREL: basic applications and programming for confirmatory factor analytic models. New York: Springer Verlag. [ Links ]
Cattell, R.B., Eber, H.W., & Tatsuoka, M. (1970). Handbook of the Sixteen Personality Factor Questionnaire. Champaign, IL: Institute for Personality & Ability Testing. [ Links ]
Cilliers, P. (1998). Complexity and postmodernism. London: Routledge. [ Links ]
Copi, I.M., & Cohen, C. (1990). Introduction to logic. New York: Macmillan Publishing Company. [ Links ]
Davidson, M.C.G. (2000). Organisational climate and its influence upon performance: A study of Australian hotels in South East Queensland. Unpublished doctoral thesis, Griffith University, Brisbane, Australia. [ Links ]
Diamantopoulos, A., & Siguaw, J.A. (2000). Introducing LISREL. London: Sage Publications. [ Links ]
Du Toit, M., & Du Toit, S.H.C. (2001). Interactive LISREL: User's guide. Lincolnwood, IL: Scientific Software International. [ Links ]
Foxcroft, C., Roodt, G., & Abrahams, F. (2001). Psychological assessment: A brief retrospective overview. In C. Foxcroft & G. Roodt (Eds.), An Introduction to Psychological Assessment in the South African Context, (pp. 11-33). Cape Town: Oxford University Press. [ Links ]
Gatewood, R.B., & Feild, H.S. (1994). Human resource selection. (3rd edn.). Fort Worth, TX: Dryden Press. [ Links ]
Gerbing, D.W., & Tuley, M.R. (1991). The 16PF related to the five-factor model of personality: Multiple-indicator measurement versus a priori scales. Multivariate Behavioural Research, 26(2), 271-289. http://dx.doi.org/10.1207/s15327906mbr2602_5 [ Links ]
Ghiselli, E.E., Campbell, J.P., & Zedeck, S. (1981). Measurement theory for the behavioural sciences. San Francisco, CA: W.H. Freeman and Company. [ Links ]
Gliem, J.A., & Gliem, R.R. (2003, October). Calculating, interpreting, and reporting Cronbach's alpha reliability coefficient for Likert-type scales. Paper presented at the Midwest Research to Practice Conference in Adult, Continuing, and Community Education, Columbus: OH. [ Links ]
Grove, W.M., & Meehl, P.E. (1996). Comparative efficiency of informal (subjective, impressionistic) and formal (mechanical, algorithmic) prediction procedures: The clinical-statistical controversy. Psychology, Public Policy, and Law, 2, 293-323. http://dx.doi.org/10.1037/1076-8971.2.2.293 [ Links ]
Guion, R.M., & Gottier, R.F. (1965). Validity of personality measures in personnel selection. Personnel Psychology, 18, 135-164. [ Links ]
Guion, R.M. (1998). Assessment, measurement and prediction for personnel decisions. Mahwah, NJ: Lawrence Erlbaum Associates Publishers. http://dx.doi.org/10.1111/j.1744-6570.1965.tb00273.x [ Links ]
Hall, C.S., & Lindzey, G. (1957). Theories of personality. (2nd edn.). New York: Holt, Rinehart and Winston. http://dx.doi.org/10.1037/10910-000 [ Links ]
Hough, L., & Paullin, C. (1994). Construct-oriented scale construction: The rational approach. In G.S. Stokes, M.D. Mumford & W.A. Owens (Eds.), Bio-data handbook: Theory, research, and use of biographical information in selection and performance prediction, (pp. 109-145). Palo Alto, CA: Consulting Psychologists Press. [ Links ]
John, O.P., & Srivastava, S. (1999). The big five trait taxonomy: History, measurement and theoretical perspectives. In L.A. Pervin & O.P. John (Eds.), Handbook of Personality: Theory and Research, (pp. 102-138). New York: Guilford Press. [ Links ]
Jöreskog, K.G., & Sörbom, D. (1998). Structural equation modelling with SIMPLIS command language. Chicago, IL: Scientific Software International. [ Links ]
Jöreskog, K.G., & Sörbom, D. (1996a). LISREL 8: User's reference guide. Chicago, IL: Scientific Software International. [ Links ]
Jöreskog, K.G., & Sörbom, D. (1996b). LISREL 8: User's reference guide. Chicago, IL: Scientific Software International. [ Links ]
Jöreskog, K.G., & Sörbom, D. (1993). LISREL 8: structural equation modelling with the SIMPLIS Command Language. Chicago: Scientific Software International, Inc. [ Links ]
Kelloway, E.K. (1998). Using LISREL for structural equation modelling: a researcher's guide. Thousand Oaks, CA: Sage Publications. [ Links ]
Little, T.D., Cunningham, W.A., Shahar, G. & Widaman, K.F. (2002). To parcel or not to parcel: Exploring the question, weighing the merits. Structural Equation Modeling, 9(2), 151-173. http://dx.doi.org/10.1207/S15328007SEM0902_1 [ Links ]
MacCallum, R.C., Browne, M.W., & Sugawara, H.M. (1996). Power analysis and determination of sample size for covariance structure modelling. Psychological Methods, 1(2), 130-149. http://dx.doi.org/10.1037/1082-989X.1.2.130 [ Links ]
Meiring, D., Van de Vijver, A.J.R., & Rothmann, S. (2006). Bias in the adapted version of the 15FQ+ questionnaire in South Africa. South African Journal of Psychology, 36, 340-356. [ Links ]
Meiring, D., Van de Vijver, A.J.R., & Barrick, M.R. (2005). Construct item, and method bias of cognitive and personality measures in South Africa. SA Journal of Industrial Psychology/SA Tydskrif vir Bedryfsielkunde, 31(1), 1-8. [ Links ]
Mels, G. (2003). A workshop on structural equation modelling with LISREL 8.54 for Windows. Chicago, IL: Scientific Software International. [ Links ]
Mischel, W. (2004). Towards an integrative science of the person. Annual Review of Psychology, 55, 1-22. http://dx.doi.org/10.1146/annurev.psych.55.042902.130709 PMid:14744208 [ Links ]
Morgeson, F.P., Campion, M.A., Dipoye, R.L., Hollenbeck, J.R., Murphy, K., & Schmitt, N. (2007a). Reconsidering the use of personality tests in personnel selection contexts. Personnel Psychology, 60, 683-729. http://dx.doi.org/10.1111/j.1744- 6570.2007.00089.x, http://dx.doi.org/10.1111/j.1744-6570.2007.00100.x [ Links ]
Morgeson, F.P., Campion, M.A., Dipoye, R.L., Hollenbeck, J.R., Murphy, K., & Schmitt, N. (2007b). Are we getting fooled again? Coming to terms with limitations in the use of personality tests for personnel selection. Personnel Psychology, 60, 1029-1049. http://dx.doi.org/10.1111/j.1744-6570.2007.00100.x [ Links ]
Mount M.K., & Barrick, M.R. (1995). The Big Five personality dimensions: Implications for research and practice in human resource management. Research in Personnel and Human Resources Management, 13, 153-200. [ Links ]
Moyo, S. (2009). A preliminary factor analytic investigation into the first-order factor structure of the Fifteen Factor Questionnaire Plus on a sample of Black South African managers. Unpublished master's thesis. Stellenbosch University, Stellenbosch, South Africa. [ Links ]
Mulaik, S.A., & Millsap, R.E. (2000). Doing the four-step right. Structural Equation Modeling,7, 36-73. http://dx.doi.org/10.1207/S15328007SEM0701_02 [ Links ]
Murphy, K.R., & Davidshofer, C.O. (2005). Psychological testing: principles and applications. Englewood Cliffs, NJ: Prentice Hall. [ Links ]
Nunnally, J.C. (1978). Psychometric Theory. (2nd edn.). New York: McGraw-Hill. [ Links ]
Ones, D.S., Dilchert, S., Viswesvaran, C., & Judge, T.A. (2007). In support of personality assessment in organizational settings. Personnel Psychology, 60, 995-1027. http://dx.doi.org/10.1111/j.1744-6570.2007.00099.x [ Links ]
Popper, K.R. (1972). Conjectures and refutations: The growth of scientific knowledge. London: Routledge and Paul. [ Links ]
Psychometrics International. (2002). The 15FQ+ Technical Manual. Pulloxhill, Bedfordshire: Psychometrics Limited. [ Links ]
Psytech International. (2000). 15FQ+ Technical Manual. Pulloxhill, Bedfordshire: Psychometrics Limited. [ Links ]
Psytech South Africa. (2007). Instruments. Retrieved August 25, n.d., from http://www.psytech.co.za [ Links ]
Psytech South Africa. (2004). Instruments. Retrieved July 15, n.d, from http://www.psytech.co.za [ Links ]
Roodt, G. (2009). Reliability: basic concepts and measures. In C. Foxcroft & G. Roodt (Eds.), An Introduction to Psychological Assessment in the South African Context, (pp. 44-53). Cape Town: Oxford University Press. [ Links ]
Saville & Holdsworth. (2001). Competencies and performance@work. SHL Newsline, 6 May. [ Links ]
Saville & Holdsworth. (2000). Competency design: towards an integrated human resource management system. SHL Newsline, March, 7-8.Schmitt, N. (1989). Fairness in employment selection. In M. Smith & I. Robertson (Eds.), Advances in selection and assessment, (pp. 131-153). Chichester: John Wiley. [ Links ]
Schumacker, R.E., & Lomax, R.G. (1996). A beginner's guide to structural equation modeling. Mahaw, NJ: Lawrence Erlbaum Publishers. [ Links ]
Skrondal, A., & Rabe-Hesketh, S. (2004). Generalized latent variable modelling: Multilevel, longitudinal, and structural equation models. Boca Raton, FL: Chapman and Hall. http://dx.doi.org/10.1201/9780203489437 [ Links ]
Smit, G.J. (1996). Psigometrika: aspekte van toetsgebruik [Psychometrics: aspects of test usage]. Pretoria: HAUM Uitgewers. [ Links ]
SPSS 11 for Windows. (2004). SPSS Inc. Retrieved June 22, 2007, from http://www.spss.com [ Links ]
Tabachnick, B.G., & Fidell, L.S. (2001). Using multivariate statistics. (4th edn.). Boston, MA: Allyn and Bacon. [ Links ]
Tett, R.P., & Christiansen, N.D. (2007). Personality tests at the cross roads: a response to Morgeson, Campion, Dipoye, Hollenbeck, Murphy, and Schmitt (2007). Personnel Psychology, 60, 967-993. http://dx.doi.org/10.1111/j.1744-6570.2007.00098.x [ Links ]
Theron, C.C. (2007). Confessions, scapegoats and flying pigs: psychometric testing and the law. SA Journal of Industrial Psychology/SA Tydskrif vir Bedryfsielkunde, 33(1), 102-117. [ Links ]
Theron, C.C., & Spangenberg, H.H. (2004). Towards a comprehensive leadership-unit performance structural model: The development of second-order factors for the Leadership Behaviour Inventory (LBI). Management Dynamics, 14(1), 35-50. [ Links ]
Thompson, B. (1997). The importance of structure coefficients in structural equation modelling confirmatory factor analysis. Educational and Psychological Measurement, 57, 5-19. http://dx.doi.org/10.1177/0013164497057001001 [ Links ]
Thompson, B., & Daniel, L.G. (1996). Factor analytic evidence for the construct validity of scores: A history overview and some guidelines. Educational and Psychological Measurement, 56, 197-208. http://dx.doi.org/10.1177/0013164496056002001 [ Links ]
Tyler, G. (2003). A review of the 15FQ+ Personality Questionnaire. Selection and Development Review, 19, 7-11. [ Links ]
Tyler, G. (2002). A review of the 15FQ+ Personality Questionnaire. Pulloxhill, Bedfordshire: Psychometrics Limited. [ Links ]
Van Scotter, J.R., & Motowidlo, S.J. (1996). Interpersonal facilitation and dedication as separate facets of contextual performance. Journal of Applied Psychology, 81(5), 525-531. http://dx.doi.org/10.1037/0021-9010.81.5.525 [ Links ]
Vandenberg, R.J., & Lance, C.E. (2000). A review and synthesis of the measurement invariance literature: Suggestions, practices, and recommendations for organisational research. Organisational Research Methods, 3, 4-69. http://dx.doi.org/10.1177/109442810031002 [ Links ]
 Correspondence to:
Callie Theron
Postal address: Private bag X1
Matieland 7602
South Africa
Email: ccth@sun.ac.za
Received: 31 Aug. 2010
Accepted: 02 Aug. 2011
Published: 17 Oct. 2011
The authors gratefully acknowledge the insightful and valuable comments and suggestions for improving this manuscript that an anonymous reviewer made. However, liability for the views the manuscript expresses remains that of the authors.
1. One would normally not use the15FQ+ on its own but as part of a larger selection battery that measures a variety of person characteristics hypothesised as determinants of work performance.
2. The 15FQ+ is also frequently used for purposes other than selection. They include, amongst others, career guidance, career development, coaching and counselling. The researchers chose to justify the research objective in terms of the use of the instrument in selection. However, they could also have motivated the research objective in terms of any of the other uses of the instrument.
3. The term 'essentially one-dimensional' refers to a situation in which the items in a subscale all reflect a single underlying latent variable but display a random pattern of positive and negative loadings onto the 15 remaining personality dimensions.reflects, to a lesser degree, all of the remaining personality dimensions that comprise the personality domain with a pattern of small positive and negative loadings (Gerbing & Tuley, 1991).
4. The formation of item parcels is motivated and explained below.
5. In this study, these were item parcels as linear composites of individual items.
6. If extracting multiple factors was unlikely, one could argue that there should have been greater willingness to use a more complex and more realistic oblique rotational technique.
7. t is the number of parameters to be estimated in the fitted model and p the number of indicator variables.
8.The argument really requires a distinction between race and culture. However, space limitations preclude following up on this distinction. Differences in race could also signify differences in culture, but may not necessarily do so.


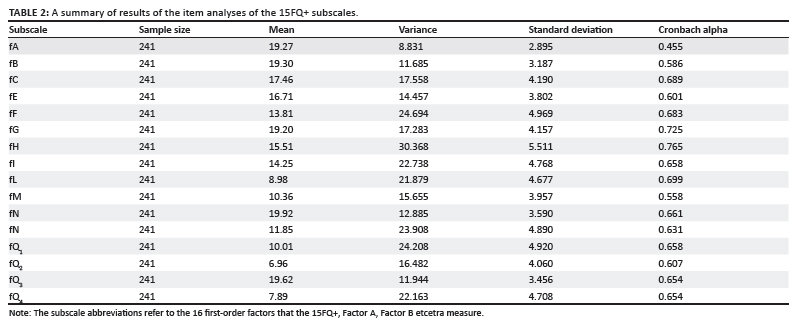
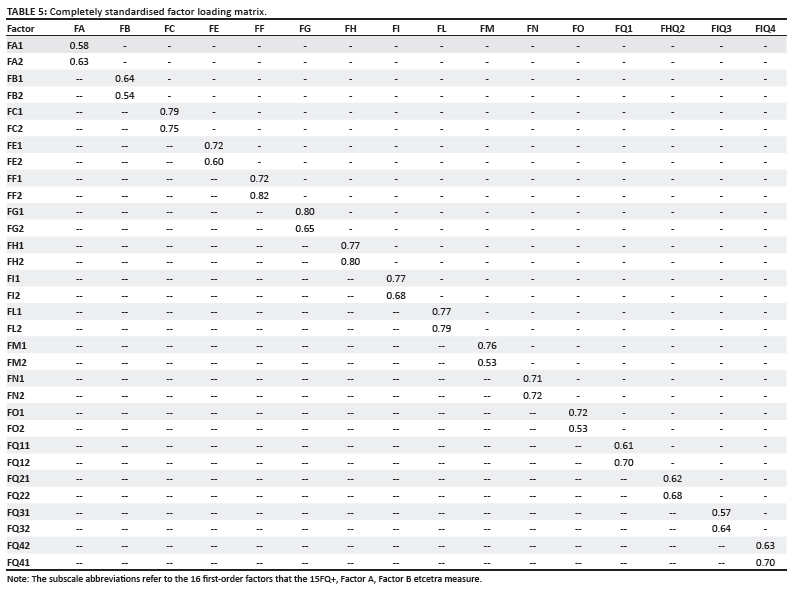
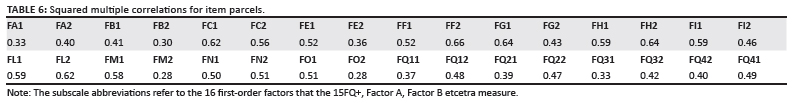
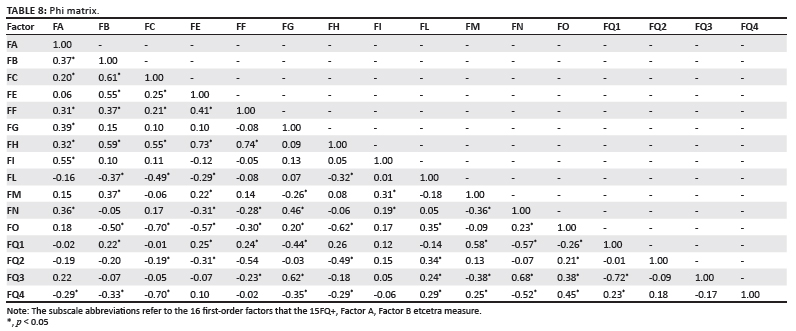
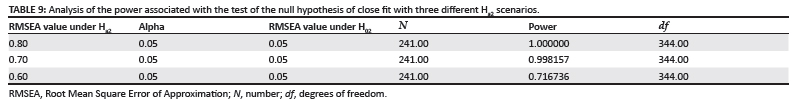