


Servicios Personalizados
Articulo
 Inglés (pdf)
 Articulo en XML
 Referencias del artículo
Indicadores

Links relacionados
-
 Citado por Google
 -
 Similares en Google
Compartir

 Permalink
SA Journal of Industrial Psychology
versión On-line ISSN 2071-0763
versión impresa ISSN 0258-5200
SA j. ind. Psychol. vol.37 no.1 Johannesburg ene. 2011
ORIGINAL RESEARCH
The differential item functioning and structural equivalence of a nonverbal cognitive ability test for five language groups
Pieter Schaap
Department of Human Resources Management, University of Pretoria, South Africa
ABSTRACT
ORIENTATION: For a number of years, eliminating a language component in testing by using nonverbal cognitive tests has been proposed as a possible solution to the effect of groups' languages (mother tongues or first languages) on test performance. This is particularly relevant in South Africa with its 11 official languages.
RESEARCH PURPOSE:The aim of the study was to determine the differential item functioning (DIF) and structural equivalence of a nonverbal cognitive ability test (the PiB/SpEEx Observance test [401]) for five South African language groups.
MOTIVATION FOR STUDY: Cultural and language group sensitive tests can lead to unfair discrimination and is a contentious workplace issue in South Africa today. Misconceptions about psychometric testing in industry can cause tests to lose credibility if industries do not use a scientifically sound test-by-test evaluation approach.
RESEARCH DESIGN, APPROACH AND METHOD: The researcher used a quasi-experimental design and factor analytic and logistic regression techniques to meet the research aims. The study used a convenience sample drawn from industry and an educational institution.
MAIN FINDINGS: The main findings of the study show structural equivalence of the test at a holistic level and nonsignificant DIF effect sizes for most of the comparisons that the researcher made.
PRACTICAL/MANAGERIAL IMPLICATIONS: This research shows that the PIB/SpEEx Observance Test (401) is not completely language insensitive. One should see it rather as a language-reduced test when people from different language groups need testing.
CONTRIBUTION/VALUE-ADD: The findings provide supporting evidence that nonverbal cognitive tests are plausible alternatives to verbal tests when one compares people from different language groups.
Introduction
Psychological theories that are valid in one cultural context do not necessarily yield good results in all other cultural contexts. Cultural bias would not be a problem if social researchers were completely free of culture or had a professional culture that is separate from any specific culture. However, it is often too easy for Western researchers to believe that their assumptions, concepts, findings and values - that Western culture colours - apply universally (Neuman, 2005). Research in a single culture seldom sheds light on the cultural limitations of theories and findings (Van de Vijver & Leung, 1997). Cross-cultural research can help to overcome claims of universality.
Since 1905, it has been clear that one can link the results of psychometric tests to class and/or culture. The fair testing of people from highly dissimilar backgrounds therefore poses a challenge for those who apply tests. Cultural diversity research has revealed differences, particularly between the values, attitudes and leadership styles of people from different cultural groups (Vorster, Olckers, Buys & Schaap, 2003). Cross-cultural studies suggest that linguistic proficiency, attitudes, motivation, values and other culture-specific factors all play an important role in differences between test response patterns that occur between groups (Schaap, 2003).
The cultural bias that is inherent in tests has increasingly become an area of investigation. The findings have strengthened the view that culture may amount to a source of systematic error in test results. Test scores often correlate with nontest variables like cultural factors, environmental factors, test-taking behaviour and other dispositional factors. Factors, like the testee's home language and level of education as well as the prior practice or testing experience of the person taking the test, in turn, often influence test-taking behaviour (Kendell, Verster & Von Mollendorf, 1988).
In recent years, increased recognition of the possibility that linguistic barriers may inhibit the test performance of minority groups has focused much more attention on language in psychological assessment (Gregory, 2004). The culture in which a test is developed links closely to the language in which it is developed. Language is usually the medium that expresses the cultural concepts and constructs that one needs to measure (McCrae, 2000). Therefore, the language used to develop a test has important consequences because of its link to cultural and cognitive processes. Culture and language influence cognitive processes. Consequently, they may affect a person's performance in cognitive tests (Schaap & Vermeulen, 2008).
South Africa has a diverse society. Its citizens believe that all South Africans are equally valuable and are entitled to equal and just treatment. The constitution (Republic of South Africa, 1996) endorses this belief. Therefore, it is imperative to search for equity, especially when one's education and position in a company are at stake. As a consequence, if language and culture are usually problematic in cross-cultural testing, overcoming this problem is particularly relevant in South Africa, with its 11 official languages, whenever one has to make valid cognitive ability comparisons between people.
A number of test developers tried to translate tests into various languages as a way out of equity problems related to culture and language (Bedell, Van Eeden & Van Staden, 2000; Claassen, 1990, 1996). Unfortunately, a range of practical problems emerged in the process of translation in South Africa. They arose from having to translate the test content into 11 equivalent language versions for all the official language groups in South Africa (Foxcroft, 1997). The first problem is the lack of available translators, particularly translators who have both language and psychological expertise. The second is the lack of equivalent vocabularies in all 11 languages. Other problems include the cost of translating and issues like the cultural equivalence of translations.
In addition, to the problems associated with the language the test itself uses, there is a limited pool of test administrators who can converse in the preferred language of a particular test candidate, particularly in mixed groups. Test administrators have also reported problems about the different dialects of the language the people speak in different geographic areas and a difference in performance between rural and urban people they test in their mother tongues (Bedell et al., 2000).
Psychologists now realise that many tests are not entirely appropriate for people whose mother tongue is not English and for those who are illiterate (Gregory, 2004). This realisation is especially applicable to South Africa because periodic surveys indicate unacceptably low levels of functional literacy amongst matriculants who do not have English or Afrikaans as their first language (Horne, 2002).
The use of nonverbal tests has been proposed as a solution to reducing the effects of language proficiency on the comparability of the test scores of different groups (Schaap & Vermeulen, 2008). According to Kline (cited in Schaap & Vermeulen, 2008), nonverbal items include:
• visual odd-man-out items
• pictures with errors which subjects have to recognise
• figure classification (in which subjects have to select the two figures of a series which belong together)
• embedded figures (where subjects have to recognise a shape embedded in other shapes)
• identifying the sequence of shapes in matrix format
• other variations of visual stimuli.
Examples of nonverbal tests include:
• the Test of Nonverbal Intelligence (TONI)
• Cattell's Culture Fair Intelligence Test (CFIT)
• Raven's Progressive Matrices (RPM)
• the Learning Potential Computer Adaptive Test (LPCAT) (De Beer, 2000)
• the Ability, Processing of Information and Learning Battery (APIL-B) tests (Taylor, 1997).
With regard to translating visual material into nonverbal test items, Biesheuvel (1949) cautions that making an object culturally meaningful has little value if the idea of visual representation itself is unfamiliar to testees or if it does not evoke an attitude of interpretation that European groups take for granted.
It is necessary to look at the ways subjects interpret images to decide whether visual images are effective and relevant. In other words, it is important to decide how subjects assign meaning to the images and the contextual factors that can play an important role in these interpretations or allocations of meaning (Weiss, 1999).
Visual literacy is a prerequisite for understanding visual images. According to Robinson (1992), visual literacy is the ability to process the elements of, and interpret, visual images, to understand and appreciate the content and purpose of images as well as their structural and aesthetic composition. Visually literate people can perceive, understand and interpret visual messages and can analyse and evaluate the visual communications they observe. Visual literacy is culture-bound because different cultures communicate using visual images (Robinson, 1992).
Cattell (1940) originally introduced the Culture Free Intelligence Test for testees with language or cultural deficiencies. It was intended as a culture-free measure of cognitive aptitude and consisted of nonverbal content. However, since its inception, several questions have been raised about the extent to which the test is indeed completely free of cultural content because even pictures can be culturally loaded. The test's name was later changed from the Culture Free Intelligence Test to the Culture Fair Intelligence Test (CFIT) to reflect this (Hoge, 1999).
Studies that researchers conducted in South Africa show that not all nonverbal test items are free of bias. De Beer (2004) conducted a study of the Learning Potential Computer Adaptive Test (LPCAT). The results showed that up to one third of nonverbal items in the LPCAT's original item bank had observable DIF. Most of the flagged items contain culturally based or language group based DIF. Consequently, these items were excluded from the LPCAT item bank.
One can argue that, although visual scales may not provide the ideal solution to overcome cultural differences in South Africa, they do go a long way toward reducing language barriers and, by implication, reducing the effects of cultural differences in cognitive test performance.
A test battery in South Africa that includes extensive visual test materials is the Potential Index Battery/Situation Specific Evaluation Expert (PIB/SpEEx) test battery that Potential Index Associates developed. The PIB/SpEEx consists of cognitive, social, emotional and conative tests. It measures various abilities, including cognitive ability in the workplace. Observance is one of the cognitive ability tests in the test battery.
According to Erasmus and Schaap (2007), the PIB/SpEEx Observance Test (401) uses visual images that consist of basic pictures, shapes and figures (like familiar pictures, squares, circles and triangles).
Observance is strongly associated with cognitive ability in general and mental alertness or intellectual acuity ('sharpness') in particular. More specifically, observance refers to the potential or capacity to pay attention, to understand, to be acute ('sharp'), to be mentally alert, to observe and to draw conclusions from what one has observed and to apply what one has observed constructively (Erasmus, 2002). The Collins Pocket Reference English dictionary (1990) defines observance as the potential or capacity to pay attention, to understand, to be quick to notice or to be alert.
In terms of Cattell-Horn and Carroll's theory of cognitive abilities (McGrew, 2005), the observance test can best be placed in the fluid intelligence and visual processing categories of Stratum II abilities.
Inductive and deductive reasoning typify fluid intelligence. It refers to 'mental operations that an individual may use when faced with a relatively novel task that cannot be performed automatically' (McGrew & Flanagan, 1998, p. 14). McGrew and Flanagan (1998) define visual processing as 'the ability to generate, perceive, analyse, synthesise, manipulate, transform, and think with visual patterns and stimuli' (p. 23).
The observance test particularly requires reasoning in terms of visual and figural stimuli. Visual stimuli require an understanding of the relationship between familiar pictures or common objects and identifying the odd-ones-out using concepts the testee develops. Reasoning, with regard to figural stimuli, requires an understanding of the relationship between familiar and novel figural or geometric stimuli and identifying the odd-ones-out based on concept formation, design, spatial relationship and logical sequences.
Therefore, the observance test assesses a narrow aspect of intelligence that requires general reasoning based on concept formation, visual-spatial processing and attentiveness to detail. Verbal mediation (where examinees think silently, but in words, whilst pondering the items) may be involved to some extent with the visual items. However, figural items are likely to involve less verbal mediation and reflect increased demands on abstract reasoning.
The visual stimuli the observance test uses are conceptually similar to the visual and geometric figures the Comprehensive Test of Nonverbal Intelligence (CTONI) uses, as Hammill, Pearson and Wiederholt (1997) describe, and, more specifically, the Odd-Item Out subtest of the Nonverbal Intelligence Index (NIX) of the Reynolds Intellectual Assessment Scales (RIAS), which Reynolds and Kamphaus (2003) discuss. According to Reynolds and Kamphaus (2003), the Odd-Item Out test is a form of reversed nonverbal analogy and measures general reasoning skills that emphasise nonverbal ability. The observance test is a one-dimensional nonverbal general reasoning measure that emphasises abstract reasoning.
The observance test was not designed for use as a stand alone measure of cognitive ability. It should therefore be part of a battery of complementary cognitive tests for selection and development (Erasmus, 2002).
The objective of this study is to determine the DIF and structural equivalence of the PIB/SpEEx Observance Test (401) for testees from five language groups. These are English, Afrikaans, IsiZulu, Northern Sotho and Setswana.
According to Van de Vijver (1998), DIF and equivalence are concepts that form the core of a framework that attempts to incorporate aspects that are specific to cross-cultural research.
Psychologists generally recognise that test fairness is a broad concept that includes the absence of bias, equitable treatment of examinees during the testing process, equitable outcomes for examinees from different groups and equitable opportunities to learn the content of a test (American Educational Research Association, American Psychological Association, National Council on Measurement in Education, 1999). Therefore, bias and equivalence research would specifically assist to establish whether assessment instruments are fair to particular language or cultural groups in terms of their psychometric properties.
The article explains the key terms 'equivalence', 'structural equivalence' and 'DIF' briefly. Historically, equivalence has become associated with the measurement level at which one can make cross-cultural comparisons. Equivalence refers to whether there is any difference in the measurement levels in comparisons within and between groups. If a measure shows bias against a particular cultural group, it does not measure individual differences within a cultural population and across cultural populations using the same scale (Van de Vijver, 1998).
One can analyse equivalence at various levels. Structural equivalence (also known as construct equivalence) indicates the extent to which one can replicate the factor structure (representing similar factor loadings on the items) across diverse cultural groups. Structural equivalence is important at the first level of analysis. Measurement unit equivalence (at the interval level) and scalar equivalence (at the ratio level) follow. Measurement unit equivalence uses the assumption that scores on the instrument have the same interval scales for each group. Scalar equivalence uses the assumption of similar offsets for the scale for each group (Van de Vijver, 1998).
After determining structural equivalence, one analyses the DIF. If one does not attend to the DIF, it can create a measurement problem that might jeopardise the validity of cross-cultural comparisons. An item shows DIF when testees from different cultural groups, with the same score on the underlying trait, do not share the same probability of getting the item correct. In other words, testees who are equally dominant (or whatever other trait the item is measuring), and who come from different groups, should have the same score on the item (Van de Vijver, 1998). In statistical terms, there would be DIF if the regression of the item on the latent ability differs in terms of intercept and/or slope. There could be uniform or nonuniform bias when intercepts differ or the slope differs for the different groups. Factors that could lead to DIF include poor item translations, inappropriate item content and inadequate item formulation (complex wording).
Research design
Research approach
Whenever researchers attempt to measure psychological characteristics, their goal should be to ensure that their measurements are as valid and reliable as possible (Brown, 1983). When researchers evaluate measuring methods, the question is not whether the method is good or bad in an absolute sense, but whether the measuring method results in more accurate and usable results than the researchers would obtain with other available methods (Brown, 1983).
It is clear from the literature that the contextual variable 'language group' (first language or mother tongue) can influence the reliability and validity of cognitive measurements. Language group, as a contextual variable, is a plausible explanation for the observed differences in test scores.
In this study, the researcher used a quasi-experimental research design to evaluate whether or not 'language group', as a context variable, can explain the score differences in the latent variable (the nonverbal PIB/SpEEx Observance test [401]), for which the researcher controlled. In the context of cross-cultural research, quasi-experimental methodology focuses on improving the interpretability of the differences in the focal variable (test scores) and reducing the number of alternative explanations. Choosing appropriate context variables to verify or falsify a particular interpretation is a substantive step towards improving the interpretability of differences and reducing alternative explanations (Van de Vijver & Leung, 1997).
Research method
The researcher discusses the research method he followed in this study under the subheadings 'research respondents', 'measuring instrument', 'research procedure' and 'statistical analysis'.
Research participant
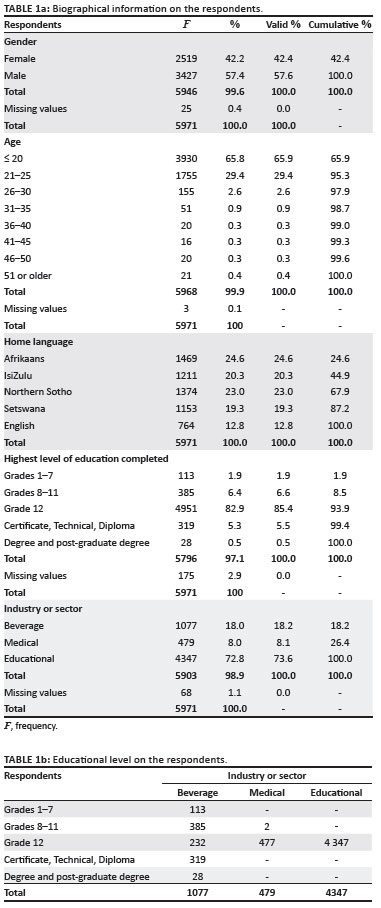
The sample in this study was situation-specific and is a nonprobability convenience sample. It consisted of 5971 respondents who came mainly from the beverage industry, the medical sector and the tertiary education sector.
Men comprised most of the sample (57.6%). Of the respondents, 42%were women. Only 0.4%of the respondents did not indicate their gender.
The mean age of the sample was 20. The youngest respondent was 17 and the oldest was 59.
The distribution of the language variable (respondents' first language) in the sample for the observance test was:
• 12.8% (764) English-speaking respondents
• 24.6% (1469) Afrikaans-speaking respondents
• 20.3% (1211) IsiZulu-speaking respondents
• 19.3% (1153) Setswana-speaking respondents
• 23% (1374) Northern Sotho-speaking respondents.
It is clear that Afrikaans speakers were the most numerous, followed by Northern Sotho speakers. English speakers were the least numerous.
With regard to level of qualification, 1.9% (113) of the sample fell into the Grades 1-7 category, 6.4% (385) of the sample fell into the Grades 8-11 category and 82.9% (4951) into the Grade 12 category. The Certificate, Technical, Diploma category comprised 5.5% (319) of the sample. The remaining 0.5% (28) of the sample had a degree or post-graduate degree. Only 2.9% of the respondents' qualifications were unknown. Most respondents (72.8%) came from a tertiary institution, 18% came from the beverage industry, and 8% from the medical industry. Only 1.1% of the respondents did not indicate their industry or sector.
The cross-tabulation section in Table 1 shows that the testees in the beverage industry group had a more even distribution in their levels of education, whilst the testees from the medical and education sectors were homogeneous in levels of education.
Measuring instrument
The PIB/SpEEx Observance Test (401) has 22 items. It has a time limit of eight minutes. Each respondent must recognise or observe the differences and similarities between five seemingly unrelated shapes, figures and pictures. This will demonstrate their ability to 'see' and 'understand' the relationships between visual items, to be 'sharp', or aware, and to find the odd ones out (Erasmus, 2002, 2007).
In an earlier study, Erasmus and Schaap (2003) assumed that the test is language free because it consists of visual items. Therefore, one can administer the test in any language. The objects involved in the observance test are very neutral and have no connection to culture. The nonverbal tests look at reasoning processes but use shapes and figures. Because these questions require no knowledge of English, or the numbering system, they are particularly useful when assessing people with poor English skills or disaffected people who may have failed to achieve in their academic work because they were unmotivated (Erasmus & Schaap, 2003).
Schaap obtained an overall alpha reliability coefficient of 0.76 for the PIB/SpEEx Observance Test (401) in a beverage company (Schaap, 2001). He also obtained an alpha reliability coefficient of 0.75 for the Black respondents and reported an alpha reliability coefficient of 0.56 for the White respondents. In a study by Kriel (2001) in an academic institution, the reliability of the PIB/SpEEx Observance Test (401) was 0.53. It is clear that the reliability of the PIB/SpEEx Observance Test (401) varies considerably between studies and across groups. Differences in score variances because of the homogeneity in the difficulty levels (high item p-values) of the test could account for this.
With regard to validity, research at an academic institution revealed that the PIB/SpEEx Observance Test (401) made a statistically significant contribution, in a regression model, for predicting the academic performance of students in courses in computer skills, analytical chemistry and microbiology (Kriel, 2002). A second study found that the PIB/SpEEx Observance Test (401) contributed at a statistically significant level toward predicting students' science performance in a postmatriculation bridging programme at a semi-government institution (Kriel, 2003). Theoretically, scholastic development should influence cognitive development and should consequently influence performance on the PIB/ SpEEx Observance Test (401). There is a two-way interaction between fluid ability and crystallised abilities. Educational exercises and experiences that, in turn, convert into fluid abilities form crystallised abilities directly (Lohman, 2005).
Schaap (2001) reports a statistically significant difference between the score variances of employees at lower scholastic levels (Grades 1-11) and the scores of employees at the matriculation and postmatriculation levels. He could not replicate his findings when he compared employees at matriculation and post-matriculation levels. This suggests that the test differentiates better at educational levels up to Grade 12.
Research procedure
The researcher collected data from the existing PIB/SpEEx database, which had previously been used for selection and development purposes in industry and tertiary institutions. The pencil-and-paper version of the PIB/SpEEx Observance Test (401) is part of a situation-specific battery of PIB/SpEEx tests. The researcher collected the data with the consent of the respondents under the supervision of registered psychologists.
The respondents, who completed the PIB/SpEEx tests at a tertiary institution, had applied to study there, whilst the respondents in the medical and beverage industries had applied for positions in a company or did the tests for development purposes.
The researcher preserved the confidentiality of the data and the anonymity of the responses by removing the respondents' identification details from the data basis.
Statistical analysis
The statistical analysis on the PIB/SpEEx Observance Test (401) used the data the researcher received from the 5971 respondents. He computed descriptive statistics of the data and performed reliability analyses, factor analyses and DIF analyses on the data using the SPSS (SPSS Inc., 2006) and the MicroFACT 2.0 (Waller, 1995) statistical program. The MicroFACT 2.0 statistical program allows for item level factor analysis using a tetrachoric correlation matrix.
The researcher calculated the descriptive statistics using the test scores of the language groups, industry sectors and the total sample in order to gain an understanding of the distribution of scores within and between groups. He calculated a reliability coefficient for each group because reliability coefficients provide helpful clues about the suitability of a test for cross-cultural comparison (Van de Vijver & Leung, 1997).
According to McDonald (1985) and Geisinger (2003), the most frequently applied technique for addressing structural equivalence is Exploratory Factor Analysis (EFA). Target rotations and computing an index of factorial agreements across cultural groups follow. Before evaluating whether the factors in different cultural groups agree, one should rotate the matrices of loadings in order to maximise their agreement.
However, targeted rotation is not necessary when one compares a one-dimensional construct and an unrotated factor matrix that consists of a single factor. When studying two cultural groups, one designates one group arbitrarily as the target group. One then rotates the factor loadings of the second group toward the target group where there are two or more factors. One can apply the same procedure when studying more than two groups. Here, one can load the factor loadings of the separate groups to one target group or to a joint common matrix of factor loadings (Van de Vijver & Leung, 1997).
In this study, the researcher compared the factor loadings of the separate groups to a joint common matrix of factor loadings and supplemented them with paired comparisons of the factor loadings of the different groups. The researcher conducted a Principal Axis Factor (PAF) analysis on the total sample group. The PAF analysis yielded a common matrix of factor loadings. The common matrix of factor loadings served as a target matrix for comparison. Thereafter, the researcher compared the factor loadings of each of the language groups to one target group (the total group) to determine the structural equivalence of the factor for the different language groups.
However, in these conditions, each group may influence the target matrix to a limited degree and this may cause inflated equivalence measures. Therefore, the researcher extended the analysis and allowed for paired comparisons between language groups. He used Tucker's congruence coefficient to determine the level of congruence, or factorial agreement, between factor structures as a measure of factor similarity and stability (Van de Vijver & Leung, 1997). Zegers and Ten Berge (1985) call it the coefficient of proportionality because the coefficient is insensitive to multiplications of the factor loadings but sensitive to any constant added to all loadings of a factor.
The researcher conducted a DIF analysis on the language groups using the PIB/SpEEx Observance Test (401), for language groups. DIF is present when the meanings or implications of a test score, which one subgroup of testees obtains, differ from the meanings or implications that this score has for other testees (Gregory, 2004). DIF can yield uniform and nonuniform DIF. Uniform DIF refers to the influence of bias on scores that are more or less the same for all the score levels. Nonuniform DIF refers to influences that are not identical for all the score levels (Van de Vijver & Leung, 1997).
One can use logistic regression for DIF analysis of cognitive instruments that yield dichotomous scores. Logistic regression is suitable when the dependent variable is a dichotomy and the independent variables are of any type (Neuman, 2005). In this study, the researcher used logistic regression to analyse DIF because it can detect both uniform and nonuniform DIF (Van de Vijver & Leung, 1997) in dichotomous items.
The researcher used the Chi-square statistic to evaluate the statistical significance of the uniform and nonuniform DIF. The overall Chi-square test is sensitive to sample size. Model violations that are trivial from a substantive point of view lead to a poor fit in larger samples (Bollen & Long, 1993).
In addition, researchers who are investigating DIF should account for the number of significance tests they conduct (Scott et al., 2010). Crane, Van Belle and Larson (2004) proposed using a Bonferroni approach (dividing the nominal statistical significance level, typically 0.05, by the number of tests). This strategy reduces Type 1 errors but is a very conservative approach. According to Scott et al. (2010), numerous DIF studies have used a 1% significance level instead. Therefore, the researcher adopted this significance level for the current study. However, it is important not to interpret the results of the statistical significance tests without referring to their practical significance (Scott et al., 2010).
Scott et al. (2010, p. 8) point out that 'there is currently no consensus regarding effect size classification systems for logistic regression DIF analyses, and there is a need for further investigation'. The effect size methods that were most widely reported are the Pseudo-R2 difference (Δ) and the odds ratio (log odds ratio) associated with the grouping variable. Bjorner, Kosinski and Ware (2003) have suggested an R2 Δ cut-off level of 0.02 and other studies (Martin, Blaisdell, Kwong & Bjorner, 2004; Dallmeijer et al., 2005) have used it. A number of studies have used a threshold of 0.64 in the log odds ratios for determining uniform DIF (Petersen et al., 2003; Scott et al., 2007; Stump, Monahan & McHorney, 2005).
In this study, the researcher adopted a log odds ratios threshold of 0.64 and a Pseudo-R2Δ threshold of 0.02. He used these effect sizes in conjunction with the Chi-square statistic (p < 0.01) to determine uniform DIF. He used the Chi-square statistic (p < 0.01) in conjunction with a Pseudo-R Δ threshold of 0.02 to determine nonuniform DIF (Scott et al., 2007; Stump et al., 2005).
The researcher computed the Nagelkerke R2 Δ effect size for the items using a three-step process. In the first step, he calculated the Nagelkerke R2 using the score level as the single predictor. In the second step, he added language as a predictor. The difference between the first and second step provided an estimate of the effect size of language (uniform DIF). In the third step, the researcher added the interaction between language and the score level. The difference between the second and the third step estimates the effect of the interaction or nonuniform DIF (Meiring, Van de Vijver, Rothmann & Barrick, 2005).
Results
Descriptive statistics
Table 2 shows the descriptive statiscs and Cronbach alpha (α) coefficients per group. The mean, or arithmetic average, is the most widely used measure of central tendency (Neuman, 2005). The standard deviation (SD) gives the 'average distance' between all scores and the mean (Neuman, 2005).
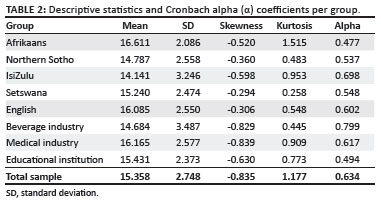
In this case, the mean of the sample was 15.358 and the SD was 2.748. The IsiZulu-speaking group had the lowest mean of 14.141 (SD = 3.2). The Afrikaans-speaking group had the highest mean of 16.611 (SD = 2.086). The differences in mean values were close to one standard deviation and have, according to Cohen (1988), practical and statistical significance (t [1984] = 22.875, p < 0.000). Overall, the difference in means between all five groups is statistically significant (F [4.5966] = 184.686; P < 0.000) and has moderate practical significance (Eta Squared = 0.110).
The researcher included the descriptive statistics for the main sample subgroups (the beverage industry, the medical sector and an educational institution) to allow for greater insight into the components of the main sample group. We can see noticeable variations in the descriptive statistics between the three sample subgroups. These, in turn, affected the psychometric properties of the whole sample and the language subgroups.
The beverage industry had the lowest mean of 14.684 (SD = 3.487) and the medical sector had the highest mean of 16.165 (SD = 2.577). The beverage industry, which is the least homogeneous in educational levels, had the highest score variance. Therefore, it made a significant contribution to the variability of scores in the total sample. The medical sector and educational subgroups were highly homogeneous in educational levels. Consequently, it restricted its score variance significantly compared to the score variance in the beverage industry. Score variance should have an effect on the statistical comparisons that the researcher needed to conduct to achieve the objectives of the study. Statistical tests of significance measure differences between groups.
Overall, the coefficient of skewness was negative and fell within the range of -0.294 and -0.839. Of the different language groups, the IsiZulu-speaking group had the highest coefficient of skewness of -0.598. The coefficient of kurtosis for the different groups fell between 0.258 and 1.515. The Afrikaans-speaking group had the highest kurtosis coefficient of 1.515 and had, by implication, the most homogenous test scores.
The alpha coefficient for the test for the total group was 0.634. The individual alpha scores for the different language groups fell between 0.477 and 0.698. The alpha coefficients for the main sample subgroups varied between 0.494 and 0.799. Higher score variance, because of the variance in the levels of education in the group, can account for the higher reliability coefficient (0.799) for the beverage industry.
How large an 'acceptable' reliability coefficient is depends largely on the purpose of the test and the requirements of the particular situation (Owen, 1996). The alpha coefficients the researcher found in this study are lower than the 0.8 to 0.95 level than one expects of cognitive measures in high-stake decision-making situations that involve individual scores, as Anastasi and Urbina (1997), Bland and Altman (1997) and Owen (1996) show.
However, reliability coefficients of 0.70 to 0.80 or higher for comparing groups are satisfactory in terms of the guidelines that Bland and Altman (1997) and Nunnally and Bernstein (1994) suggest. Indeed, according to Cohen (1988), α-values as low as 0.6 are quite common in the behavioural sciences when comparing groups (in this case, different language groups). The findings of Bosma et al. (1997), McKinley, MankuScott, Hastings, French and Baker (1997) and Meiring et al. (2005) support Cohen's claim that reliability coefficients of 0.6 or higher are satisfactory for group comparison studies.
Comparisons of the reliabilities of an instrument, with regard to different cultural groups, are preliminary tests for construct equivalence. Observing dissimilar reliability coefficients can yield valuable clues about the measurement accuracy and the appropriateness of an instrument for the purposes of crosscultural comparison (Van de Vijver & Leung, 1997).
In the current study, there were noticeable differences in the reliabilities of the PIB/SpEEx Observance test for the different language groups. The noticeable score and reliability differences between the groups raise questions about the construct equivalence and bias of the instrument and add to the importance of conducting the appropriate analyses.
In order to compare a test across cultures in a meaningful way, one must demonstrate their equivalence in those cultures; in this case, the different language groups. Therefore, the researcher examined equivalence for the PIB/SpEEx Observance Test (401) at the test structural level and item level.
Structural (construct) equivalence analysis
The researcher conducted an item level Principal Axis Factor (PAF) analysis, using a tetrachoric correlation matrix, for each group. Researchers use tetrachoric correlations in factor analysis when they assume that the variables represent an underlying bivariate normal distribution, as in dichotomous test items (Van de Vijver & Leung, 1997).
With regard to the total group, Table 3 shows that the first factor accounts for 23.245% of the variance of the unrotated factor matrix. This is consistent with Shillaw's (1996) criterion that one needs at least 20% of the variance on the first factor before one can assume one-dimensionality. In addition, the Eigenvalue of the first factor must be significantly higher than that of the next largest factor. The first factor had a variance of more than three times that of the second factor, which further supports the assumption of one-dimensionality. According to Stout (1990), one-dimensional models are hard to achieve. Test developers are most keenly interested in scaling people using the general variable that underlies the diverse aspects of the construct. Therefore, a dominant latent trait and several nuisance latent traits can determine test performance.
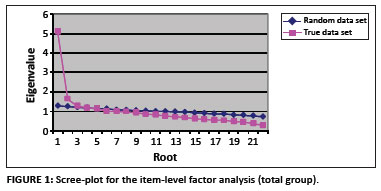
The scree-plot in Figure 1 shows that the researcher could not entirely ignore the possibility of a two-dimensional or even three-dimensional factor structure. The researcher conducted Horn's (1965) parallel analysis to determine the number of significant factors that fall above the level of chance. The Eigenvalues of the random dataset (the broken line) intersect the Eigenvalues for the true dataset (the solid line) at the third root. This indicates the possibility of a second or even a third significant factor, as Horn (1965) suggested.
Factor analysis, using tetrachoric correlations, tends to yield too many factors when one uses Kaiser's (1961) Eigenvalue criterion (Hambleton & Swaminathan, 1985). According to Zwick and Velicer (1986) and Gorsuch (1997), factors need at least three to four substantial factor loadings within the 0.40 range (after rotation) to be substantially meaningful.
The researcher explored the possibility of multipledimensionality by following a sequence of separate PAF factor analyses in which he retained a three-factor model and a two-factor model. Table 4 shows the oblique rotated pattern matrices of the three-factor and two-factor models.
Initially, the researcher subjected the three-factor model to oblique (oblimin) and orthogonal (varimax) rotation after iteration to establish a plausible factor model. The factor loadings on the rotated factor matrices for the oblique and orthogonal rotations differed noticeably. Field (2005) and Tinsley and Tinsley (1987) indicate that when oblique and orthogonal rotations do not produce nearly identical results on the same number of factor iterations, the factors are probably intercorrelated. It has been argued that the observance test is essentially a one-dimensional test. Therefore, primary factors should intercorrelate substantially. Consequently, it makes sense to choose oblique rotation (oblimin rotation) as the preferred method of rotation.
With regard to the rotated factor matrix, only two of the factors met the set three-factor loading criterion (Gorsuch 1997; Zwick & Velicer 1986). The three-factor model cannot be a plausible model because the third factor consists of only two salient loadings and is not substantial (weak and unstable) statistically. It is also not interpretable from a theoretical perspective. The researcher consequently abandoned the three-factor model.
Instead, the researcher inspected the two-factor model more closely. Each of the two factors represented substantial factors loadings. Therefore, he investigated the possibility of a two-factor model further. Upon closer inspection of the two-factor model, it became clear that the second factor was a difficulty factor. All the items with salient loadings on the second factor had a low difficulty value (p-value) in common and were highly negatively skewed. The mean skewness of these items was -3.321. One can regard items 6 and 9 as the defining items for the factor because these items had the highest factor loadings and had the highest skewness coefficients.
According to Tinsley and Tinsley (1987), the higher the loading of the variable on the factor, the more weight one should give that variable when interpreting the factor. Therefore, the only plausible explanation for the second factor is that it is a difficulty factor.
The researcher explored this idea further using Spearman's (rho) and Kendall's tau b nonparametric correlation analysis to determine the correlation between the salient factor loadings and the skewness statistic. He obtained high and significant correlations of r [8] = -0.738, p < 0.037 and r [8] = -0.643, p < 0.026 respectively. The correlation between the skewness statistic (mean skewness = -1.063) and the first factor was low and insignificant (r [10] = -0.139, p < 0.701 and r [10] = - 0.022, p < 0.929 respectively) and therefore does not relate to the difficulty level of the items. There is clear evidence that the second factor is a difficulty factor, according to Gorsuch's (1983) definition, and therefore is an artefact.
However, the researcher still needed to resolve the question of whether the observance test is a one-dimensional measure. According to Gorsuch (1983), one can use higher-order factor analysis to deal with difficulty factors. The relatively strong correlations between the two factors (r = 0.648) in the twofactor model suggests the presence of a higher-order factor. The results he obtained from the various analyses made a good case for investigating the presence of a bifactor model.
In a bifactor model, one assumes that a general factor explains the item intercorrelations. In addition, there are also so-called 'group' or 'nuisance' factors (in this case, difficulty factors). These show that item covariation is independent of the covariation because of the general factor. In other words, the researcher needed to explore in this study the existence of a bifactor, which would be a common trait in item content, over and above the common variance that item differential skewness causes.
Conceptually, a bifactor is not the same as a second-order factor. A second-order factor can be a qualitatively different type of dimension (a super-ordinate dimension), whereas a bifactor is on the same conceptual level as the group factors. In other words, it is another possible source of item variance (Reise, Morizot & Hays, 2007). Therefore, a bifactor analysis could answer the key questions about the dimensionality of the assessment. These are how much of the item variance a general construct causes and how much of it do secondary dimensions or nuisance factors cause.
Consequently, the researcher conducted a hierarchical factor analysis (Gorsuch, 1983; McDonald, 1999) to obtain a hierarchical solution consisting of bifactors and secondary factors. He factored the factor intercorrelation matrix for the two-factor model that Table 4 shows to obtain the item loadings for a general factor. He transformed the resulting general factor matrix and the pattern matrix of the twofactor model to an orthogonal hierarchical structure using the Schmid and Leiman (1957) transformation (Wolff & Preissing, 2005).
A strong bifactor, accompanied by relatively weak secondary factors, provides evidence to support one-dimensionality. Table 4 gives the results of the hierarchical factor analysis. The bifactor explains 64% of the variance. The secondary factors respectively explain 21% and 15% of the variance.
The results support the notion of one-dimensionality convincingly because the items represent one dominant or general construct. The secondary factors are unlikely to distort conclusions about a person's overall score on the observance test because the general factor has a dominant influence on item responses.
Consequently, the researcher conducted a one-factor extraction for the total sample and for each of the language groups for structural comparison purposes (see Table 5). The factor loadings of the bifactor for the total group in Table 4 were essentially the same as the factor loadings for the total group of the retained one-factor model that Table 5 shows (Tucker's congruence coefficient = 0.99).
The researcher repeated the PAF with a one-factor extraction for each of the language groups. Table 5 reports it.
The researcher assessed the extent to which the data fit into a one-dimensional hypothesised model using the standardised root-mean-squared residual (SRMR) fit statistics that EQS 6.1 produced (Bentler, 2001). It is based on the Tanaka-Huba unweighted least squares statistic (ULS) (Tanaka & Huba, 1985).
In addition, the researcher used the McDonald's fit index (MFI) and the root mean-square error of approximation (RMSEA), that produced by EQS's robust method for computation of categorical data and ULS estimation. The ULS estimation method is not sensitive to nonpositive definite correlation matrices, which are likely to occur with tetrachoric correlation matrixes (Knol & Ten Berge, 1989).
Bentler (2007) proposed including SRMR and RMSEA, coupled with one other index, which may include MFI as a model fit assessment, to detect potential misspecification in both the structural and measurement model parameters. One may regard the MFI as an 'absolute' fit index and an index of how well the hypothesised model fits the data. MFI is not as sample-size sensitive as the commonly reported absolute 'Goodness of Fit Index' (GFI) and 'Adjusted Goodness of Fit Index' (AGFI) (see Jöreskog & Sörbom, 1984). Therefore, it was the preferred fit index for inclusion in this study.
According to Table 6, the Satorra-Bentler scaled Chi-square values are significant for all groups, indicating unacceptable model fit. However, the Chi-square values are sensitive to sample size. Therefore, one uses fit indices to evaluate model fit.
The MFI for the total sample was 0.925 and the SRMR and RMSEA were 0.058 and 0.027 respectively. This shows good model fit (Hooper, Coughlan & Mullen, 2008). The MFI for the Afrikaans-speaking, Northern Sotho-speaking, IsiZulu-speaking, Setswana-speaking and English-speaking groups was 0.948, 0.952, 0.907, 0.949 and 0.909 respectively. The SRMR for these groups was 0.081, 0.071, 0.070, 0.080, and 0.107 respectively. The RMSEA was 0.023, 0.022, 0.031, 0.022 and 0.030. The model-fit ranged from good or close (MFI > 0.90, RMSR < 0.05, RMSEA < 0.05) to fairly good or reasonable (MFI > 0.90, SRMR < 0.09, RMSEA < 0.08) using the criterion values that McDonald (1999) and Hooper et al. (2008) suggested. For the English-speaking group, the SRMR was outside the range for reasonable fit, but one should note that sample size can influence the SRMR (the size of the English-speaking group was approximately half that of any of the other groups).
The researcher used the results of the PAF analysis, based on tetrachoric correlations (see Table 5) in the structural equivalence analysis. Table 5 presents the factor loadings of the unrotated factor matrix for each language group and Tucker's congruence coefficients.
In general, one can regard factor loadings of 0.30 and higher as acceptable (Tabachnik & Fidell, 1989). Schaap and Basson (2003) suggest allowing for small deviations from the 0.30 criterion to account for differences in sample homogeneity. Of the 22 items, five items showed low factor loadings for the total group. These five items (items 4, 8, 10, 17 and 22) consistently displayed low factor loadings across all language groups. The number of salient factor loadings (> 0.30 with permitted deviations) on the remaining items varied per group. This suggests that sample homogeneity had an effect on the factor loadings for the different groups.
The researcher used Tucker's congruence coefficient to determine the level of congruence between factor structures as a measure of factor structure similarity and stability. As a rule of thumb, one regards values higher than 0.95 as proof of factorial similarity and stability, whereas one regards values that are lower than 0.90 as indicators of nonsimilarity (Van de Vijver & Leung, 1997). As Table 5 shows, the congruence coefficients varied between 0.940 and 0.990 for the different comparisons that the researcher made. This shows factor similarity and stability. Therefore, one can conclude that there is a strong indication of structural equivalence. This implies that the construct for the different language groups (Afrikaans-speaking, English-speaking, Northern Sotho-speaking, IsiZulu-speaking and Setswana speaking) may be equivalent at a global level.
According to Van de Vijver (2003), one needs to be cautious when interpreting the value of factor congruence coefficients. Factor congruence coefficients tend to be high, irrespective of whether one or two items load substantially differently when the factor consists of a fair number of items with equally high and low loadings.
Therefore, factor congruence coefficients tend to be less sensitive to outlying cases in terms of factor loading differences for longer scales with a fair number of items. In summary, Van de Vijver (1997) claims that:
These indices are sufficiently accurate to examine factorial similarity at a global level but not accurate enough to identify anomalous items and subtle differences in the factorial composition and meaning across groups.
(Van de Vijver, 1997, p. 93)
Differential Item Functioning analysis
The aim of this analysis was to test whether the expected item score is the same across language groups when controlling for ability levels or standing on the latent variable. Table 7 presents a cross-tabulation of the different language groups and ability levels (score categories). The cross-tabulation gives information about the cell sizes of the matrix the researcher used for the DIF analysis.
The researcher divided the respondents into six groups according to their ability levels (test score categories or levels). Each language group in the seven different ability levels in the table had more than 50 cases, which is an acceptable cell size for the purposes of a DIF analysis.
Table 8 indicates that when the researcher evaluated DIF for the statistical significance of the Chi-square, most items revealed a statistically significant uniform DIF. He detected significant uniform DIF in all items (except for items 6, 11 and 20). He applied the absolute log odds ratio criterion to examine the practical significance of uniform DIF. He used a threshold of 0.64 because it is sufficiently large to have practical significance.
Nineteen items showed statistically significant uniform DIF, but the DIF was so slight for 11 items that it was negligible for all practical purposes. Items 1, 2 and 13 showed uniform DIF of sufficient magnitude for the researcher to regard them as practically important for three language groups (items 1 and 2 for the Setswana-speaking and Northern Sotho-speaking groups and item 13 for the IsiZulu-speaking and Northern Sotho-speaking groups) when he compared them to the Afrikaans-speaking sample group. Items 3, 14, 15, 18, 19 and 21 showed uniform DIF that was practically important for two language groups (items 3 and 21 for the Setswanaspeaking group and items 14, 15, 18 and 19 for the IsiZuluspeaking group) compared to the Afrikaans-speaking group.
In summary, four items showed uniform DIF for the Setswana-speaking group, two items for the Northern Sothospeaking group and five items for the IsiZulu-speaking group compared to the Afrikaans-speaking group. The direction of the DIF favours the Setswana-speaking and Northern Sothospeaking groups for items 1, 2 and 3. However, items 13, 14, 15, 18, 19 and 21 all showed uniform DIF in favour of the Afrikaans-speaking group.
When compared to the English-speaking group, item 3 showed uniform DIF for two language groups (the Setswanaspeaking and Northern Sotho-speaking groups). When compared to the IsiZulu-speaking group, item 19 showed uniform DIF for the Setswana-speaking and Northern Sothospeaking groups.
The researcher has not reported comparisons with the Setswana-speaking and Northern Sotho-speaking groups because he found no new information.
The researcher then used Nagelkerke's Pseudo R2Δ threshold to evaluate the practical importance of statistically significant DIF for all groups simultaneously. He applied the conservative threshold of 0.02 that Bjorner et al. (2003) suggested because one can regard it as sufficiently large to be practically significant.
Table 8 gives Nagelkerke's Pseudo R2 for ability level (β0 + β1 * ability level) before adding language groups to the equation. Cohen, Cohen, West and Aiken (2003) caution that Pseudo R2 is not a goodness of fit index, in the sense of explaining proportion of variance (in contrast to ordinary least squares regression) and that one should not think that it is.
One can interpret Pseudo-R2 as a percentage of the null deviance that accounts for a set of predictors. According to Hosmer and Lemeshow (2000), one should use it only to compare models. A Pseudo R2 only has meaning when one compares it to another Pseudo R2 of the same type, using the same data and when predicting the same outcome (University of California at Los Angeles: Academic Technology Services, Statistical Consulting Group, n.d.).
Only item 1 showed uniform DIF that had practical significance. The researcher used a conservative cut-off (p < 0.01) to indicate statistical significance for nonuniform DIF because of the large number of statistical tests he conducted. Items 1 and 12 showed statistically significant nonuniform DIF.
The researcher used Nagelkerke's Pseudo R2 difference threshold to evaluate the practical importance of statistically significant nonuniform DIF. According to the criteria of Bjorner et al. (2003), none of the items showed nonuniform DIF that had practical significance.
Discussion
Conclusions
The study investigated and determined the DIF and structural equivalence of a nonverbal cognitive test (PIB/ SpEEx Observance test [401]) for five language groups. There were clear differences between the mean values, standard deviations, coefficients of skewness, kurtosis and alphas (α) of the different language groups that the researcher compared. The mean scores, variance, reliability and ultimately the discriminatory power of the PIB/SpEEx Observance Test (401) differed noticeably between groups. This raises questions about the equivalence of, and bias in, the instrument.
The differences in test reliabilities for the respective language groups suggest that the PIB/SpEEx Observance Test (401) constructs may not be equivalent for these groups. However, one should recognise that the differences that seem to exist between the test reliabilities for different groups are preliminary rather than conclusive evidence (Schaap & Basson, 2003). Therefore, the researcher needed factor and item analysis to provide evidence that is more conclusive.
The factor analytical results showed that the 22-item PIB/ SpEEx Observance Test (401) consists of one factor. The Eigenvalues and explained variance demonstrate that the test is one-dimensional. The EFA indicated similar response patterns for the different groups. Tucker's congruence coefficient showed structural equivalence. This implies that the construct for the different language groups (Afrikaansspeaking, English-speaking, Northern Sotho-speaking, IsiZulu-speaking and Setswana-speaking) appears to be equivalent at a global level but was not necessarily equivalent for all item loadings. Therefore, there may be subtle differences in factorial composition and meaning across groups. In any study designed to compare examinees from two or more language groups or cultures, the construct the tests measure must be equivalent if the comparison is to be meaningful (Van de Vijver & Poortinga, 1997).
The DIF analysis revealed that a large number of the items showed statistically significant uniform DIF and only two items showed nonuniform DIF. Most items showed statistically uniform DIF because of their large sample sizes. However, the overall effect sizes were generally small and are negligible from a practical perspective.
At group level nine, 40% of items showed practically important DIF for the African-lanuage speaking groups when compared to the Afrikaans-speaking group. The items the researcher identified as practically important uniform DIF were not consistent for all groups. Three items showed uniform DIF for two groups simultaneously, whilst the rest of the items applied to one group only.
Most of the uniform DIF items (five items) the researcher identified were in the IsiZulu-speaking group, four items in respect of the Setswana-speaking group and only three items in respect of the Northern Sotho-speaking group. All five uniform DIF items in the IsiZulu-speaking group were negative and disadvantaged the group.
The direction of DIF of the Setswana-speaking and Northern Sotho-speaking groups alternated but did not necessarily disadvantage these groups. One can conclude that the number of uniform DIF items is limited in respect of any one group.
With regard to the DIF analyses when the researcher treated the English-speaking and IsiZulu-speaking groups as comparison groups, only one item showed practical significance DIF. One DIF item would probably have a negligible effect on the test score. Although two items showed nonuniform DIF at a statistically significant level, no items showed practical significant DIF for nonuniform DIF.
The researcher completed 220 DIF comparisons (10 comparisons per item) across the five groups for uniform DIF. One can regard only 16 (7.2%) of the comparisons as practically significant (absolute log odds ratio > 0.64). In respect of the nonuniform DIF analysis, none of the items showed practically significant DIF (Nagelkerke's Pseudo R2Δ > 0.02).
One can conclude that the items for the PIB/SpEEx Observance Test (401) are comparable for most of the items for the five language groups. Items that do display DIF are not the same items for the respective language groups. Notwithstanding the finding that the effect of language on DIF may be limited for any one group (in terms of absolute log odds ratios) or for all groups simultaneously (in terms of Nagelkerke R2Δ), this research shows that nonverbal tests may still show DIF to some extent for particular language groups. Therefore, one should regard the test as a languagereduced test and not as a language-free test.
The results of this study show that one can regard the PIB/ SpEEx Observance Test (401) as a structurally equivalent measure of cognitive ability at a global level for various language groups in the beverage industry, the medical sector and in a tertiary institution. However, there may be subtle differences in the factorial composition and meaning across groups and researchers need to explore these further.
The visual material the PIB/SpEEx test uses does appear to reduce the mother tongue (first-language) effect and the related cultural effect on the cognitive processes that result in test performance on most items. McCrae (2000) has pointed out the relationship between language and culture. The literature review discusses it in more detail.
The groups in this study seem to have interpreted and processed the visual images in a similar manner for most of the items. However, according to Hoge (1999) and Robinson (1992), visual materials are culturally bound. In the context of the current study, language groups (and by implication culture) had a practically significant effect on the test's item functioning on a number of items. One can only partially confirm the assumption that Erasmus and Schaap (2003) made about using language-free tests as a method of reducing the effect of language and culture for the nonverbal PIB/SpEEx Observance Test (401).
The DIF results of this study are not unique because similar DIF results for different language and ethnic groups have been reported in South Africa for a variety of nonverbal cognitive tests, including the Figure Classification Test (Van Zyl & Visser, 1998), the LPCAT (De Beer, 2004) and the PIB/ SpEEx 100 (Schaap & Vermeulen, 2008) tests. In the South African context, the findings on the structural equivalence of the PIB/SpEEx Conceptualisation test (100) for five language groups were similar (Schaap & Vermeulen, 2008).
Because biased test results can lead to unfair discrimination, racial inequity and other adverse effects are among the most contentious workplace issues in South Africa today. The Labour Relations Act 66 of 1995 (Republic of South Africa, 1995) and the Employment Equity Act 55 of 1998 (Republic of South Africa, 1998) provide specifically for this type of discrimination. One can regard a psychometric test that contains DIF as a potentially biased instrument. This implies that it can jeopardise the test's overall validity.
Popular perceptions and misconceptions surrounding psychometric testing in the industry can cause a test to lose its credibility, deservedly or not, if one does not approach the issue of bias from a scientific, test-by-test perspective and report them in a similar fashion (Van Zyl & Visser, 1998). However, one should not regard a lack of DIF on its own as sufficient evidence that a test cannot, or would not, cause unfair discrimination against members of specific groups in the workplace.
Limitations of the study
An important limitation of the current study was the attenuation of item statistics and test reliability because of the homogeneity of the sample group in their levels of education .
Group homogeneity can result in items with ceiling effects or with highly skewed score distributions, as in the case of groups with higher education qualifications. These items would be unable to discriminate between groups as effectively as other items could. Simulations show that it is more difficult to detect DIF in these items, although Type 1 error rates appear to be stable (Scott et al., 2010).
Members of the sample group from the beverage industry were the least homogeneous in their levels of education. This resulted in significantly higher reliability coefficients. Therefore, the PIB/SpEEx Observance Test (401) appears to differentiate best when one uses it for population groups that are heterogeneous in qualifications.
Overall, one can conclude that the study would have benefited from including a sample group that was more heterogeneous in levels of education.
Recommendations for further research
Schaap and Vermeulen's (2008) recommendations for future research on test equivalence and test bias also apply to this study.
Problems arising from instrument characteristics (method bias) should be investigated.
Multisample Confirmatory Factor Analysis (MCFA) procedures that are suitable for dichotomous variables should be considered as these provide more options to test for measurement invariance.
The predictive bias of the test should be explored. Biographical questions that elicit responses in home languages and mother tongues might be included because many people want to claim English as their home language when it is not.
Pseudo-DIF should be investigated to ensure that all identified DIF could actually be attributed to the effect of the variable being investigated. It occurs when DIF in one item causes apparently opposing DIF in other items in the same scale, even though these other items are not biased. Scott et al. (2010) explains how Pseudo-DIF can occur:
For example, in logistic regression DIF analyses the log odds ratios for items in a scale will sum approximately to zero. Thus log odds ratios for items without real DIF may be forced into the opposite direction to compensate for items with true DIF.
(Scott et al., 2010, p. 7)
The researcher recommends that researchers use expert reviews of DIF items as part of the process of understanding and interpreting the effects of DIF. Expert reviews are particularly useful in situations when there is more than one possible source of DIF, such as when researchers distinguish between cultural and linguistic responses (Scott et al., 2010).
Author acknowledgements
Author competing interests
I declare that I have no financial or personal relationship(s) which have inappropriately influenced me in writing this paper.
References
American Educational Research Association, American Psychological Association, National Council on Measurement in Education (1999). Standards for educational and psychological testing. Washington, DC: American Educational Research Association. [ Links ]
Anastasi, A., & Urbina, D. (1997). Psychological testing. (7th edn.). Upper Saddle River, NJ: Prentice Hall. [ Links ]
Bedell, B., Van Eeden, R., & Van Staden, F. (2000). Culture as moderator variable in psychological test performance: issues and trends in South Africa. South African Journal of Psychology, 25(3), 1-7. [ Links ]
Bentler, P.M. (2007). On tests and indices for evaluating structural models. Personality and Individual Differences, 42, 825-829. doi:10.1016/j.paid.2006.09.024 [ Links ]
Bentler, P.M. (2001). EQS 6.1: Structural Equations Program [computer software]. Encino, CA: Multivariate Software. [ Links ]
Biesheuvel, S. (1949). Psychological tests and their application to non-European peoples. In G.B. Jeffrey (Ed.), The year book of education, (pp. 87-126). London, UK: Evans. [ Links ]
Bjorner, J.B., Kosinski, M., & Ware, J.E. (2003). Calibration of an item pool for assessing the burden of headaches: an application of item response theory to the headache impact test (HIT). Quality of Life Research, 12, 913-933. doi:10.1023/A:1026163113446, PMid:14651412, doi:10.1023/A:1026175112538, PMid:146514 10; doi:10.1023/A:1026123400242, PMid:14651417, doi:10.1023/A :1023295421684, PMid:12769138 [ Links ]
Bland, J.M., & Altman, D.G. (1997). Statistics notes: Cronbach's alpha. Retrieved October 03, 2009, from http://www.pubmedcentral.nih.gov/picrender.fcgi?artid=2126061&blobtype=pdf [ Links ]
Bollen, K.J., & Long, J.S. (Eds.). (1993). Testing structural equation models. Newbury Park, CA: Sage. [ Links ]
Bosma, H., Marmot, M.G., Hemingway, H., Nicholson, A.C., Brunner, E., & Stansfield, S.A. (1997). Low job control and risk of coronary heart disease in Whitehall II (prospective cohort) study. British Medical Journal, 314, 558-65. [ Links ]
Brown, F.G. (1983). Principles of Educational and Psychological Testing. (3rd edn.). New York: CBS College Publishing. [ Links ]
Cattell, R.B. (1940). A culture free intelligence test. Journal of Educational Psychology, 31, 161-180. doi:10.1037/h0059043 [ Links ]
Claassen, N.C.W. (1996). Paper and pencil games (PPG). Manual. Pretoria: Human Sciences Research Council. [ Links ]
Claassen, N.C.W. (1990). The comparability of general scholastic aptitude test scores across different population groups. South African Journal of Psychology, 20, 80-92. [ Links ]
Cohen, J. (1988). Statistical power analysis for the behavioral sciences. New York: Academic Press. [ Links ]
Cohen, J., Cohen, P., West, S.G., & Aiken, L.S. (2003). Applied multiple regression/ correlation analysis for the behavioral sciences. (3rd edn.). Mahwah, NJ: Erlbaum. [ Links ]
Collins Pocket Reference English dictionary. (1990). London, UK: Collins. [ Links ]
Crane, P.K., Van Belle, G., & Larson, E.B. (2004). Test bias in a cognitive test: differential item functioning in the CASI. Statistics in Medicine, 23, 241-256. doi:10.1002/sim.1713; PMid:14716726 [ Links ]
Dallmeijer, A.J., Dekker, J., Roorda, L.D., Knol, D.L., Van Baalen, B., De Groot, V., Schepers, V.P.M., & Lankhorst, G.J. (2005). Differential item functioning of the functional independence measure in higher performing neurological patients. Journal of Rehabilitation Medicine, 37, 346-352. doi:10.1080/16501970510038284,PMid:16287665 [ Links ]
De Beer, M. (2004). Use of differential item functioning (DIF) analysis for bias analysis in test construction. South African Journal of Industrial Psychology, 30(4), 52-58. [ Links ]
De Beer, M. (2000). Learning potential computerized adaptive test (LPCAT): User's manual. Pretoria: Production Printers. [ Links ]
Erasmus, P. (2007). JP EXPERT/PIBSpEEx 2100 training manual, Vol. 2. (6th edn.). Krugersdorp: Potential Index Associates. [ Links ]
Erasmus, P. (2002). Job profiling standard form (complete). Job Profiling Expert Version 22.13 [computer software]. Johannesburg: PSI Systems. [ Links ]
Erasmus, P., & Schaap, P. (2003). Situation specific job profiling and assessment short course JP Expert/PIBSpEEx. Course presented at the University of Pretoria, South Africa. [ Links ]
Field, A. (2005). Discovering statistics using SPSS. (3rd edn.). London, UK: Sage. [ Links ]
Foxcroft, C.D. (1997). Psychological testing in South Africa: perspectives regarding ethical and fair practices. European Journal of Psychological Assessment, 13, 229-235. doi:10.1027/1015-5759.13.3.229 [ Links ]
Geisinger, K.F. (2003). Testing and assessment in cross-cultural psychology. In I.B. Weiner, D.K. Freedheim, J.R. Graham, JA. Schinka & J.A. Naglieri (Eds.), Handbook of Psychology: Assessment psychology, (pp. 95-117). Hobokea, NJ: John Wiley & Sons InGorsuch, R.L. (1997). Exploratory factor analysis: its role in item analysis. Journal of Personality Assessment, 68(3), 532-560. doi:10.1207/ s15327752jpa6803_5, PMid:16372866 [ Links ]
Gorsuch, R.L. (1983). Factor analysis. Hillsdale, NJ: Erlbaum. [ Links ]
Gregory, R.J. (2004). Psychological testing: history, principles, and applications. (4th edn.). Boston, MA: Pearson. [ Links ]
Hambleton, R.K., & Swaminathan, H. (1985). Item response theory: principles and applications. Dordrecht: Kluwer. [ Links ]
Hammill, D.D., Pearson, N.A., & Wiederholt, J.L. (1997). Comprehensive test of nonverbal intelligence. Austin, TX: PRO-ED. [ Links ]
Hoge, R.D. (1999). Assessing adolescents in educational, counseling and other settings. London, UK: Erlbaum. [ Links ]
Hooper, D., Coughlan, J., & Mullen, M.R. (2008). Structural equation modelling: guidelines for determining model fit. Electronic Journal of Business Research Methods, 6(1), 53-60. Retrieved January 20, 2011, from www.ejbrm.com [ Links ]
Horne, T.J. (2002). Education and language transferees. Education Africa Forum, 5, 40-45. [ Links ]
Horn, J.L. (1965). A rationale and test for the number of factors in factor analysis. Psychometrika, 30(2), 179-185. doi:10.1007/BF02289447, PMid:14306381 [ Links ]
Hosmer, D.W., & Lemeshow, S. (2000). Applied logistic regression. (2nd edn.). New York: Wiley. doi:10.1002/0471722146 [ Links ]
Jöreskog, K.G., & Sörbom, D. (1984). LISREL VI [computer software]. Chicago, IL: Scientific Software International, Inc. [ Links ]
Kaiser, H.F. (1961). A note on Guttman's lower bound for the number of common factors. British Journal of Statistical Psychology, 14(1), 1. [ Links ]
Kendell, I.M., Verster, M.A., & Von Mollendorf, J.W. (1988). Test performance of blacks in South Africa. In S.H. Irvine, & J.W. Berry (Eds.), Human abilities in cultural context (pp. 299-341). Cambridge: Cambridge University Press. [ Links ]
Knol, D.L., & Ten Berge, J.M.F. (1989). Least-squares approximation of an improper correlation matrix by a proper one. Psychometrika, 54, 53-61. doi:10.1007/ BF02294448 [ Links ]
Kriel, H. (2003). The predictive validity of PIBSpEEx in two training environments. In JP EXPERT/PIBSpEEx/CompIndex Research Manual 1995-2005 (pp. 130-134). Johannesburg: Potential Index Associates. [ Links ]
Kriel, H. (2002). The predictive validity of SpEEx in potential assessment in an academic institution. In JP EXPERT/PIBsPEEx/CompIndex Research Manual 1995-2005 (pp.88-90). Johannesburg: Potential Index Associates. [ Links ]
Kriel, H. (2001). Technikon data (Reliability of the SpEEx scales). In JP EXPERT/PIBsPEEx/ CompIndex Research Manual 1995-2005 (p. 102). Johannesburg: Potential Index Associates. [ Links ]
Lohman, D.F. (2005). The role of nonverbal ability tests in the identification of academically gifted students: an aptitude perspective. Gifted Child Quarterly, 49, 111-138. doi:10.1177/001698620504900203 [ Links ]
Martin, M., Blaisdell, B., Kwong, J.W., & Bjorner, J.B. (2004). The short-form headache impact test (HIT-6) was psychometrically equivalent in nine languages. Journal of Clinical Epidemiology, 57, 1271-1278. doi:10.1016/j.jclinepi.2004.05.004,PM id:15617953 [ Links ]
McCrae, R.R. (2000). Trait psychology and the revival of personality in culture studies. American Behavioral Scientist. Retrieved August 30, 2005, from http://www.epnet.com/ehost/login/html [ Links ]
McDonald, R.P. (1999). Test theory: a unified treatment. Ma hwah, NJ: Erlbaum. [ Links ]
McDonald, R.P. (1985). Factor analysis and related methods. Hillsdale, NJ: Erlbaum. [ Links ]
McGrew, K.S. (2005). The Cattell-Horn-Carroll theory of cognitive abilities. In D.P. Flanagan, & P.L. Harrison (Eds.), Contemporary intellectual assessment: theories, tests, and issues, (pp. 136-181, 2nd edn.). New York: Guilford. [ Links ]
McGrew, K.S., & Flanagan, D.P. (1998). The intelligence test desk reference (ITDR): Gf-Gc cross-battery assessment. Boston, MA: Allyn & Bacon. [ Links ]
McKinley, R.K., MankuScott, T., Hastings, A.M., French, D.P., & Baker R. (1997).Reliability and validity of a new measure of patient satisfaction with out of hours primary medical care in the United Kingdom: development of a patient questionnaire. British Medical Journal, 314, 193-198. [ Links ]
Meiring, D., Van de Vijver, F.J.R., Rothmann, S., & Barrick M.R. (2005). Construct, item, and method bias of cognitive and personality tests in South Africa. South African Journal of Industrial Psychology, 31(1), 1-8. [ Links ]
Neuman, W.L. (2005). Social research methods: qualitative and quantitative approach. (6th edn.). Boston, MA: Allyn and Bacon. [ Links ]
Nunnally, J.C., & Bernstein, I.H. (1994). Psychometric theory. (3rd edn.). New York: McGraw-Hill. [ Links ]
Owen, K. (1996). Construction of tests and questionnaires: basic psychometric principles. In K. Owen & J.J. Taljaard (Eds.), Handbook for the use of psychological and scholastic tests of the HSRC, (pp. 19-74). Pretoria: HSRC. [ Links ]
Petersen, M.A., Groenvold, M., Bjorner, J.B., Aaronson, N., Conroy, T., Cull, A., et al. (2003). Use of differential item functioning analysis to assess the equivalence of translations of a questionnaire. Quality of Life Research, 12, 373-385. doi:10.1023/A:1023488915557, PMid:12797710 [ Links ]
Reise, S.P., Morizot, J., & Hays, R.D. (2007). The role of the bifactor model in resolving dimensionality issues in health outcomes measures. Quality of Life Research, 16, 19-31. doi:10.1007/s11136-007-9183-7, PMid:17479357 [ Links ]
Republic of South Africa. (1998). The Employment Equity Act, Act 55 of 1998. Government Gazette, 19370. Pretoria: Government Printer. [ Links ]
Republic of South Africa. (1996). The Constitution of the Republic of South Africa, Act 108 of 1996. Government Gazette, 17678. Pretoria: Government Printer. [ Links ]
Republic of South Africa. (1995). The Labour Relations Act, Act 66 of 1995. Government Gazette, 1877. Pretoria: Government Printer. [ Links ]
Reynolds, C.R., & Kamphaus, R.W. (2003). Reynolds Intellectual Assessment Scales. Lutz, FL: Psychological Assessment Resources. [ Links ]
Robinson, R.S. (1992). Teaching visual literacy: questions and concerns about curricula. In J. Clark-Baca, D.G. Beauchamp & R.A. Braden (Eds.),Visual communications: bridging across cultures. Selected readings from the Annual Conference of the International Visual Literacy Association, 9-13 October 1991 (pp. 223-230). Washington, DC: International Visual Literacy Association. [ Links ]
Schaap, P. (2003). The construct comparability of the PIB/SpEEx Stress Index for job applicants from diverse cultural groups in South Africa. South African Journal of Psychology, 33(2), 95-102. [ Links ]
Schaap, P. (2001). The psychometric properties of SpEEx. In JP EXPERT/PIBSpEEx/ CompIndex Research Manual 1995-2005, (pp. 91-96). Johannesburg: Potential Index Associates. [ Links ]
Schaap, P., & Basson, J.S. (2003). The construct equivalence of the PIB/SpEEx motivation index for job applicants from diverse cultural backgrounds. South African Journal of Industrial Psychology, 29(2), 49-59. [ Links ]
Schaap, P., & Vermeulen, T. (2008). The construct equivalence and item bias of the PIB/SpEEx conceptualisation ability test for members of five language groups in South Africa. South African Journal of Industrial Psychology, 34(3), 29-38. [ Links ]
Schmid, J., & Leiman, J. (1957). The development of hierarchical factor solutions. Psychometrika, 22(1), 53-61. doi:10.1007/BF02289209 [ Links ]
Scott, N.W., Fayers, P.M., Aaronson, N.K., Bottomley, A., De Graeff, A., Groenvold, M.,Gundy, C., Koller, M., Petersen, M.A., & Sprangers, M.A.G. (2010). Differential item functioning (DIF) analyses of health-related quality of life instruments using logistic regression. Health and Quality of Life Outcomes, 8, 81. doi:10.1007/ s11136-006-9120-1, PMid:17109190 [ Links ]
Scott, N.W., Fayers, P.M., Aaronson, N.K., Bottomley, A., De Graeff, A., Groenvold, M., et al. (2007). The use of differential item functioning analyses to identify cultural differences in responses to the EORTC QLQ-C30. Quality of Life Research, 16, 115-129. [ Links ]
Shillaw, J. (1996). The application of the Rasch modelling to yes/no vocabulary tests. Retrieved on 30 August 2005, from http://www.swan.ac.uk/cals/calsres/vlibrary/js96a.htm [ Links ]
SPSS for Windows, Version 15 [computer software] (2006). Chicago: SPSS Inc. [ Links ]
Stout, W.F. (1990). A new item response theory modeling approach with applications to unidimensionality assessment and ability estimation. Psychometrika, 55, 293-325. doi:10.1007/BF02295289 [ Links ]
Stump, T.E., Monahan, P., & McHorney, C.A. (2005). Differential item functioning in the short portable mental status questionnaire. Research on Aging, 27, 355-384. doi:10.1177/0164027504273784 [ Links ]
Tabachnik, B.G., & Fidell, L.S. (1989). Using multivariate statistics. (2nd edn.). New York: Harper Collins. [ Links ]
Tanaka, J.S., & Huba, G.J. (1985). A fit index for covariance structure models under arbitrary GLS estimation. British Journal of Mathematical and Statistical Psychology, 38, 197-201. [ Links ]
Taylor, T.R. (1997). Administrator's manual for APIL Battery. Johannesburg: Jetline. [ Links ]
Tinsley, H.E.A., & Tinsley, D.J. (1987). Uses of factor analysis in counseling psychology research. Journal of Counseling Psychology, 34(4), 414-424. doi:10.1037/00220167.34.4.414 [ Links ]
University of California. (20 11). Academic Technology Services, Statistical Consulting Group (n.d.). FAQ: What are pseudo R-squareds? Retrieved March 19, 2011, from http://www.ats.ucla.edu/stat/mult_pkg/faq/general/psuedo_rsquareds.htm [ Links ]
Van de Vijver, F.J.R. (1998). Towards a theory of bias and equivalence. Retrieved October 07, 2006, from http://www.gesis.org/publikationen/Zeitschriften_spezial/documents/znspezial3/znspez302_vijver.pdf [ Links ]
Van de Vijver, F.J.R. (2003). Bias and substantive analysis. In J.A. Harkness, F.J.R. van de Vijver, & P.P.H. Mohler (Eds.), Cross-Cultural Survey Methods, (pp. 207-233). New York: Wiley. [ Links ]
Van de Vijver, F.J.R., & Leung, K. (1997). Methods and data analysis for cross-cultural research. Newbury Park, CA: Sage. doi:10.1027/1015-5759.13.1.29 [ Links ]
Van de Vijver, F.J.R., & Poortinga, Y.H. (1997). Towards an integrated analysis of bias in cross-cultural assessment. European Journal of Psychological Assessment, 13, 29-37. [ Links ]
Van Zyl, E., & Visser, D. (1998). Differential item functioning in the figure classification test. Journal of Industrial Psychology, 24(2), 25-33. [ Links ]
Vorster, M., Olckers, C., Buys, M.A., & Schaap, P. (2003). The construct equivalence of the job diagnostic survey for diverse South African cultural groups. SA Journal of Industrial Psychology, 31(1), 31-37. [ Links ]
Waller, N.G. (1995). MicroFACT 2.0: A microcomputer factor analysis program for ordered polytomous data and mainframe size problems. St Paul, MN: Assessment Systems Corporation. [ Links ]
Weiss, F.M. (1999). Die multimodale onderrigteks gerig op 'n multikulturele, tersiêre studentegroep [The multimodal instructional text aimed at a multicultural, tertiary student group]. Unpublished thesis. University of Johannesburg, Johannesburg, South Africa. [ Links ]
Wolff, H., & Preissing, K. (2005). Exploring item and higher order factor structure with the Schmid Leiman solution: Syntax codes for SPSS and SAS. Behavior Research Methods, 37(1), 48-58. doi:10.3758/BF03206397, PMid:16097343 [ Links ]
Zegers, F.E., & Ten Berge, J.M.F. (1985). A family of association coefficients for metric scales. Psychometrica, 50, 17-24. doi:10.1007/BF02294144 [ Links ]
Zwick, W.R., & Velicer, W.F. (1986). Comparison of five rules for determining the number of components to retain. Psychological Bulletin, 99(3), 432-442. doi:10.1037/0033-2909.99.3.432 [ Links ]
 Correspondence to:
Pieter Schaap
Postal address: Private Bag X20
Hatfield 0028, Pretoria, South Africa
Email: Pieter.Schaap@up.ac.za
Received: 10 Dec. 2009
Accepted: 06 May 2011
Published: 14 Oct. 2011
© 2011. The Authors. Licensee: AOSIS OpenJournals. This work is licensed under the Creative Commons Attribution License.


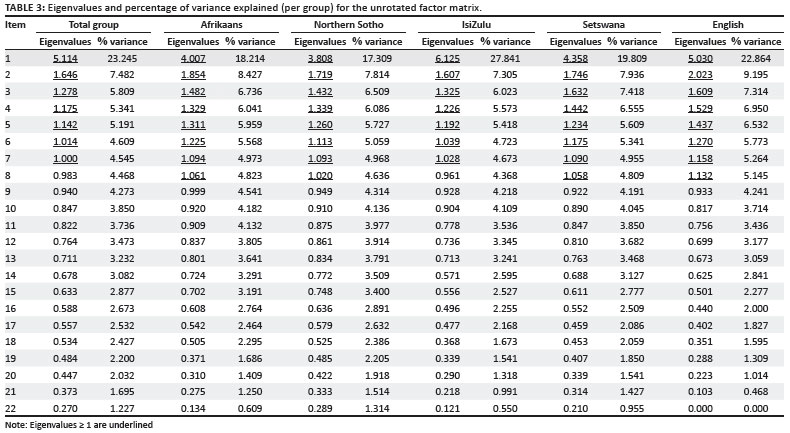
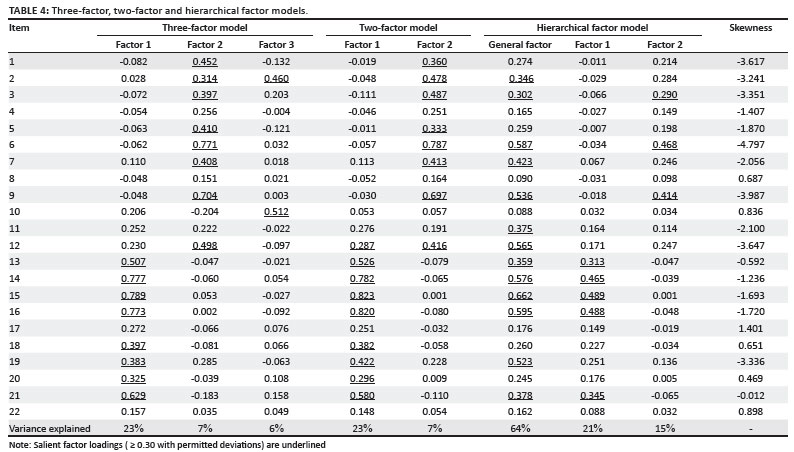
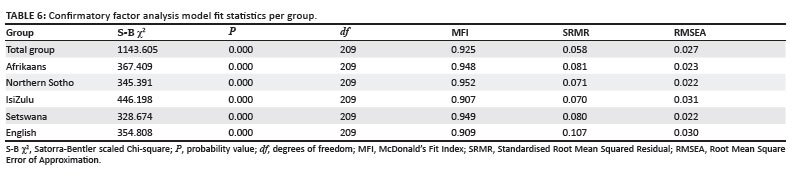
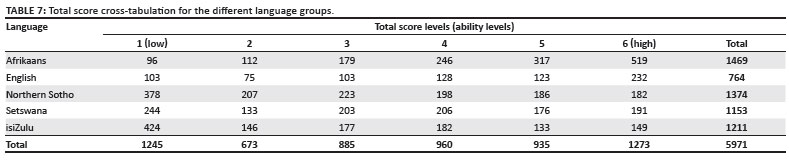
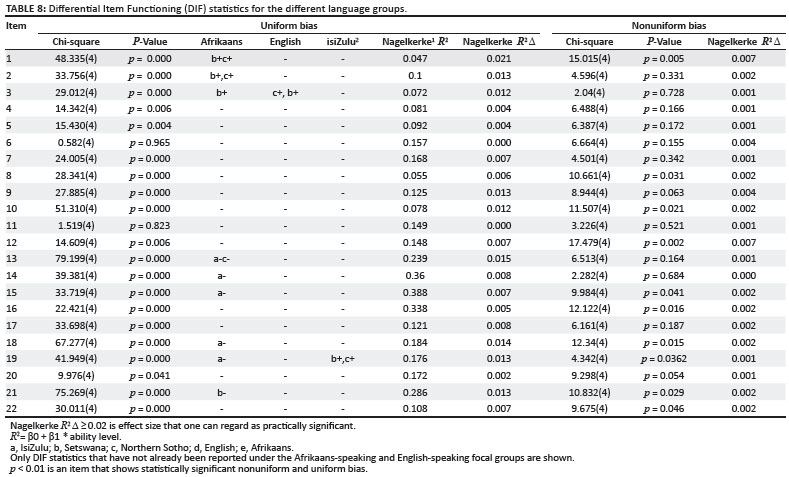