


Serviços Personalizados
Artigo
 Inglês (pdf)
 Artigo em XML
 Referências do artigo
Indicadores

Links relacionados
-
 Citado por Google
 -
 Similares em Google
Compartilhar

 Permalink
South African Journal of Child Health
versão On-line ISSN 1999-7671
versão impressa ISSN 1994-3032
S. Afr. j. child health vol.14 no.1 Pretoria Abr. 2020
http://dx.doi.org/10.7196.SAJCH.2020.v14.i1.1598
RESEARCH
Impact of the child support grant on the diet and nutritional status of children under 5 years old in Mogalakwena Municipality, Limpopo Province, South Africa
M J KekanaI; N S MabapaII; X G MbhenyaneIII
IMSc (Public Nutrition), RD; Department of Health, Polokwane, Limpopo, South Africa
IIMSc (Public Nutrition); Department of Nutrition, School of Health Sciences, University of Venda, Thohoyandou, Limpopo, South Africa
IIIMBA, PhD, RD; Division of Human Nutrition, Faculty of Medicine and Health Sciences, University of Stellenbosch, Cape Town, South Africa
ABSTRACT
BACKGROUND. Studies have shown that poverty has reduced in households receiving a child support grant (CSG), and that it has contributed to improving the lives of beneficiaries.
OBJECTIVES. The study objectives were to determine the contribution of the CSG to the diet and nutritional status of children under 5 years old.
Methods. The study was a cross-sectional descriptive survey with an analytical component of 189 caregiver-child pairs receiving CSGs from Mogalakwena Municipality. Data were collected by using a validated questionnaire and anthropometric measurements.
RESULTS. About 36.5% of caregivers were between the ages of 26 and 35 years, 75.7% unmarried, and 84.1% unemployed. The mean (standard deviation (SD)) age of children was 2.84 (1.33) years of whom 77.8% lived in a household of more than 5 people. Most caregivers received nutritional education from relatives, 71.1% were never educated about nutrition, and 57.9% of children were fed 3 times/day. The child support grant was used by 94.2% of recipients to buy food, with an average monthly expenditure of ZAR171.55 (155.25), while the proportion of the total grant spent on food was 44%. There was a 53.5% prevalence of stunting, 32.3% of wasting and 5.3% underweight among the children, while 22.1% of caregivers were overweight and 12.1% obese.
CONCLUSION. Most caregivers were not taught about child feeding. The proportion of CSG spent on food was less than 50%, with most bought food being of low nutritional quality. The prevalence of wasting and stunting was very high, accompanied by a high prevalence of overweight and obesity in caregivers.
South Africa (SA) is still battling with issues of poverty, inequality, unemployment and hunger, driven by historical events and a political economy that is unique to SA.M Globally, about 60 million children experience moderate acute malnutrition, and a further 13 million severe acute malnutrition. The South African National Food Consumption Survey of 2005 found that 52% of households experience hunger.[2] In addition, the SA National Health and Nutrition Examination Survey (SANHANES-1) reported that only 45.6% of the SA population is food secure.[3] According to SANHANES, the largest percentage of participants who experienced food insecurity was found in urban informal (32.4%) and rural formal (37.0%) localities, with Eastern Cape and Limpopo provinces having a hunger prevalence >30%.[3]
The targeted social grant has an impact on the triple challenge of poverty, unemployment and inequality. The child support grant (CSG) was initiated in 1998, with a cash value of ZAR100 per child per month, paid to the primary caregiver. The cash value has kept pace with inflation over the years, from ZAR190 per child per month from April 2006, to ZAR400 per child per month in 2018, according to the SA Child Gauge 2018. There has been a very good uptake of the CSG nationally, and it is generally acknowledged that the grant is well targeted, with an excellent reach of poor children.[4] Of the 17 million South Africans who receive a monthly cash grant from the state, over 10.1 million are recipients of the CSG.M A majority of these caregivers are women and biological caregivers; however, although the CSG was conceived as a gender-neutral, child-centred cash transfer programme, it has become 'feminised' because of the fact that in SA society, an overwhelming expectation is that women should provide primary care for children.[5]
Studies confirm that the incidence ofpoverty continued to increase in SA between 1993 and 2000, and has since declined marginally.!6 Research in KZN Province has demonstrated that stunted children do less well in their first few years at school than children who are an appropriate height for age.[7] A better understanding of changes in the nutritional status of children can potentially assist the identification of policy interventions to achieve a sustainable reduction of poverty in RSAi6] A number of studies have shown that poverty has been reduced in households receiving a CSG, and the grant has also been shown to improve nutritional intake.[7] The objectives of the present study were to determine the nutritional knowledge of caregivers, and the use and contribution of the CSG to the diet and nutritional status of children.
Methods
The study was a cross-sectional descriptive survey with an analytical component conducted in Mogalakwena Municipality in the Waterberg District of Limpopo Province. A quantitative research approach was used. The target population was primary caregivers and their children under the age of 5 years receiving a CSG. Multistage sampling was used whereby the municipality was clustered into 4 units, and a simple random sampling was used to select 4 villages, then snowballing was used to select households. Primary caregivers and children who were visiting the 4 villages and those with mental health problems were excluded from the study. The sample size of 200 (10% of the target population) was based on the estimated number of children who were eligible for CSGs in that area, using census data.[8]
Data collection procedure
The research was conducted in the household of each participant where a room was used to ensure privacy. Two stations were arranged, one for anthropometric measurements and demographic information collected by the fieldworker, and the second for the researcher who interviewed primary caregivers using a validated questionnaire. The researcher developed the questionnaire, which was pilot tested in five households to assess the completeness and appropriateness of questions, with the focus on participants' understanding of questions. The pilot study was conducted in another village from the same municipality, chosen because it had the same characteristics regarding socioeconomic status, lifestyle and cultural beliefs as those of the sampled villages.
Demographic and household data
A validated questionnaire with sections on sociodemographic and environmental factors, utilisation of the CSG, and nutritional knowledge of caregivers was used to gather information. The researcher administered the questionnaire in order to optimise reliability and to avoid partial completion of the questionnaire. The questionnaire had both open- and close-ended questions. The local language of Sesotho sa Leboa was used when asking questions while answers were recorded in English.
Anthropometric measures
The weights of children were taken by the fieldworker using a Seca electronic scale (model 0213) which was continuously calibrated against an electronic scale. Height was taken using a tape against a wall. Weight and height were measured twice, and an average calculated to increase accuracy.
Ethical considerations and institutional approval
Ethical clearance was obtained from the Higher Degree and Ethics Committee of the University of Venda (ref. no. 24/02/06MJKekana). Permission was also granted by the Department of Health provincial office (ref. no. 4/2/2 - 15/3/06), the Mogalakwena Municipality (ref. no. 19/1/1 and G16 - 16/7/06) and the village chiefs. Primary caregivers also gave consent for themselves and their children. If at any time in the study, a participant was observed to be experiencing nutrition-related effects, the participant was informed and referred to the nearest health institution.
Statistical analysis
Open-ended questions were analysed using thematic analysis and categorised. Then coding was applied and entered in an Excel spreadsheet. Z-scores which were gender- and age-independent, thus permitting the evaluation of children's growth status, were determined by weight for age (WAZ), height for age (HAZ) and weight for height (WHZ). For the purpose of establishing whether the observations of nutritional status were of public health importance, the World Health Organization (WHO) classification for assessing severity of malnutrition by prevalence range was used. Weight and height for primary caregivers was interpreted using the body mass index (BMI) classification.[9] Caregivers' BMI was correlated with WAZ, HAZ and BAZ with a significance level set at p<0.05 using Statistical Package for Social Sciences (IBM Corp., USA) version 18.
Results
Demographic data of participants
A total of 189 caregivers/child pairs were recruited for the study. Results of the analysis revealed that 69 (36.5%) of the caregivers were within the age range 25 - 26, and only 1 (0.5%) was less than 18 years old. Most caregivers (72%, n=137) attended a high school until grades 8 - 12, were single (75.7%, n=143) and were unemployed (84.1%, n=160). The mean (standard deviations (SD)) age of the children was 2.48 (1.33) years and 59 (31.2%) of the children were 2 years old. Regarding gender, 99 (52.4%) were boys and 90 (47.6%) were girls. Concerning their disease history, 173 (92%) of the children were not sick while 16 (8%) were sick.
Socioeconomic and environmental parameters of the households
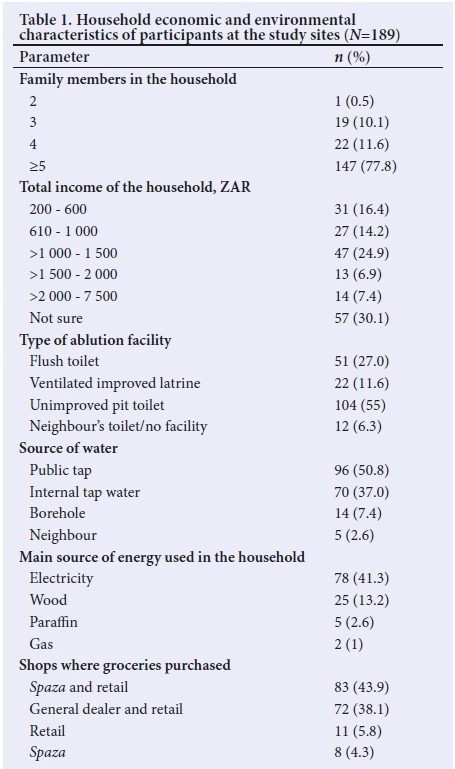
Regarding socioeconomic and environmental characteristics, most (n=147, 77.8%) households indicated that they comprised 5 family members, 47 (24.9%) reported ZAR1 000 - ZAR1 500 as their total monthly household income, 104 (55%) caregivers said that they used pit latrines, and 96 (50.8%) reported that they obtained water from communal taps. Caregivers bought groceries at various shops, ranging from spazas to retail supermarkets (Table 1).
Nutritional knowledge of caregivers
Caregivers' knowledge of nutrition was assessed, and the analysis revealed that most caregivers had poor knowledge of nutrition: 134 (70.9%) had never received training on child feeding, 55 (29.1%) had knowledge of child feeding, and nurses were their main source of nutrition education, followed by dieticians and mothers of the caregivers. Furthermore, only 28.4% of caregivers knew that if a child were not appropriately fed, they would fall sick, and only 23.1% of participants knew that unhealthy skin could be a sign of poor nutrition.
Use of the child support grant
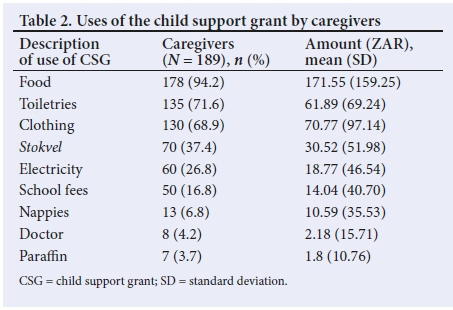
Caregivers were asked ifthey used the CSG for stokOels. The caregivers reported involvement in stokvels: 61 (32.3%) by contributing more than ZAR50 monthly, while 2 (1.1%) contributed ZAR10, and 69 (36.5%) did not contribute to a stokvel. The total amount of CSG for each household varied according to the number of children receiving a grant. About 61 (32.8%) received a total CSG ranging from ZAR420 to ZAR700, and 109 (57.7%) a total amount ranging from ZAR190 to ZAR400. The mean (SD) CSG received was ZAR386.22 (ZAR208.75) per caregiver. The number of children receiving a CSG in the household ranged from 1 - 5. About 78 (41.3%) caregivers indicated that they had only one child receiving a CSG, 66 (34.9%) had two children while 7 (3.7%) had four recipients of the CSG. Caregivers were asked if the CSG was used for supporting the whole family. About 106 (56.1%) said this was the case while 83 (43.9%) said it was not. Caregivers reported that they received various types of grants. About 51 (27.0%) of participants had other family members who received pension grants, four (2.1%) received a combination of disability grant and pension grant, and 122 (64.6%) did not receive anything other than the CSG. The CSG was intended to contribute to the wellbeing of a child, but it was used for different reasons in different households. However, the majority of 178 (94.2%) used it to buy food, 135 (71.6%) for toiletries, 130 (68.9%) for clothing, 70 (37.4%) for stokvels, 60 (26.8%) for electricity, and about 50 (16.8%) for school fees. Table 2 summarises the uses of CSGs.
The type of food purchased with the portion of the CSG used on food was also examined and the average amount of the CSG spent on food was ZAR386.22 (ZAR208.75). Most (80.5%, n=153) participants reported that they spent money on starches such as mealie meal (43.7%, n=83) and baby cereal (21%, n=40). In addition, participants reported that they spent money on protein food, i.e. offal (35.8%, n=68), poultry (26.4%, n=50), soya (20%, n=38), tinned fish (16.8, n=32), beef (15.2%, n=29) and under 10% each on processed meat, beans, eggs, peanut butter and fresh fish. Also, 168 (88.4%) participants reported that they bought milk and milk products that included: yoghurt (44.7%, n=85), Nespray powder (24.7%, n=47), fresh milk (13.7%, n=26), baby formula (11.6%, n=22) and i«komazi (5.3%, n=10). Participants reported also buying vegetables with part of the food expenditure. Very few participants spent money on cold beverages (<10%) such as cordials and fruit juice.
Anthropometric measurements
Figs 1, 2 and 3 show the results and interpretations of anthropometric measurements of children for underweight, stunted growth and overweight or obesity. According to Fig. 1, 105 (55.6%) children were of normal weight, 10 (5.3%) were severely underweight, 5 (2.6%) were overweight and 3 (1.6%) were obese. This underweight prevalence is low, according to WHO standards.
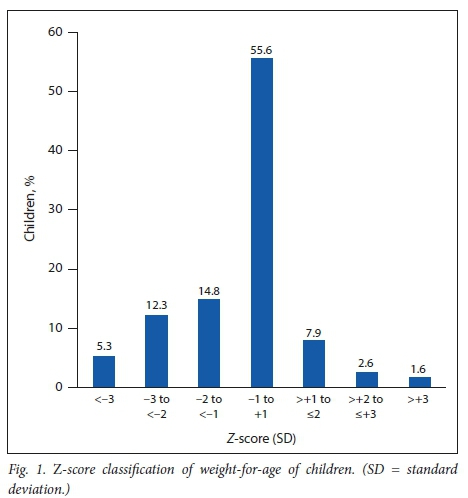
Fig. 2 shows that 65 (34.4%) of the children were of normal height, while 37 (19.6%) were severely stunted and 4.2% grew very tall for their age. The prevalence of stunting was 61 (32.3%), which is interpreted as high according to WHO standards and is of public health concern.

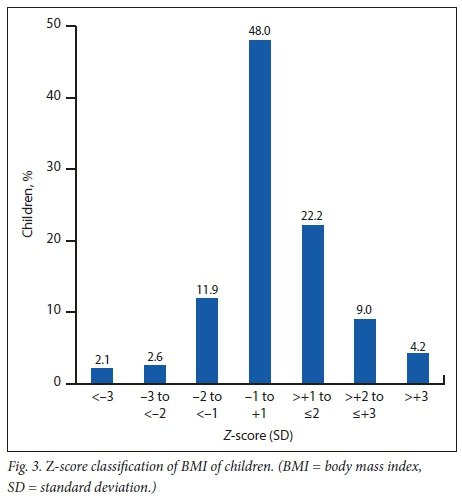
Fig. 3 shows the children's BMI where 113 (59.9%) were of normal BMI (-2SD - +1SD) while 42 (22.2%) were at possible risk of being overweight and 8 (4.2%) were obese.
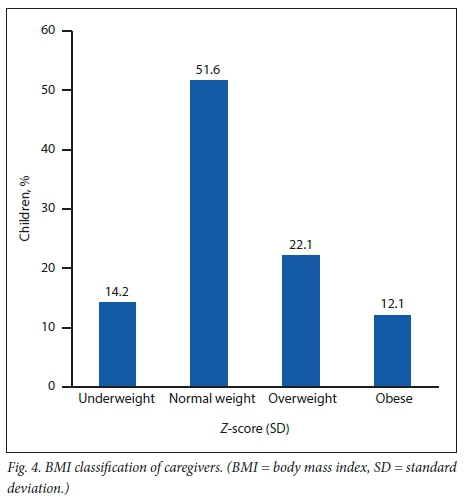
The BMI classification for caregivers shows that 64 (34.2%) were either overweight or obese, using the categorised BMI standards (underweight <18.5, normal weight 18.5 - 24.9, overweight 25.0 -29.9 and obese >30) as shown in Fig. 4.
Discussion
Nutritional knowledge of caregivers
Few caregivers had acquired knowledge of child nutrition from training received from nurses, dieticians or their mothers/parents, which implies that most caregivers had never received any form of training on child nutrition. Every time a child suffers from malnutrition, the caregiver bears responsbility owing to a lack of nutritional knowledge.[10] These findings contradict a study conducted in rural KZNI[11] where only 22% of caregivers indicated that they never received nutrition education while the majority of caregivers had received nutrition education from health facilities. Although nutrition knowledge alone may not be adequate as a determinant for maintaining a healthy diet, knowledge can positively influence beliefs and facilitate healthier food intake practices.1121
Total household income was less than ZAR7 500/month from all sources combined in the present study, with about 25% of the surveyed households spending about ZAR105 - ZAR200/month on food. This finding implies that households in the current study cannot purchase food of high nutritive value owing to the limited money at their disposal. The findings are in line with those of Statistics SA (StatsSA) in 2011, which reported that poor households spend an average of ZAR8 485/year on food.[8]
Use of the CSG
In the present study, most (94.2%) families used the CSG for food, followed by toiletries (71.6%), then clothing (68.9%) which indicates that most families depend on this grant to buy their basic needs. This finding is in line with a survey conducted in Sekhukhune District in Limpopo Province, which showed that money was spent on 5 items: food (54%), water and electricity (9%) and soap and other household items (8%)[13] Interestingly, stokvels appeared as a top item on which money was spent; this was also reported in the CSG Impact Assessment report[14] where there was a 91% saving paid into stokvels, indicative of the importance of social involvement and social capital in such saving groups. The main function of stokvels in this study was for funeral purposes, ensuring that, at the time of a death, the family had money to bury their loved ones.
Current findings also report that 80.5% of the money spent on food goes to starches of which the highest percentage is mealie meal, followed by baby cereal. This implies that little was spent on proteins and vitamins (vegetables). As reported by StatsSA, 35% of poor households spend most of their money on the food category of starch, which is mostly mealie meal, while non-poor households spend 20% of their money on the same category. The poor have little money to spend on meat compared with the non-poor.
Nutritional status of children and caregivers
Most children in the current study were of normal weight (56.8%) while 16.3% were at risk of overweight, which is in line with another study[15] that found that children <5 years old were of normal weight. In the present study, the prevalence of stunting among the surveyed children was 32.3%, with 21.2% stunted and 19.5% severely stunted. These figures are interpreted globally as a high prevalence according to WHO standards and is a public health concern which resonates with Koornhof[15] where stunting was 31.6%, similarly to SANHANES-1 where boys' and girls' stunting was 26.9% and 25.9%, respectively. Zere and Mclntyrel[17] showed consistency with their results that stunting was one of the most prevalent forms of malnutrition in rural SA. More than half of the caregivers in the study were of normal BMI, but 22% were overweight and 12.1% obese. This again shows that caregivers have children who are malnourished, which might be a result of limited financial resources to feed appropriately. Malnutrition may adversely affect a child's intellectual development and consequently health and productivity in later life, and the WHO identifies stunting as a reliable measure of overall social deprivation. If good nutrition is provided from the first 1 000 days of life, it lays a solid foundation for physical and cognitive development, which will result in better performance at school, which then translates to better chances of finding good, well-paid employment, and thus better income.!18! The present study did not determine the food quantities consumed by the children. Therefore nutrient intake was not determined. However, the quality of food bought does show an inadequate variety of protein and other micronutrient sources. It is also possible that the energy intake was inadequate, given the large number of family members in the households. Some limitations of the present article include sampling and measurement errors, and recall and self-reported issues. These issues were overcome by asking several questions on the same subject.
Conclusion
The findings reveal that most households depend solely on the CSG and used less than half of the grant for the purchase of food, which was mainly starchy food and of low nutritional quality. This might have led to poor feeding habits resulting in a high prevalence of stunting and overweight children, and obese caregivers. Therefore the need for health promotions to improve infant and young child nutrition is imperative. Increasing the CSG might significantly increase purchasing power and improve feeding habits, thus reducing the prevalence of stunting and overweight among children.
Declaration. This manuscript was submitted in partial fulfilment of the requirements for the degree of Master of Public Medicine.
Acknowledgements. The authors thank the mothers who participated in the study and research assistant Abigail Maifo.
Author contributions. MJK was the main researcher and student, who conceptualised the study, collected data, analysed data and developed and finalised the manuscript. NSM and XGM were co-supervisor and supervisor, respectively; they provided guidance with conceptualisation data collection and analysis, and in development and finalisation of the manuscript.
Funding. The authors thank the University of Venda for financial support.
Conflicts of interest. None.
References
1. MDG report. Executive Summary of Millennium Development Goals. Assessing Progress in South Africa Towards the Millennium Development Goals. 2013. https://www.un.org/millenniumgoals/pdf/report-2013/mdg-report-2013-english.pdf (accessed 16 August 2016). [ Links ]
2. Labadarios D, Maunder E, Steyn N, et al. National food consumption survey in children aged 1 - 9 years: South Africa 1999. Forum Nutr 2003;56:106. [ Links ]
3. Shisana O, Labadarios D, Ruhle T, et al. South African National Health and Nutrition Examination Survey (SANHANES-1): 2014 edition. Cape Town: HSRC Press, 2014. [ Links ]
4. South African Social Security Agency (SASSA). Statistical Report on Social Grants. Pretoria: SASSA, 2011. http://www.sassa.gov.za (accessed 15 March 2016). [ Links ]
5. Patel L, Hochfeld T. It buys food but does it change gender relations? Child Support Grants in Soweto, South Africa. Gend Develop 2011;19(2):229-240. https://doi.org/10.1080/13552074.2011.592633 [ Links ]
6. May J, Tim$us IM. Inequities in under-five child nutritional status in South Africa: What progress has been made? Dev South Afr 2014;31(6):761-774 https://doi.org/10.1080/0376835X.2014.952896 [ Links ]
7. Aguero JM, Carter MR, Woodlard I. The Impact of Unconditional Cash Transfers on Nutrition: The South African Child Support Grant Working Paper. Cape Town: International Policy Centre for Inclusive Growth, University of Cape Town, 2006. https://ipcig.org/pub/IPCWorkingPaper39.pdf (accessed 10 June 2016). [ Links ]
8. Statistics South Africa. Census 2011. www.statssa.gov.za (accessed 13 December 2016). [ Links ]
9. World Health Organization. Physical status. The Use and Interpretation of Anthropometry. Technical report series, 1995. No. 854. Geneva: WHO, 1995. https://www.who.int/ (accessed 13 October 2015). [ Links ]
10. Nnakwe N. Community nutrition: Planning Health Promotion and Disease Prevention. Massachusetts: Jones & Bartlett, 2012. [ Links ]
11. Cape W, Faber M, Benadé S. Breastfeeding, complementary feeding and nutritional status of 6-12-month-old infants in rural KwaZulu-Natal. S Afr J Clin Nutr 2007;20(1):16-24. [ Links ]
12. O'Brien G, Davies M. Nutrition knowledge and body mass index. Health Ed Res 2006;22(4):571-575. https://doi.org/10.1093/her/cyl119. [ Links ]
13. Kola S, Braehmer S, Kanyane M, Morake R, Kimmie Z. Phasing in the Child Support Grant: A Social Impact Study. Johannesburg: Community Agency for Social Enquiry; 2000. www.oxfam.org/grow (accessed 16 July 2016). [ Links ]
14. South African Government. Report of the Lund Committee on Child and Family Support, 1996. www.gov.za/documents/report-lund-committee-child-family-support (accessed 20 September 2005). [ Links ]
15. Chatterjee S, Saha S. A study on knowledge and practice of caregivers regarding infant feeding and nutritional status of under five children attending immunisation clinic of a medical college. Internet J Nutr Wellness 2007;5(1). http://ispub.com/IJNW/5/1 [ Links ]
16. Koornhof HE. A profile of children in the Avian Park and Zweletemba settlements in the Breede Valley Local Municipality of Western Cape, South Africa. Master of Nutrition dissertation. Cape Town: University of Stellenbosch, 2014:129. [ Links ]
17. Zere E, McIntyre D. Inequities in under-five child malnutrition in South Africa. Int J Equity Health 2003;2:1-10. https://doi.org/10.1186/1475-9276-2-7 [ Links ]
18. Handa S, Seidenfeld D, Davis B, Tembo G. The Zambian cash transfer evaluation. Are cash transfers a silver bullet? Evidence from Zambian Child Support Grant. New York: UNICEF, 2014. http://www.unicef-irc.org/ (accessed 7 December 2016). [ Links ]
 Correspondence:
X G Mbhenyane
xgm@sun.ac.za
Accepted 14 October 2019.

