


Servicios Personalizados
Articulo
 Inglés (pdf)
 Articulo en XML
 Referencias del artículo
Indicadores

Links relacionados
-
 Citado por Google
 -
 Similares en Google
Compartir

 Permalink
South African Journal of Child Health
versión On-line ISSN 1999-7671
versión impresa ISSN 1994-3032
S. Afr. j. child health vol.13 no.3 Pretoria sep. 2019
http://dx.doi.org/10.7196/SAJCH.2019.v13.i3.1640
ARTICLE
Results from the Healthy Active Kids South Africa 2018 Report Card
C E DraperI, II; S A TomazII; S H BassettIII; J HarbronIV; H S KrugerV; L K MicklesfieldI, II; A MonyekiVI; E V LambertII, VII
IPhD SA MRC Developmental Pathways for Health Research Unit, School of Clinical Medicine, Faculty of Health Sciences, University of the Witwatersrand, Johannesburg, South Africa
IIPhD Division of Exercise and Sports Medicine, Department of Human Biology, Faculty of Health Sciences, University of Cape Town, South Africa
IIIPhD; Department of Sport, Recreation and Exercise Science, Faculty of Community and Health, University of the Western Cape, Cape Town, South Africa
IVPhD; Division of Human Nutrition, Department of Human Biology, Faculty of Health Sciences, University of Cape Town, South Africa
VPhD; Centre of Excellence for Nutrition, Faculty of Health Sciences, North-West University, Potchefstroom, South Africa
VIPhD; Physical Activity, Recreation and Sport Sciences Research Focus Area, Faculty of Health Sciences, North-West University, Potchefstroom, South Africa
VIIPhD; Health through Physical Activity, Lifestyle and Sport Research Centre, Faculty of Health Sciences, University of Cape Town, South Africa
ABSTRACT
BACKGROUND. Healthy Active Kids South Africa (HAKSA) Report Cards were produced in 2007, 2010, 2014 and 2016.
OBJECTIVE. The 2018 Report Card aims to report on the latest available evidence relating to the physical activity (PA), nutrition and body
composition of South African (SA) children and adolescents.
METHODS. A review was conducted using the following databases: PubMed; Africa Journals Online; and Africa-Wide (EBSCOhost). Articles published from January 2016 to September 2018 were included for review by the HAKSA scientific advisory group. Data were extracted, and a grade for each indicator was assigned based on the available evidence and the consensus of the scientific advisory group. This included 12 PA indicators, 6 nutrition indicators and 3 body composition indicators.
RESULTS. There was no evidence of a significant change in any of the indicators since the 2016 Report Card. Grades for certain indicators have been downgraded (from 2016) to bring these to the attention of relevant stakeholders and industry. These include food insecurity and grades that relate to the implementation of policy on PA and nutrition in the school environment, and on advertising and media relating to nutrition.
CONCLUSION. Key priorities for action include: safe opportunities for physical activity; minimising the gap between policy and implementation (school culture and environment, and government strategies); and the double burden of over- and undernutrition, which relates to the continuing concern about food insecurity in SA. There is a need for further research, including surveillance, on all indicators, for future Report Cards.
Physical activity (PA) is beneficial for the physical and mental health of children and adolescents (0 - 17 years old),[1,2] while higher levels of sedentary behaviour (particularly screen time) are associated with unfavourable health outcomes.[3,4] Nutrition has been recognised as a factor contributing to the development of overweight/obesity in children and adolescents.[5]A nutrient-dense diet and regular PA are beneficial for overall child growth, health and wellbeing.[6] Healthy lifestyle behaviours also play a role in cognitive development and school achievement in children and adolescents.[7]
The Healthy Active Kids South Africa (HAKSA) Report Card reviews the most current evidence on the PA, nutrition and body composition of South African (SA) children and adolescents. This evidence provides the basis from which to guide policy, develop interventions and programmes and strengthen advocacy to create healthy environments and support healthy nutrition and PA, and discourage sedentary behaviours in SA children and adolescents. Children and adolescents (0 - 19 years old) make up 39% of the total population of SA (~52 million people in total).[8] Although this proportion of children and adolescents is relatively high, it is lower than those in some other African countries: the proportion of children and adolescents 0 - 14 years old (a narrower age range) is also 39% in Zimbabwe (population ~13.8 million), and in Nigeria the proportion of 0 - 14 year olds is 43% (population ~190.6 million).[9-Results from the HAKSA 2016 Report Card indicated that more than 50% of SA children were meeting PA recommendations, and government policies for the support of sport and PA in children and adolescents were evident. Areas of concern were high amounts of screen time and sedentary behaviour, as well as low fruit and vegetable consumption, and high intake of sugar-sweetened beverages (SSBs) and fast foods. Undernutrition and overweight/obesity were highlighted as a concern, as overweight prevalence was increasing,[10] and the HAKSA 2016 Report Card highlighted the persistence of the double burden of under- and over-nutrition across South Africa.[11] The HAKSA 2018 Report Card is the fifth in the series (since 2007),[10-12] and aims to report on the available evidence relating to PA, sedentary behaviours, nutrition and body composition of SA children and adolescents (3 -18 years old) published since the 2016 Report Card. In addition, we consider the related environmental and ecological factors that may be barriers to or facilitators for healthy eating and PA in SA children and adolescents.
Methods
The HAKSA 2018 Report Card has been developed and produced by a scientific advisory group consisting of 29 academics and/or content experts, with group leaders for physical activity, nutrition, body composition and early childhood content (in the context of this article, 'early childhood' refers to preschool-aged children, or those aged between 3 and 5 years old). Comprehensive searches on PubMed, Africa Journals Online, Africa-Wide Information (hosted by EBSCO) databases for evidence published from January 2016 - September 2018 on PA, nutrition and body composition in SA children and adolescents (3 - 18 years old) were conducted. Exclusion criteria were (i) review articles; (ii) studies in which the participants were exclusively over 18 years old; (iii) studies conducted outside of SA; and (iv) articles included in previous Report Cards. The HAKSA 2018 Report Card comprises 3 categories of indicators: PA, nutrition and body composition (Table 1). The PA indicators are aligned to a larger, international initiative, the Active Healthy Kids Global Alliance, which involves 49 countries.[13] Data from these countries are harmonised for comparison.
The search yielded 805 titles, of which 62 were extracted for consideration (35 PA, 14 nutrition, 7 body composition and 9 early childhood (covering PA and body composition), with some overlap between different indicators). In addition, hand-searching was conducted by members of the scientific advisory group. Members of the group were each assigned between 2 and 4 full manuscripts to critically appraise.[14] Key study methods and findings relevant to the indicators were extracted and submitted to group leaders, who then summarised the findings for their theme. Where necessary, cross-checking of extracted data was done by the group leaders and first author of the present article. Content groups were asked to compile a summary report and to propose grades (with justification) for each indicator, taking into consideration the grades assigned in the HAKSA 2016 Report Card, to assess whether any improvements had occurred.[10] These grades were then discussed in order to reach consensus within each group, and all groups were provided with an opportunity to comment on them so that there was consensus on all grades within the scientific advisory group.
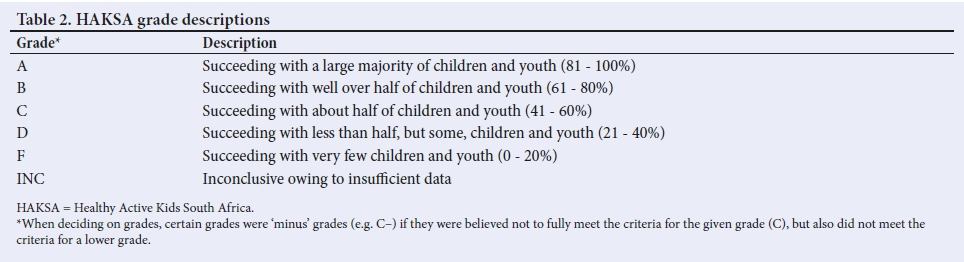
Meetings were held in person and online to reach consensus on the grade assignment. Grades were assigned to each indicator within each of the four categories, ranging from A to F (Table 2), and a rationale for each grade was constructed.
Results
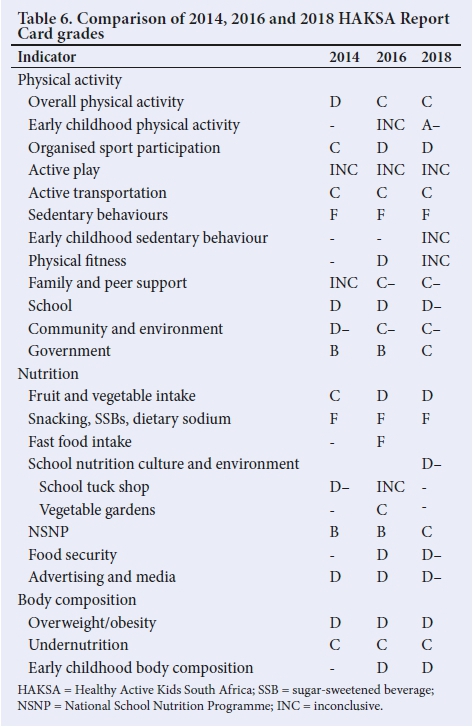
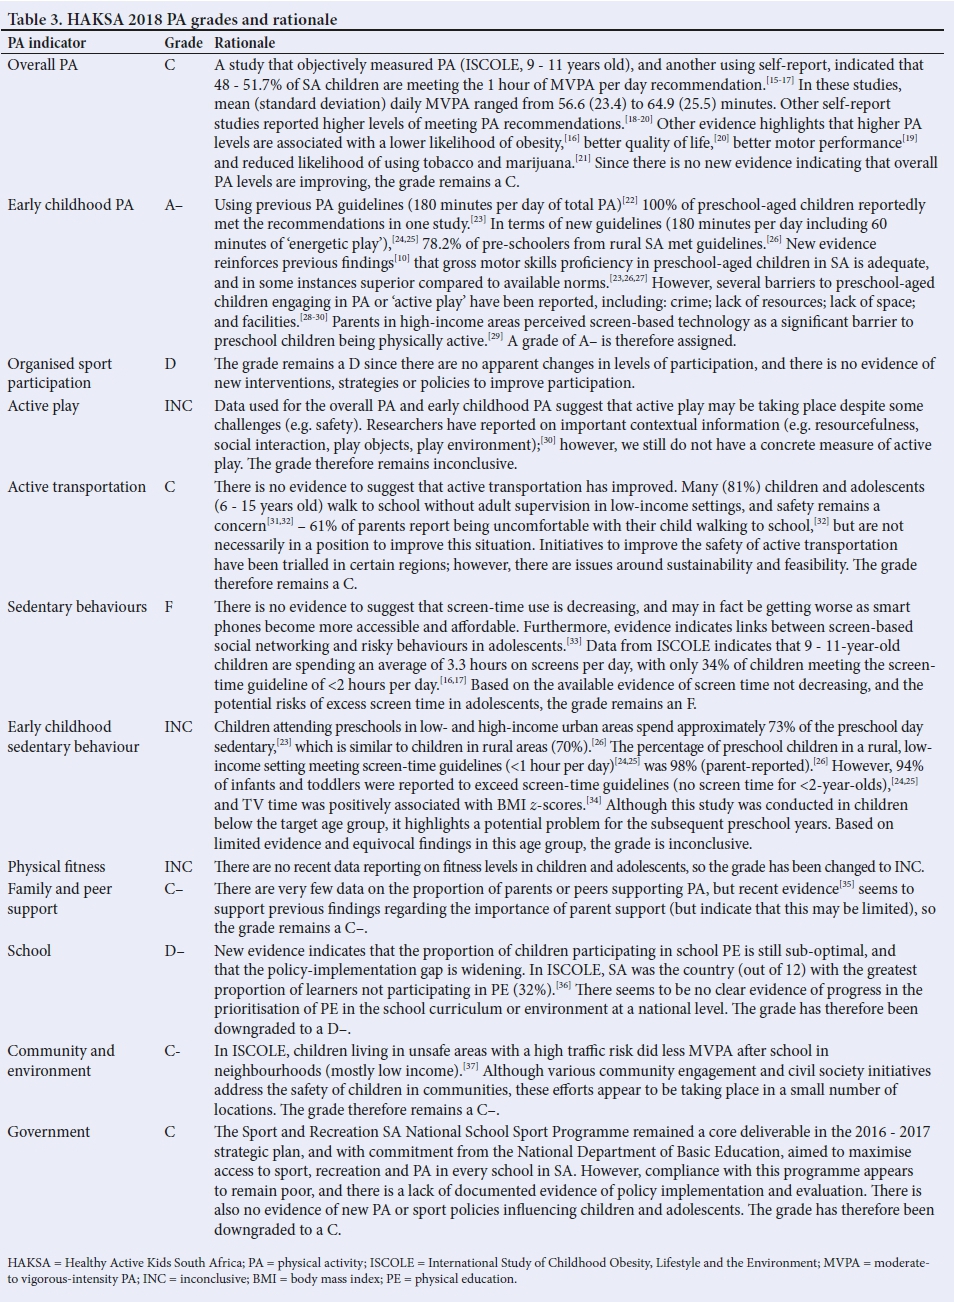
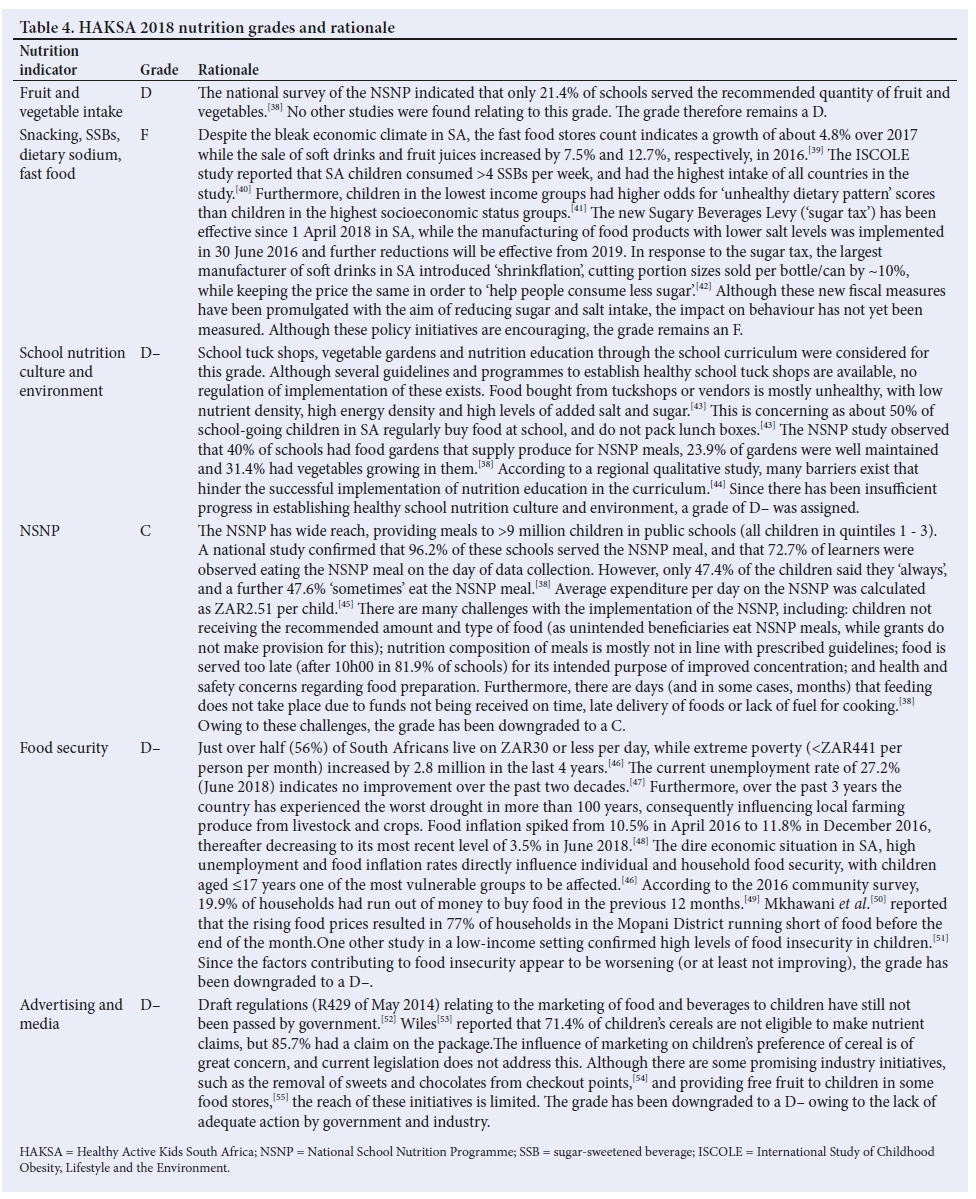
Most of the indicators were informed by smaller regional studies, as the only national data available for the past 2 years related to active transportation, the National School Nutrition Programme (NSNP), food security and body composition. Tables 3 - 5 provide the grade and a rationale for each indicator within the categories of PA, nutrition and body composition, respectively. A full reference list is available on request from the authors. Table 6 presents grades assigned for the 2014, 2016 and 2018 Report Cards, to indicate progress or lack thereof.
Discussion
There was no evidence of improvements or declines since 2016 in any of the PA, nutrition and body composition indicators included in the HAKSA 2018 Report Card. The only indicators that seem positive are early childhood PA and gross motor proficiency (specifically in preschool-aged children), although further research is required to establish whether these levels are maintained as preschool-aged children transition into formal schooling. Furthermore, since a grade was not previously included for these early childhood indicators, it is not possible to state that this is an improvement. All indicators would benefit from additional research, and particularly research that is able to provide a national perspective, considering the heterogeneity that was identified for some indicators, particularly across different income settings. There are challenges in measuring and reporting on the prevalence of certain behaviours and activities, e.g. active play, organised sports participation and PA at school. It was also challenging to obtain accurate data on SA children and adolescents' online exposure to food and beverage marketing, specifically SSBs and fast food. As electronic media become increasingly accessible to this age group in SA, along with increased uptake and use of social media and the global shift towards digital forms of marketing, it is more important than ever to track this exposure and its potential impact on behaviour.
Despite the absence of new evidence of improvements or declines in any of the PA, nutrition and body composition indicators between 2016 and 2018, certain indicators have been downgraded (as described in Tables 3 and 4) since the 2016 Report Card. These include PA indicators for school and government, and nutrition indicators for the NSNP, food security and advertising and media. The purpose of downgrading these indicators was to highlight the lack of progress in these areas, in the hope that relevant stakeholders and industry would take necessary action. In particular, the development and implementation of policies on PA and nutrition in the school environment, and on advertising and media relating to unhealthy eating, are needed. The food insecurity indicator was also downgraded, to highlight the lack of sufficient effort to improve access to food of adequate quality for those living in the poorest of circumstances in SA. For children and adolescents specifically, failure to act could have significant consequences for cognitive development and academic outcomes.[7] The worsening of food insecurity is particularly concerning in light of the growth of the fast food industry and increases in SSB sales.
The HAKSA 2018 Report Card findings highlight a number of key priorities that require action. Firstly, safety remains a concern for SA children and adolescents, particularly in low-income communities: it was raised as an issue for three of the PA indicators: 'active play', 'active transportation' and 'community and environment'. There is an apparent lack of a systematic approach to deal with this issue. While further research is required to fully understand the nature of the impact of safety concerns on children's PA and play, children's safety and vulnerability should be a priority on a far broader agenda than this.
Secondly, there remains a significant gap between policy and implementation, particularly with regard to the school environment and government strategies to promote PA and healthy nutrition among children and adolescents. It appears that there is little accountability for lack of implementation, and that what has been implemented has not been rigorously evaluated.
Thirdly, the double burden of under- and over-nutrition persists among SA children and adolescents. Overweight/obesity continues to be high (especially among girls), despite the presence of food insecurity, which again highlights the need for better access to food of good quality, rather than merely food of high caloric content. However, this will remain challenging as the fast food industry grows, and if the sale of SSBs continues to rise. Furthermore, it is essential to consider the broader food environment and the food and beverage industry as a whole, and the impact that these may have on the nutrition and body composition of SA children and adolescents. The competitive nature of multinational food companies, their rapid penetration of markets in low- and middle-income countries and their targeting of children and parents in an effort to develop taste preferences early in life warrant consideration.[66] There is a broader need in SA to address food environments, and how these can be adapted to support children and adolescents to make healthy food choices, in order to improve overall child health and support growth.[67]
In terms of limitations of the present review article, certain data that have been included should be interpreted with caution. These include self-report PA data, which are likely to be less reliable than objective measures. They also include the body composition data presented by the SA Demographic and Health Survey (SADHS)[56] for adolescents, which used adult BMI cut-offs. Furthermore, the early childhood body composition data from the SADHS present much lower levels of overweight (9.1%) than the SA National Health and Nutrition Examination Survey (SANHANES; 18.2%),[68] which used International Obesity Task Force cut-offs,[65] for this age group. In addition, owing to limited prevalence data, conclusions have mostly been drawn based on smaller, regional studies.
Conclusion
The HAKSA 2018 Report Card provides an evidence-based call to action for all those with a vested interest in the health, development and wellbeing of SA children and adolescents. With the rising prevalence of overweight/obesity and non-communicable diseases in SA adults,[56] the need to establish healthy lifestyle behaviours and promote environments that support healthy choices among children and adolescents is more important than ever. A healthier generation of young South Africans could contribute to the progress and development of our country.
Acknowledgements. In addition to the listed authors, the HAKSA 2018 Report Card Scientific Advisory Group consists of: C Burnett (University of Johannesburg), CJ Christie (Rhodes University), CJ Cook (University of Cape Town), C Cozett (University of the Western Cape), M de Milander (University of the Free State), H Dugmore (Rhodes University), M Faber (SA Medical Research Council), S Krog (University of South Africa), T Liebenberg (Sports Science Institute of SA), Z Mchiza (University of the Western Cape), K McQuaide (Sports Science Institute of SA), ST Meltzer (Sports Science Institute of SA), N Naidoo (University of Cape Town), R Naidoo (University of KwaZulu-Natal), A Prioreschi (University of the Witwatersrand), AE Pienaar (North-West University), T Puoane (University of the Western Cape), B Tromp (SA Heart and Stroke Foundation), M van Gent (University of Fort Hare), C Walter (Nelson Mandela University), E Watson (University of the Witwatersrand).
Author contributions. CED and EVL were co-leaders of the HAKSA 2018 Report Card. CED co-ordinated the scientific advisory group and the compilation of the final lay report, and drafted the manuscript. SAT conducted the literature searches and helped to co-ordinate the review process. In the Scientific Advisory Group, SHB and AM were leaders of the PA group; JH led the nutrition group; and HSK and LKM co-ordinated the body composition group. All authors edited and commented on the manuscript and approved the final version.
Funding. None.
Conflicts of interest. None
References
1. Carson V, Lee E-Y, Hewitt L, et al. Systematic review of the relationships between physical activity and health indicators in the early years (0 - 4 years). BMC Public Health 2017;17(S5):40-31. http://doi.org/10.1186/s12889-017-4860-0 [ Links ]
2. Poitras VJ, Gray CE, Borghese MM, et al. Systematic review of the relationships between objectively measured physical activity and health indicators in school-aged children and youth. Appl Physiol Nutr Metab 2016;41(6 Suppl 3):S197-S239. http://doi.org/10.1139/apnm-2015-0663 [ Links ]
3. Carson V, Hunter S, Kuzik N, et al. Systematic review of sedentary behaviour and health indicators in school-aged children and youth: An update. Appl Physiol Nutr Metab 2016;41(6 Suppl 3):S240-S265. http://doi.org/10.1139/apnm-2015-0630 [ Links ]
4. Poitras VJ, Gray CE, Janssen X, et al. Systematic review of the relationships between sedentary behaviour and health indicators in the early years (0 - 4 years). BMC Public Health 2017;17(S5):540-525. http://doi.org/10.1186/s12889-017-4849-8 [ Links ]
5. Pate RR, O'Neill JR, Liese AD, et al. Factors associated with development of excessive fatness in children and adolescents: A review of prospective studies. Obes Rev 2013;14(8):645-658. http://doi.org/10.1111/obr.12035 [ Links ]
6. Van Horn L, Banks L, Vincent E, McCrindle BW. The importance of nutrition and physical activity for children. Pediatr Ann 2012;41(2):67-72. http://doi.org/10.3928/00904481-20120110-10 [ Links ]
7. Martin A, Booth JN, Laird Y, Sproule J, Reilly JJ, Saunders DH. Physical activity, diet and other behavioural interventions for improving cognition and school achievement in children and adolescents with obesity or overweight. Cochrane Database Syst Rev 2018;3(2):CD009728. http://doi.org/10.1002/14651858.CD009728.pub3 [ Links ]
8. Statistics South Africa. Census 2011. Pretoria: Statistics South Africa, 2012. http://www.statssa.gov.za/census/census_2011/census_products/Census_2011_Methodology _and_Highlights_of_key_results.pdf (accessed 20 January 2019). [ Links ]
9. IndexMundi. IndexMundi - country facts. https://www.indexmundi.com (accessed 20 January 2019). [ Links ]
10. Uys M, Bassett S, Draper CE, et al. Results From South Africa's 2016 Report Card on physical activity for children and youth. J Phys Act Health 2016;13(11 Suppl 2):S265-S273. http://doi.org/10.1123/jpah.2016-0409 [ Links ]
11. Steyn NP, Nel JH, Parker W, Ayah R, Mbithe D. Urbanisation and the nutrition transition: A comparison of diet and weight status of South African and Kenyan women. Scand J Public Health 2012;40(3):229-238. http://doi.org/10.1177/1403494812443605 [ Links ]
12. Draper CE, Basset S, de Villiers A, Lambert EV, Writing Group H. Results From South Africa's 2014 report card on physical activity for children and youth. J Phys Act Health 2014;11(4 Suppl 1):S98-S104. http://doi.org/10.1123/jpah.2014-0185 [ Links ]
13. Aubert S, Barnes JD, Abdeta C, et al. Global Matrix 3.0 Physical activity report card grades for children and youth: Results and analysis from 49 countries. J Phys Act Health 2018;15(S2):S251-S273. http://doi.org/10.1123/jpah.2018-0472 [ Links ]
14. Loney PL, Chambers LW, Bennett KJ, Roberts JG, Stratford PW. Critical appraisal of the health research literature: Prevalence or incidence of a health problem. Chronic Dis Can 1998;19(4):170-176. [ Links ]
15. Muthuri SK, Onywera VO, Tremblay MS, et al. Relationships between Parental education and overweight with childhood overweight and physical activity in 9-11 year old children: Results from a 12-country study. PLoS ONE 2016;11(8):e0147746. http://doi.org/10.1371/journal.pone.0147746 [ Links ]
16. Roman-Vinas B, Chaput J-P, Katzmarzyk PT, et al. Proportion of children meeting recommendations for 24-hour movement guidelines and associations with adiposity in a 12-country study. Int J Behav Nutr Phys Act 2016;13:1-10. http://doi.org/10.1186/s12966-016-0449-8 [ Links ]
17. Sampasa-Kanyinga H, Standage M, Tremblay MS, et al. Associations between meeting combinations of 24-hour movement guidelines and health-related quality of life in children from 12 countries. Public Health 2017;153:16-24. http://doi.org/10.1016/j.puhe.2017.07.010 [ Links ]
18. Van Biljon A, McKune AJ, DuBose DK, Kolanisi U, Semple SJ. Physical activity levels in urban-based South African learners: A cross-sectional study of 7 348 participants. S Afr Med J 2018;108(2):126-131. http://doi.org/10.7196/SAMJ.2018.v108i2.12766 [ Links ]
19. Van Niekerk L-L, du Toit D, Pienaar AE. The correlation between motor proficiency and physical activity in Senior Phase learners in the Potchefstroom area. Health SA Gesondheid 2016;21:348-355. http://doi.org/10.1016..hsag.2016.05.001 [ Links ]
20. Salvini M. Physical activity and health-related quality of life among schoolchildren from disadvantaged neighbourhoods in Port Elizabeth, South Africa. Qual Life Res 2017;27(1):205-216. http://doi.org/10.1007/s11136-017-1707-1 [ Links ]
21. Tibbits MK, Caldwell LL, Smith EA, Vergnani T, Wegner L. Longitudinal patterns of active leisure among South African youth: Gender differences and associations with health risk behaviours. World Leisure J 2015;58(1):60-68. http://doi.org/10.1080/16078055.2015.1089317 [ Links ]
22. Tremblay MS, LeBlanc AG, Carson V, et al. Canadian physical activity guidelines for the early years (aged 0 - 4 years). Appl Physiol Nutr Metab 2012;37(2):345-56. [ Links ]
23. Draper CE, Tomaz SA, Stone M, et al. Developing intervention strategies to optimise body composition in early childhood in South Africa. Biomed Res Int 2017;2017(1):5283457. http://doi.org/10.1155/2017/5283457 [ Links ]
24. Tremblay MS, Chaput J-P, Adamo KB, et al. Canadian 24-hour movement guidelines for the early years (0-4 years): An integration of physical activity, sedentary behaviour, and sleep. BMC Public Health 2017;17(S5):S15-S32. http://doi.org/10.1186/s12889-017-4859-6 [ Links ]
25. Okely AD, Ghersi D, Hesketh KD, et al. A collaborative approach to adopting/ adapting guidelines - the Australian 24-hour movement guidelines for the early years (birth to 5 years): An integration of physical activity, sedentary behavior and sleep. BMC Public Health 2017;17(S5):370-324. http://doi.org/10.1186/s12889-017-4867-6 [ Links ]
26. Tomaz SA. Physical activity and gross motor skills in rural South African preschool children. PhD thesis. Cape Town: University of Cape Town, 2018. https://open.uct.ac.za/handle/11427/29464 (accessed 8 March 2018). [ Links ]
27. Van Heerden A, Hsiao C, Matafwali B, Louw J, Richter L. Support for the feasibility of the ages and stages questionnaire as a developmental screening tool: A cross-sectional study of South African and Zambian children aged 2 - 60 months. BMC Pediatrics 2017;17(1):55. http://doi.org/10.1186/s12887-017-0802-3 [ Links ]
28. Figueroa R, Saltzman J, Jarick Metcalfe J, Wiley A. 'Culture is so interspersed': Child-minders' and health workers' perceptions of childhood obesity in South Africa. J Obes 2017;2017(2):1-14. http://doi.org/10.1155/2017/9629748 [ Links ]
29. Stone M. Perceptions of physical activity in preschool-aged children in urban and rural samples in South Africa. MA thesis. Cape Town: University of Cape Town, [ Links ]
2016. https://open.uct.ac.za/handle/11427/20652 (accessed 8 March 2018). [ Links ]
30. Bartie M, Dunnell A, Kaplan J, et al. The play experiences of preschool children from a low-socioeconomic rural community in Worcester, South Africa. Occup Ther Int 2015;23(2):91-102. http://doi.org/10.1002/oti.1404 [ Links ]
31. Koekemoer K, van Gesselleen M, van Niekerk A, Govender R, van As AB. Child pedestrian safety knowledge, behaviour and road injury in Cape Town, South Africa. Acc Anal Prev 2017;99(A):202-209. http://doi.org/10.1016/j.aap.2016.11.020 [ Links ]
32. Simons A, Koekemoer K, Niekerk AV, Govender R. Parental supervision and discomfort with children walking to school in low-income communities in Cape Town, South Africa. Traffic Inj Prev 2018;19(4):391-398. http://doi.org/10.1080/15389588.2017.1420904 [ Links ]
33. Dietrich JJ, Laher F, Hornschuh S, et al. Investigating sociodemographic factors and HIV risk behaviors associated with social networking among adolescents in Soweto, South Africa: A cross-sectional survey. JMIR Public Health Surveill2016;2(2):e154. http://doi.org/10.2196/publichealth.4885 [ Links ]
34. Prioreschi A, Brage S, Hesketh KD, Hnatiuk J, Westgate K, Micklesfield LK. Describing objectively measured physical activity levels, patterns and correlates in a cross-sectional sample of infants and toddlers from South Africa. Int J Behav Nutr Phys Activity 2017;14:176. http://doi.org/10.1186/s12966-017-0633-5 [ Links ]
35. Cozett C, Bassett SH, Leach L. Factors influencing participation in physical activity among 11- 13-year-old school children in the Western Cape, South Africa. Afr J Phys Health Edu Recreation Dance 2016;22(4):21-28. [ Links ]
36. Silva DAS, Chaput JP, Katzmarzyk PT, et al. Physical education classes, physical activity, and sedentary behavior in children. Med Sci Sports Exerc 2018;50(5):995-1004. http://doi.org/10.1249/MSS.0000000000001524 [ Links ]
37. Uys M, Broyles ST, Draper CE, et al. Perceived and objective neighborhood support for outside of school physical activity in South African children. BMC Public Health 2016;16(1):462. http://doi.org/10.1186/s12889-016-2860-0 [ Links ]
38. Hazell E. Report on the implementation evaluation of the National School Nutrition Programme. Pretoria: JET Education Services, 2016. https://evaluations.dpme.gov.za/evaluations/528 (accessed 8 March 2018). [ Links ]
39. Wesgro. Beverages. Cape Town: Wesgro, 2016. http://www.wesgro.co.za/pdf_repository/2016_06%20Beverages.pdf (accessed 20 June 2018). [ Links ]
40. Katzmarzyk P, Broyles S, Champagne C, et al. Relationship between soft drink consumption and obesity in 9 - 11-year-old children in a multinational study. Nutrients 2016;8(12):770-713. http://doi.org/10.3390/nu8120770 [ Links ]
41. Manyanga T, Tremblay MS, Chaput J-P, et al. Socioeconomic status and dietary patterns in children from around the world: Different associations by levels of country human development? 2017;17:457. http://doi.org/10.1186/s12889-017-4383-8 [ Links ]
42. Child K. Smaller soft drink sizes leave bitter taste of shrinkflation. Johannesburg: TimesLive, 2017. https://www.timeslive.co.za/news/consumer-live/2017-10-25-smaller-soft-drink-sizes-leave-bitter-taste-of-shrinkflation/ (accessed 20 June 2018). [ Links ]
43. Nortje N, Faber M, de Villiers A. School tuck shops in South Africa - an ethical appraisal. S Afr J Clin Nutr 2016;30(3):74-79. http://doi.org/10.1080/16070658.2017.1267401 [ Links ]
44. Nguyen KA, de Villiers A, Fourie JM, Hendricks M. Challenges to implementing the food-based dietary guidelines in the South African primary school curriculum: A qualitative study exploring the perceptions of principals and curriculum advisors. S Afr J Clin Nutr 2016;30(1):15-20. http://doi.org/10.1080/16070658.2016.1230971 [ Links ]
45. Gresse A, Nomvete A, Walter C. Situational analysis: Implementation of the National School Nutrition Programme in low socioeconomic primary schools in Nelson Mandela Bay. J Consumer Sci 2017;2:59-68. [ Links ]
46. Statistics South Africa. Poverty trends in South Africa. Pretoria: Pretoria: StatsSA, 2017. https://www.statssa.gov.za/publications/Report-03-10-06/Report-03-10-062015.pdf (accessed 20 June 2018). [ Links ]
47. Statistics South Africa. Quarterly labour force survey. Pretoria: StatsSA, 2018. http://www.statssa.gov.za/?p=11361 (accessed 5 August 2018). [ Links ]
48. Trading Economics. South Africa food inflation. Trading Economics, 2018. https://tradingeconomics.com/south-africa/food-inflation (accessed 20 June 2018). [ Links ]
49. Statistics South Africa. Community survey 2016. Pretoria: StatsSA, 2016. http://www.statssa.gov.za/?page_id=6283 (accessed 5 August 2018). [ Links ]
50. Mkhawani K, Motadi SA, Mabapa NS, Mbhenyane XG, Blaauw R. Effects of rising food prices on household food security on female-headed households in Runnymede Village, Mopani District, South Africa. S Afr J Clin Nutr 2016;29(2):69-74. http://doi.org/10.1080/16070658.2016.1216504 [ Links ]
51. Hendriks SL, van der Merwe C, Ngidi MS, et al. What are we measuring? Comparison of household food security indicators in the Eastern Cape Province, South Africa. Ecol Food Nutr 2016;55(2):141-162. http://doi.org/10.1080/03670244.2015.1094063 [ Links ]
52. National Department of Health, South Africa. Draft guidelines: Labelling and advertising of foods. Pretoria: NDoH, 2014.http://www.health.gov.za/index.php/shortcodes/2015-03-29-10-42-47/2015-04-30-09-10-23/2015-04-30-09-11-35/category/36-documents-for-comment (accessed 8 March 2018). [ Links ]
53. Wiles NL. The nutritional quality of South African ready-to-eat breakfast cereals. S Afr J Clin Nutr 2017;30(4):93-100. http://doi.org/10.1080/16070658.2017.1319124 [ Links ]
54. BUSINESSTECH. Half of all Woolworths Food stores have moved sweets away from the checkout line. 2016. https://businesstech.co.za/news/lifestyle/134074/half-of-all-woolworths-food-stores-have-moved-sweets-away-from-the-checkout-line (accessed 20 June 2018). [ Links ]
55. Media24. Free fruit for kids when shopping at Pick n Pay. Johannesburg: Media24, 2018. https://www.w24.co.za/SelfCare/Wellness/Mind/free-fruit-for-kids-when-shopping-at-pick-n-pay-20181004 (accessed 20 June 2018). [ Links ]
56. National Department of Health, Statistics South Africa, South African Medical Research Council, ICF. South Africa Demographic and Health Survey 2016: Key indicators. Pretoria: NDoH, Stats SA, SAMRC, ICF, 2017. https://www.statssa.gov.za/publications/Report%2003-00-09/Report%2003-00-092016.pdf (accessed 8 March 2018). [ Links ]
57. Sartorius B, Sartorius K, Taylor M, et al. Rapidly increasing body mass index among children, adolescents and young adults in a transitioning population, South Africa, 2008 - 2015. Int J Epidemiol 2017;47(3):942-952. http://doi.org/10.1093/ije/dyx263 [ Links ]
58. Craig E, Reilly JJ, Bland R. Risk factors for overweight and overfatness in rural South African children and adolescents. J Public Health 2016;38(1):24-33. http://doi.org/10.1093/pubmed/fdv016 [ Links ]
59. Awotidebe A, Monyeki MA, Moss SJ, Strydom GL, Amstrong M, Kemper HCG. Relationship of adiposity and cardiorespiratory fitness with resting blood pressure of South African adolescents: The PAHL Study. J Hum Hypertens 2016;30(4):245-251. http://doi.org/10.1038/jhh.2015.81 [ Links ]
60. Nyathela T, Oldewage-Theron W. Nutritional status and food consumption patterns of primary school children in Orange Farm. Afr J Food Agric Nutr Dev 2017;17(1):11497. http://doi.org/10.18697/ajfand.77.12155 [ Links ]
61. Oldewage-Theron W, Kruger R. The association between diet quality and subclinical inflammation among children aged 6 - 18 years in the Eastern Cape, South Africa. Pub Health Nutr 2016;20(1):102-111. http://doi.org/10.1017/S1368980016001956 [ Links ]
62. Ngwenya NA, Ramukumba TS. Prevalence of adolescent obesity at a high school in the City of Tshwane. Curationis 2017;40(1):S193-S197. http://doi.org/10.4102/curationis.v40i1.1662 [ Links ]
63. Ajayi OR, Matthews G, Taylor M, et al. Factors associated with the health and cognition of 6-year-old to 8-year-old children in KwaZulu-Natal, South Africa. Trop Med Int Health 2017;22(5):631-637. http://doi.org/10.1111/tmi.12866 [ Links ]
64. World Health Organization. Application tools. Geneva: WHO, 2009. http://www.who.int/growthref/tools/en/ (accessed 8 March 2018). [ Links ]
65. Cole TJ, Lobstein T. Extended international (IOTF) body mass index cut-offs for thinness, overweight and obesity. Pediatr Obes 2012;7:284-94. http://doi.org/10.1111/j.2047-6310.2012.00064.x [ Links ]
66. Lobstein T, Jackson-Leach R, Moodie ML, et al. Child and adolescent obesity: Part of a bigger picture. Lancet 2015;385(9986):2510-2520. http://doi.org/10.1016/S0140-6736(14)61746-3 [ Links ]
67. Hawkes C, Smith TG, Jewell J, et al. Smart food policies for obesity prevention. Lancet 2015;385(9985):2410-2421. http://doi.org/10.1016/S0140-6736(14)61745-1 [ Links ]
68. Shisana O, Labadarios D, Rehle T, et al. South African National Health and Nutrition Examination Survey (SANHANES-1). Cape Town: HSRC Press, 2013. http://www.hsrc.ac.za/uploads/pageNews/72/SANHANES-launch%20edition%20(online%20version).pdf (accessed 8 March 2018). [ Links ]
 Correspondence:
C E Draper
catherine.draper@wits.ac.za
Accepted 20 May 2019

