


Servicios Personalizados
Articulo
 Inglés (pdf)
 Articulo en XML
 Referencias del artículo
Indicadores

Links relacionados
-
 Citado por Google
 -
 Similares en Google
Compartir

 Permalink
South African Journal of Child Health
versión On-line ISSN 1999-7671
versión impresa ISSN 1994-3032
S. Afr. j. child health vol.13 no.1 Pretoria abr. 2019
http://dx.doi.org/10.7196/sajch.2019.v13i1.1480
ARTICLE
Comparison of the demographic and diagnostic profile of new patients attending a neurodevelopmental clinic in 2008/2009 and 2016
U RasdienI; A RedfernII; Ρ Ε SpringerIII
IMB ChB; Department of Paediatrics and Child Health, Faculty of Medicine and Health Sciences, Stellenbosch University and Tygerberg Children's Hospital, Cape Town, South Africa
IIMB ChB, FCPaed (SA), MPhil; Department of Paediatrics and Child Health, Faculty of Medicine and Health Sciences, Stellenbosch University and Tygerberg Children's Hospital, Cape Town, South Africa
IIIMB ChB, DCH (SA), DTM&H (Liverpool), FCPaed (SA); Department of Paediatrics and Child Health, Faculty of Medicine and Health Sciences, Stellenbosch University and Tygerberg Children's Hospital, Cape Town, South Africa
ABSTRACT
BACKGROUND: Literature suggests an increasing prevalence of developmental disabilities, and specifically of conditions such as autism and attention deficit/hyperactivity disorder. Lhe resulting burden on paediatric neurodevelopmental services has not been described in the South African setting
OBJECTIVE: Lo compare the demographic and diagnostic profile of new patients attending a neurodevelopmental service across two 12-month periods, after a change in referral pathway and the introduction of a secondary clinic
METHODS: We conducted a retrospective, descriptive cross-sectional folder review of new patients seen in the neurodevelopmental service at Lygerberg Hospital in 2008/2009 and 2016
RESULTS: Lhe number of new patients increased from 84 in 2008/2009 to 240 in 2016. In both periods the majority of patients were male. Lhe median (IQR) age decreased from 62 (31 - 92) months in 2008/2009 to 53 (37 - 67) months in 2016 (£=0.17). In 2008/2009 only one patient was from the Khayelitsha health subdistrict compared with 49 (20.4%) in 2016, following the subdistrict's addition to the hospitals drainage area in 2011. Lhe number of patients referred by allied health professionals increased between the two periods (30.4% in 2016 v. 16.4% in 2008/2009). Cases of autism spectrum disorder (ASD) increased notably: from 10 (8.4%) in 2008/2009 to 84 (35%) in 2016
CONCLUSION: Lhe notable increase in neurodevelopmental referrals over the past 8 years cannot be fully explained by a regional population increase or a change in referral pathway. Lhe number of ASD cases has increased disproportionately, with important implications for health and educational service planning
Lhe World Health Organization estimates that between 2009 and 2015, almost 40% of under-fives in sub-Saharan Africa failed to reach their developmental potential.[1] Cognitive development during early childhood is a strong determinant of future scholastic outcome. Limited research is available from low- and middle-income countries regarding the prevalence of developmental disability or the ease of access to neurodevelopmental services. In South Africa (SA), early identification and access to assessment have long been noted as problematic in ensuring timeous access to specialist clinics.[2] Late detection and intervention in cases of developmental delay may result in a child's failure to achieve developmental potential and can have adverse consequences for long-term quality of life.[3]
Universal childhood developmental surveillance is advocated in SA. However, in reality, developmental surveillance relies on parental concern being raised or careful observation by trained healthcare workers, methods which have been shown to have a low sensitivity.[4] Physicians reported insufficient time during clinic visits as the main reason for not performing formal developmental screens.[5]
Lwo of the authors subjectively noted a rise in referrals to the neurodevelopmental clinic (NDC) at Lygerberg Hospital over the last 5 years, and specifically of children with a final diagnosis of autism spectrum disorder (ASD). Higher referral numbers may be attributed to the increased use of the Road to Health booklets developmental checklist, increased awareness around early childhood development as part of the First 1000 Days campaign, and a health subdistrict with a large under-18 population being added to the hospitals drainage area.
We aimed to quantify the increase in referrals to the Lygerberg neurodevelopmental service by comparing records across two 12-month periods (2008/2009 and 2016) and describing the change in the demographic and diagnostic profile of new patients.
Methods
Design
Lhis study was a retrospective, descriptive cross-sectional folder review, in which records were compared for two 12-month periods: July 2008 - June 2009, and January - December 2016. Complete data sets existed for both these periods, allowing for convenience sampling.
Setting
Lhe study was conducted at Lygerberg Hospital. Lhe hospital serves as the secondary referral centre for general paediatric services for half of the Cape Lown metropole, and as the tertiary referral centre for neurodevelopmental services for half of the Western Cape province. Historic drainage areas include the Northern, Eastern, Winelands, Overberg and Lygerberg health subdistricts. Lhe Khayelitsha subdistrict (KSD) was added in 2011. (Khayelitsha is a predominantly low-income area in the Western Cape, with half of its population under the age of 18 years.[6]) Paediatric neurology services have outreach programmes in the Northern, Eastern, Winelands and Overberg subdistricts.
During the 2008/2009 period, there was a single tertiary referral NDC, managed by an experienced developmental specialist. In 2012, an additional NDC was established on the general specialist platform at Lygerberg Hospital. Lhis facility was initially established as an early-access clinic for new referrals from primary care and to handle less complex cases; however, the number of new referrals to the tertiary clinic resulted in the new second-level clinic dealing with the overflow of Level 3 patients. Referral sources were therefore largely similar for the two clinics, and included tertiary paediatric departments, allied health professionals, district and primary healthcare facilities and, occasionally, private paediatricians and general practitioners. In 2016, the secondary clinic was managed by a general paediatrician/ developmental specialist, whereas the tertiary clinic was managed by a developmental specialist and a subspecialist trainee.
Participants
Basic demographic and diagnostic information was captured for all new patients seen at either of the two clinics, as recorded in the clinic databases. Any patient attending the clinic for the first time was included. Patients attending the clinic for a follow-up visit or patients with incomplete information were excluded.
The details of included patients were anonymised and transferred to a spreadsheet. The information collected included demographic data (date of birth, sex and health subdistrict), referral source and diagnosis. Participants could have more than one diagnosis.
The diagnostic profile of a patient was assessed using the Molteno Adapted Scale (MAS)[7,8] or standard criteria from the fourth or fifth edition of the Diagnostic and Statistical Manual of Mental Disorders (DSM).[9,10] The MAS is a screening tool widely used in developmental services in the Western Cape to assess development in four domains, namely gross motor skills, fine motor skills, language development and personal/social development. It provides mental age equivalents, which allow for subquotients to be calculated for each domain, i.e. standardised scores (mental age/chronological age χ 100). The general developmental quotient (DQ) is the average of the four subquotients. Children under 5 years with two or more subquotients <80 were classified as having global developmental delay, whereas those 5 years and older were classified as having mild (DQ 51 - 70), moderate (DQ 31 - 50) or severe (DQ <30) intellectual disability. ASD, attention deficit/hyperactivity disorder developmental language and co-ordination disorders and specific learning disabilities were diagnosed based on DSM IV[9] criteria in 2008/2009 and DSM V[10] criteria in 2016. Trisomy 21 and other genetic conditions were confirmed by genetic testing, when possible, or diagnosed based on a strong clinical suspicion despite negative genetic testing. Diagnosis of fetal alcohol syndrome, myelomeningocoele or cerebral palsy was based on the presence of clinical features and neuroimaging, where indicated.
Statistical analysis
Statistical analysis was performed using Stata version 14. Descriptive statistics for measured data included medians and interquartile ranges (IQRs) as data were not normally distributed. Frequencies and percentages were calculated based on the total number of participants, as many patients had more than one diagnosis, and are reported as categorical data. A significance level of /K0.05 was used, while 95% confidence intervals (CIs) were reported as needed. Groups were compared using Wilcoxon sum rank tests for measured data, while Fisher's exact test was used for categorical data.[11]
Ethical considerations
The study was approved by the Health Research Ethics Committee of Stellenbosch University (ref. no. U16/10/026). Individual consent from patients was not obtained owing to the retrospective nature of the study. A waiver of consent was obtained from the Health Research Ethics Committee.
Results
For the 2008/2009 study period, 525 patients were seen at the NDC, of whom 84 were new. For the 2016 study period, 998 patients were seen, of whom 240 were new.
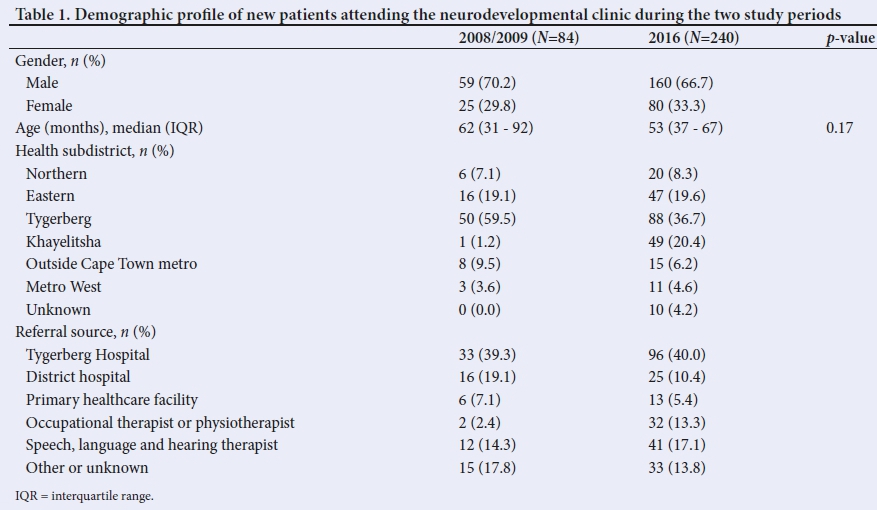
The demographic characteristics of the two groups are outlined in Table 1. In both study periods, the majority of participants were male. The median (IQR) age of first presentation decreased from 62 (31 - 92) months in 2008/2009 to 53 (37 - 67) months in 2016 (p=0.17). Similarly, for both periods the majority of participants were from the Tygerberg subdistrict, but the proportion decreased markedly in 2016 (59.5% v. 36.7%). This was largely due to a substantial increase in referrals from the KSD (n=49; 20.4%).
The majority of participants were referred from within Tygerberg Hospital. However, in the 2016 group, 30.4% of referrals came from allied health professionals as opposed to 16.7% in 2008/2009. A decrease in referrals from healthcare professionals at district and primary healthcare facilities was seen.
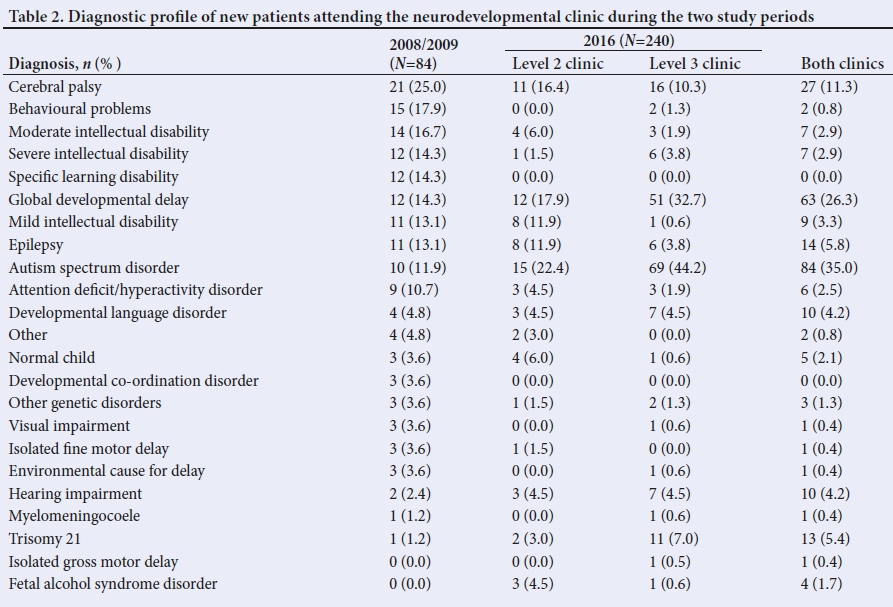
A total of 23 diagnostic categories were identified. Table 2 represents the diagnostic profile over the two study periods. Fig. 1 depicts the most notable changes in the diagnostic profile.
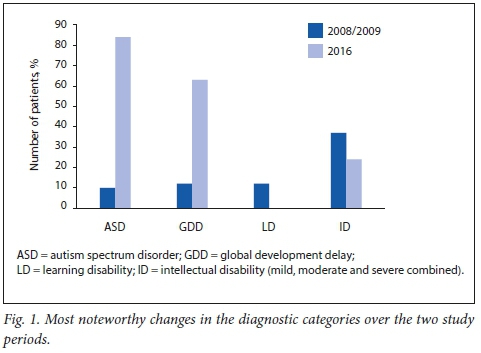
The number of children diagnosed with ASD increased from 10 (11%) in 2008/2009 to 84 (35%) in 2016.
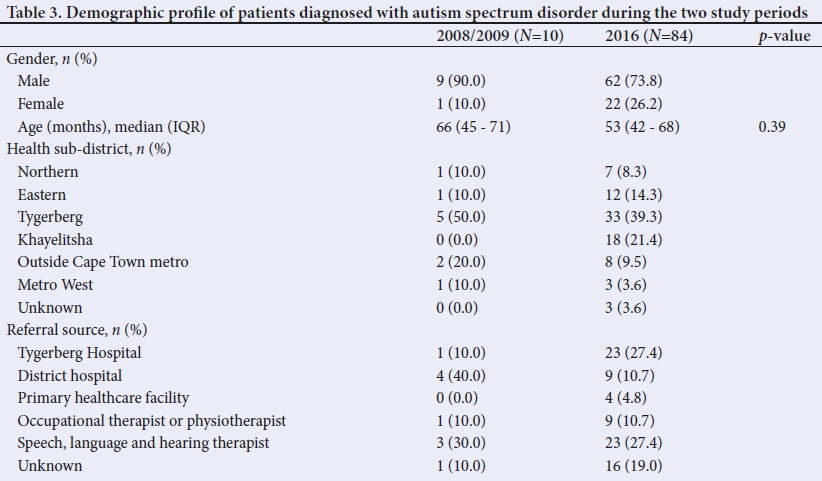
Table 3 compares the demographic profiles of new ASD patients across the two study periods. The median (IQR) age of first presentation was 65.5 (45 - 71) months and 53 (42 - 68) months in the 2008/2009 and 2016 study periods, respectively (p=0.39). The majority of these patients (76%) were male. In 2008/2009, half of the participants were from the Tygerberg health subdistrict. The 2016 study group was more evenly distributed, with 21.3% of participants (n=18) from the KSD. In the 2016 study group, more than 50% of patients ultimately diagnosed with ASD were referred either from Tygerberg Hospital or by speech, language and hearing therapists (SLHTs).
Discussion
Early detection and intervention are known to be beneficial in children with developmental problems. Even in low-income settings, children who received early childhood intervention had better educational and social outcomes than those with less extensive intervention.[12] Therefore, effective universal developmental screening and early access to assessment and intervention are important. Internationally, studies have shown the median first age of presentation to decrease from 56 months to 36 months over a 10-year period.[13] In our study, the median age of first presentation decreased by 9 months (to 53 months) over the full period; this is still late by international standards. Increased awareness and earlier identification of developmental problems may have contributed to this decrease, but it may also be partly explained by the NDC starting to divert children in mainstream schools to the newly formed learner-support teams instituted by the Western Cape Department of Education in the time between the two study periods. This would also explain the lack of specific learning disabilities in the 2016 cohort (Table 2).
The median age of ASD diagnosis decreased by 12.5 months over the two periods. This may represent a real reduction, as the majority of the ASD patients were below schoolgoing age and were also unlikely to have been in mainstream schooling owing to their disability. Therefore, this group would have been unaffected by the NDC policy change to divert children already in school. The reasons for this reduction require further investigation.
The results show that both early identification and early access to assessment and intervention remain significant challenges in our setting, despite the secondary clinic, originally intended to filter referrals to the overburdened tertiary NDC, substantially increasing capacity for new referrals.
Over the two study periods, the number of new patients presenting at the NDC increased threefold. This may be explained, in part, by the addition of the secondary clinic, but waiting times at both clinics remained excessively long despite the increased capacity. A mere increase in population size cannot explain the large increase in referrals; over the two study periods, the provincial under-14 population increased by about 13%,[14,15] whereas the study population increased by 35% between 2008/2009 and 2016. Improved developmental screening or increased awareness of developmental problems in childhood due to government health programmes such as the First 1000 Days campaign may also have played a part.[16]
Although this was not a prevalence study, our findings do raise the question of whether similar trends with regard to developmental disability prevalence are seen in SA as internationally. The Centers for Disease Control and Prevention estimates that 17% of children between 0 and 18 years of age have a developmental disorder.[17] International studies have shown an increasing prevalence in all developmental disabilities in the last decade.[18] New studies to determine the prevalence of developmental disability in SA need to be conducted to accurately determine the need for diagnostic, therapeutic and support services.
Our study has shown a large increase in the number of children diagnosed with ASD. International prevalence of ASD has generally increased, although figures vary among studies. In the US, for example, ASD prevalence has increased from 11 per 1 000 children in 2008[19] to 14.6 per 1 000 children in 2012.[20] A meta-analysis of global ASD prevalence suggests a prevalence of 7.6 per 1 000.[21] Autism South Africa estimates that 1 in 68 SA children are born with autism; however, no peer-reviewed local epidemiological studies on ASD are available. Factors cited for the increasing prevalence include changes in diagnostic criteria, growing awareness among parents and healthcare workers and the development of specialist services.[22] The rising ASD prevalence has also been ascribed to diagnostic substitution; this has been linked to the decreasing prevalence of intellectual disabilities and learning disabilities.[23]
Our study revealed a nearly fourfold increase in participants diagnosed with global developmental delay. The underlying factors require further investigation. The shift in the median age of first presentation over the two study periods - from older than 5 years to younger than 5 years - has likely contributed to and could explain the concomitant reduction in diagnosis of intellectual disability.
There was a notable increase in the number of referrals from the tertiary hospital (1 v. 23) between the two study periods. Our study did not specifically look into the reason for this, but an increasing awareness of the developmental clinic service and easier access to the clinic by telephone or internal mail could have contributed. We also noted a substantial increase in referrals from SLHTs in the two periods (12 v. 41 in 2008/2009 and 2016, respectively). This may be due to the increasing accessibility of SLHTs in the primary healthcare system as a result of the Ideal Clinic programme, which was launched in 2013 and aims to ensure the presence of alliedhealth professionals at primary healthcare facilities.[24] Children seen by SLHTs and identified as having significant language or developmental delay are likely to be referred directly to the NDC for further assessment.
In both study periods, the largest proportion of referrals originated from the Tygerberg health subdistrict, which could be due to the NDC being situated in this subdistrict. Tygerberg Hospital also provides a secondary service to residents of the Tygerberg health subdistrict. Patients residing in health subdistricts outside the metro areas made up the smallest proportion of the referrals, potentially pointing to a lack of screening for developmental disability in rural areas. However, two rural areas that form part of the Tygerberg NDC drainage area have access to paediatric neurologists through outreach programmes, which probably obviates the need for referring patients to the NDC at Tygerberg Hospital.
Incorporating the KSD in the tertiary hospital's drainage area in 2011, between the two study periods, certainly contributed to the large increase in referrals to the NDC. The KSD represents a predominantly black population. US prevalence studies have shown a narrowing in the gap between white and black children diagnosed with ASD.[25] Although race was not captured, our data suggest that ASD may be increasingly recognised in the black African population.
Study limitations
The inclusion of patients into the study was dependent on patient data being correctly entered into the clinic statistics sheets. Records of aetiological and comorbid conditions using ICD 10 coding were thought to be incomplete. We did not distinguish whether allied health professionals were practising at primary, secondary or tertiary facilities, which would have assisted in determining whether the referral pathway was changing from primary healthcare. This was a convenience sample at a single hospital and referral centre and the results may therefore not be generalisable to elsewhere in the SA context.
Conclusion
There has been a notable increase in neuro developmental referrals to the Tygerberg NDC over the past 8 years, which cannot be fully explained by a change in referral areas or increasing population size. The number of children diagnosed with ASD has increased disproportionately, and especially in the black population, as evidenced by the increased number of children with ASD from the KSD. The reasons for this trend require further investigation.
The findings from our study have important implications for planning of diagnostic, therapeutic, educational and support services. The addition of the secondary clinic increased the capacity for attending to new developmental referrals, but did not notably improve waiting times or streamline referrals to the tertiary clinic, probably owing to an increasing prevalence of developmental problems.
Given how common childhood developmental problems are, undergraduate and postgraduate curricula for medical, nursing and allied health professionals need to be critically examined to facilitate early detection and intervention of childhood developmental problems and so that an undue burden is not placed on limited tertiary diagnostic services. The management of chronic health conditions in children remains a problem in our current healthcare system, highlighted by this vulnerable population.
Acknowledgments. We thank Mr Tawanda Chivese (Biostatistics Unit Centre for Evidence-based Health Care, Stellenbosch University) for his assistance with data analysis. We also acknowledge Drs Y Kooblal and A Thomas for their assistance with data collection and Dr Β Laughton for proofreading the manuscript (Department of Paediatrics, Tygerberg Children's Hospital and Stellenbosch University).
Author contributions. UR was responsible for study design, writing the protocol, data collection, interpretation of results and writing the manuscript. AR conceptualised the study and, together with PS, contributed to study design, interpretation of results and preparing the manuscript.
Funding. None.
Conflicts of interest. None.
References
1. World Health Organization. Global health observatory data repository. Children who are developmentally on track, 2017. http://apps.who.int/gho/data/node.main.GSWCAH35?lang=en (accessed 20 July 2017). [ Links ]
2. Venketramen J, Petersen R, Donald KA. Neurodevelopmental profile of new patients who present to the developmental service of Red Cross War Memorial Children's Hospital. Paper presented at the 19 Congress of the South African Association of Child & Adolescent Psychiatry and Allied Professions. Stellenbosch, South Africa; 8 September 2017. [ Links ]
3. Miller AR, Armstrong RW, Masse LC, Klassen AF, Shen J, O'Donnell ME. Waiting for child developmental and rehabilitation services: An overview of issues and needs. Dev Med Child Neurol 2005;50(11):815-821. https://doi.org/10.1111/j.1469-8749.2008.03113.x [ Links ]
4. Drotar D, Stancin T, Dworkin P, Sices L, Wood S. Selecting developmental surveillance and screening tools. Pediatr Rev 2008;29(10):52-58. https://doi.org/10.1542/pir.29-10-e52 [ Links ]
5. Ertem IO, Pekcici EB, Gok CG, Ozbas S, Ozcebe H, Beyazova U. Addressing early childhood development in primary health care: Experience from a middle-income country. J Dev Behav Pediatr 2009;30(4):319-326. https://doi.org/10.1097/dbp.0b013e3181b0f035 [ Links ]
6. Statistics South Africa. Census 2011. http://www.statssa.gov.za/publications/census/census_2011.pdf (accessed 19 July 2017). [ Links ]
7. Laughton, B. The reliability of the Molteno Adapted Scale in predicting developmental outcomes at 2 years in prematurely born very low birth weight infants. MSc dissertation. Johannesburg: University of the Witwatersrand, 2010. http://hdl.handle.net/10539/9395 [ Links ]
8. Laughton B, Dhar P, Springer P, Saunders HH. Correlation between the Molteno adapted scale and the Griffiths mental development scales at 11.5 and 21 months. Annual academic day Department of Paediatrics, Stellenbosch University. Stellenbosch, South Africa; 17 August 2011. [ Links ]
9. American Psychiatric Association. Diagnostic and Statistical Manual of Mental Disorders. 4th ed., text revision. Washington DC: APA, 2000. [ Links ]
10. American Psychiatric Association. Diagnostic and Statistical Manual of Mental Disorders. 5th ed. Arlington: APA, 2013. [ Links ]
11. StataCorp. Stata Statistical Software Release 14. College Station: StataCorp. 2013. [ Links ]
12. Reynolds AJ, Temple JA, Robertson DL, Mann EA. Long-term effects of an early childhood intervention on educational achievement and juvenile arrest: A 15-year follow-up of low-income children in public schools. JAMA 2001;285(18):2339-2346. https://doi.org/10.1001/jama.285.18.2339 [ Links ]
13. Christensen DL, Bilder DA, Zahorodny W et al. Prevalence and characteristics of autism spectrum disorder among children aged 8 years - autism and developmental disabilities monitoring network, 11 sites, United States, 2012. MMWR Surveill Summ 2016;65(3):l-23. https://doi.org/10.15585/mmwr.ss6503al [ Links ]
14. Statistics South Africa. South African Statistics, 2009. http://www.statssa.gov.za/publications/SAStatistics/SAStatistics2009.pdf (accessed 18 July 2017). [ Links ]
15. Statistics South Africa. Mid-year population estimates 2016. https://www.statssa.gov.za/publications/P0302/P03022016.pdf (accessed 18 July 2017). [ Links ]
16. Western Cape Government. First 1000 days, https://www.westerncape.gov.za/first-lOOO-days (accessed 5 June 2018). [ Links ]
17. Centers for Disease Control and Prevention. Child development. http://www.cdc.gov/ncbddd/child/devtool.htm (accessed 17 July 2017). [ Links ]
18. Boyle CA, Boulet S, Schieve LA, et al. Trends in the prevalence of developmental disabilities in US children, 1997-2008. Pediatrics 2011;127(6):1034-1042. https://doi.org/10.1542/peds.2010-2989d [ Links ]
19. Autism and Developmental Disabilities Monitoring Network Surveillance Year 2008 Principal Investigators, Centers for Disease Control and Prevention. Prevalence of autism spectrum disorder - Autism and developmental disabilities monitoring network, 14 sites, United States, 2008. MMWR Surveill Summ 2012;61(3):1-19. https://doi.Org/10.3410/f.717747905.793252855 [ Links ]
20. Developmental Disabilities Monitoring Network Surveillance Year 2010 Principal Investigators, Centers for Disease Control and Prevention. Prevalence of autism spectrum disorder among children aged 8 years - Autism and developmental disabilities monitoring network, 11 sites, United States, 2010. MMWR Surveill Summ 2014;63(2):1-21. https://doi.org/10.15585/mmwr.ss6503al [ Links ]
21. Baxter AJ, Brugha TS, Erskine HE, Scheurer RW, Vos Τ, Scott JG. The epidemiology and global burden of autism spectrum disorders. Psychol Med 2015;45(3):601-613. https://doi.org/10.1017/s003329171400172x [ Links ]
22. Wing L, Potter D. The epidemiology of autistic spectrum disorders: Is the prevalence rising? Ment Retard Deve Disabil Res Rev 2002;8(3):151-161. https://doi.org/10.1002/mrdd.10029 [ Links ]
23. Shattuck PT. The contribution of diagnostic substitution to the growing administrative prevalence of autism in US special education. Pediatrics 2006;117(4):1028-1037. https://doi.org/10.1542/peds.2006-1720 [ Links ]
24. National Department of Health. Ideal Clinic Manual. Pretoria: NDoH; 2016. [ Links ]
25. Baio J, Wiggins L, Christensen DL. Prevalence of autism spectrum disorder among children aged 8 years - Autism and developmental disabilities monitoring network, 11 sites, United States, 2014. MMWR Surveill Summ 2018;67(6):l-23. https://doi.org/10.15585/mmwr.ss6706al [ Links ]
 Correspondence:
U Rasdien
urasdien93@gmail.com
Accepted 23 August 2018

