


Services on Demand
Article
 English (pdf)
 Article in xml format
 Article references
Indicators

Related links
-
 Cited by Google
 -
 Similars in Google
Share

 Permalink
South African Journal of Child Health
On-line version ISSN 1999-7671
Print version ISSN 1994-3032
S. Afr. j. child health vol.12 n.3 Pretoria Jul./Sep. 2018
http://dx.doi.org/10.7196/sajch.2018.v12i3.1475
ARTICLE
Blood pressure pattern and the relationship with body mass index among apparently healthy secondary-school students in Sokoto metropolis, Nigeria
K O IsezuoI; N M JiyaII; L I AuduIII; P K IbitoyeII; U M SaniII; T YusufIII; B I GarbaIII; A AdamuII; F B JiyaIII
IMBBS, FWACP, FMCPaed; Department of Paediatrics, Usmanu Danfodiyo University Teaching Hospital, Sokoto, Nigeria
IIMBBS, FWACP; Department of Paediatrics, Usmanu Danfodiyo University Teaching Hospital, Sokoto, Nigeria
IIIMBBS, FMCPaed; Department of Paediatrics, Usmanu Danfodiyo University Teaching Hospital, Sokoto, Nigeria
IVMBBS, FMCPaed; Department of Paediatrics, National Hospital, FCT Abuja, Nigeria
ABSTRACT
BACKGROUND. Childhood obesity may result in the premature onset of cardiovascular risk factors, particularly hypertension, hence the need for proper screening. However, blood pressure (BP) is measured only once in most studies in Nigeria, probably because of difficulties in returning to the study areas for repeat measurement.
OBJECTIVE. To determine the BP pattern and assess its relationship with body mass index (BMI) in apparently healthy secondary-school students aged 10 - 18 years in Sokoto metropolis, Nigeria.
METHODS. This study was descriptive and cross-sectional, and carried out between 13 October 2014 and 30 January 2015. In total, 800 students from 6 schools were selected through multistage sampling. BP was measured on three separate days according to the National High Blood Pressure Education Program charts. BMI was categorised according to the Centers for Disease Control charts. The relationship of BP level with BMI was determined.
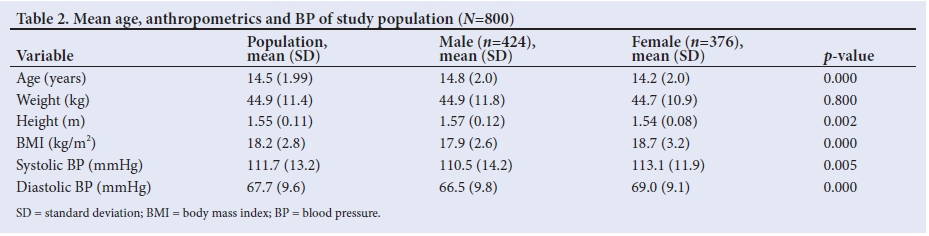
RESULTS. There were 424 (53.0%) males and 376 (47.0%) females, with a ratio of approximately 1:1. BP increased with age. The mean systolic and diastolic BP was significantly higher in females than males (systolic 113.1 mmHg v. 110.5 mmHg, and diastolic 69.0 mmHg v. 66.5 mmHg, respectively; p=0.01). Females had a higher mean BMI than males (18.7 kg/m2 v. 17.9 kg/m2, respectively; p<0.01). BP increased as the BMI percentile increased (p<0.001). The prevalence rates of hypertension were 6.1%, 3.5% and 3.1% at the first, second and third screenings, respectively, while the corresponding prevalence rates of prehypertension were 14.3%, 8.4% and 7.1%. The prevalence of obesity and overweight was 0.3% and 5.9%, respectively.
CONCLUSION. The prevalence rate of prehypertension and hypertension reduced with subsequent measurements, and the prevalence rates of overweight and obesity were low. However, higher BP levels were associated with higher BMI, supporting its predictive significance for elevated BP.
Hypertension in children and adolescents is defined as average systolic and/or diastolic blood pressure (BP) levels above or equal to the 95th percentile for age, gender and height, taken on three or more separate occasions at least a week apart.[1] Prehypertension is defined as BP levels higher than the 90th but below the 95th percentile.[1] If elevated on the first day, it is required to measure it again on at least two more occasions. However, if normal on the first occasion, it is not necessary to repeat the measurement till the next routine checkup.[1] Childhood BP tracks into adulthood, as children tend to maintain their percentile levels as they grow. Early detection, follow-up and adequate treatment of hypertension reduces cardiovascular morbidity and mortality, both in children and adults.[1]
Childhood obesity, defined as excessive body fat accumulation that constitutes a health risk to a person <18 years old, is a major risk factor for hypertension in children.[2] The actual amount of body fat is difficult to measure directly, because the methods are cumbersome and expensive. Body mass index (BMI) is widely used as an indirect measure to define and track obesity in childhood. It is easy to measure, and correlates reasonably well with body fat mass, with a moderate sensitivity of 80% and high specificity of 95%.[3] Growth standards using BMI have been established by the International Obesity Taskforce cut-offs of the Centers for Disease Control and Prevention (CDC) growth charts and World Health Organization BMI z-score values.[2]
In Nigeria, some studies have shown a high prevalence of hypertension of 5% - 10% among children in urban centres in the southern part of the country.[4-6] Most studies from northern Nigeria among adolescents have used adult criteria to define hypertension, which may not correctly reflect the burden.[7] The reported prevalence of obesity among children also from the south ranges between 2.8% and 9.4%,[5,8,9] which is much higher than figures from the north, which range from 0.84% to 1.4%.[10-12] There is a paucity of reports on BP and BMI among adolescents in northern Nigeria, and most studies have not repeated BP measurements according to the National High Blood Pressure Education Program (NHBPEP) guidelines. The present study determined the BP pattern, its relation to BMI, and the prevalence of hypertension and prehypertension among adolescents attending secondary school in Sokoto metropolis, north-western Nigeria.
Methods
Study location
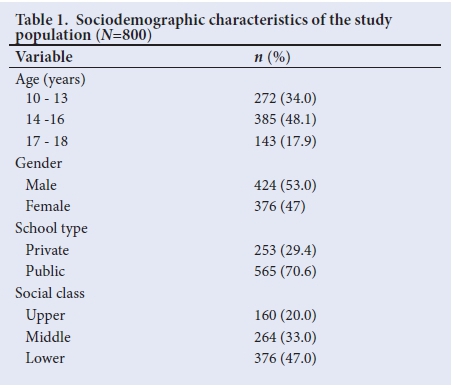
The study was carried out in secondary schools in the Sokoto metropolis, the capital city of Sokoto State in Nigeria. Based on 2006 census figures of 427 760,[13] the projected population in 2015, at an annual growth rate of 3%, was 558 130. The three local government areas that constitute the metropolis are Sokoto North, Sokoto South and Wammako. Inhabitants are mainly Hausa and Fulani; however, other ethnic groups are also resident in the state. A cross-section of all socioeconomic classes is shown in Table 1.
Study population
The study population comprised students aged 10 - 18 years from secondary schools in Sokoto metropolis.
Study design
This was a descriptive and cross-sectional study. It was conducted between 13 October 2014 and 30 January 2015.
Sample size determination
The minimum sample size was calculated using a formula for qualitative cross-sectional studies. A prevalence of 50% was assumed, since there was no previous study in the area.[14] This yielded a sample size of 384, which was approximately doubled to 800, as the study was not invasive, to increase the validity of the results.
Sample selection process
The study participants were selected through a multistage sampling process. Firstly, two schools (one public and one private) were selected by simple random sampling from each of the three local government areas, giving a total of six schools. Coeducational schools were used because there were few or no private schools represented among the non-coeducational schools.
Secondly, the total sample size was proportionally divided among the six schools, based on the individual schools' population. Thirdly, one class each was selected from the six levels (Junior Secondary School 1 - 3 and Senior Secondary 1 - 3), giving six classes from each school. The proportion of the sample size allocated to each school was divided among the six classes selected, according to the class population. Lastly, students were selected from the classes by systematic random sampling.
Data collection
Data were collected using a structured pretested questionnaire to record each subject's demographic data, anthropometry and BP readings. Details such as a family history of hypertension were obtained by contacting the parents of the subjects, who completed a mini-questionnaire. Other tools of data collection were mercury sphygmomanometers with cuffs of different sizes, a Littmann stethoscope, a shrink-resistant non-distensible tape for measuring mid-arm circumference, a Camry Electronic Weighing Scale, stature meter, NHBPEP BP tables for children based on age, gender and height, and the CDC BMI and height centile charts.
The participants were lightly dressed in school uniform, without shoes, stockings, caps, sweaters or jackets, and all pockets were emptied. Weight was measured for all subjects using a battery-powered electronic weighing scale. Measurements were taken to the nearest 1 g. Height was measured with a stature meter mounted on a flat wall surface, to the nearest 0.1 cm. The students stood erect with their heels, buttocks, shoulders and occiput against the wall, so that the external auditory meatus and lower border of the eyes were on the same horizontal plane.
BMI was derived from the ratio of weight (kg) to height squared (m2) for each subject, as kg/m2. The percentile of each subject's BMI was determined from the CDC centile chart for BMI designed for boys and girls aged 2 - 20 years.
BP was measured with an appropriately sized cuff, according to standard procedure.[1] The BP percentile was determined using the NHBPEP BP tables for children based on age, gender and height. A subject was normotensive if his/her BP was below the 90th percentile. BP values between the 90th and 95th percentiles indicated prehypertension. However, if a subject's BP was greater than 120/80 mmHg, the patient was considered to be prehypertensive even if the value was less than the 90th percentile. If the subject's systolic or diastolic BP was at or above the 95th percentile, he/she was possibly hypertensive. Subjects with elevated BP at or above the 90th percentile had repeat measurements on two further visits, a week apart, within the following 2 weeks.[1]
Socioeconomic classification was based on the method described by Oyedeji.[15] Index scores were awarded to each child based on the occupation and educational attainment of the parents or caregivers, separated into upper, middle and lower classes.
Ethical approval
The study was approved by the Ethics Committee of Usmanu Danfodiyo University Teaching Hospital, Sokoto, and the Ministry of Education of Sokoto State (ref. no. UDUTH/HERC/2013/NO.115). The principals of the sampled schools and teachers of the sampled classes gave permission for the study. Written informed consent was obtained from parents or caregivers, and assent from the participating students.
Statistical analysis
Data entry and analysis were done using Statistical Package for Social Sciences (SPSS) version 22.0 (IBM Corp., USA). Continuous variables were presented as means and standard deviations. Comparison between the means of two groups was done using Student's f-tests, and between more than two groups using analysis of variance (ANOVA). Categorical variables were presented as percentages, and compared using a X test or Fisher's exact test, where applicable. The relationship between continuous variables was assessed using the Pearson correlation.
Binary logistic regression analysis was used to predict the probability ofhaving elevated BP, which was classified dichotomously as either normal or elevated (comprising both prehypertension and hypertension). The independent variables entered into the model as covariates included continuous variables (age and BMI) and categorical variables (gender and socioeconomic class). The beta coefficients, odds ratio (OR) and 95% confidence intervals (95% CI) were determined. A p-value <0.05 was considered statistically significant.
Results
Sociodemographic characteristics
The study subjects comprised 800 adolescents from 6 schools, 565 (70.6%) from public and 235 (29.4%) private schools. The male to female ratio was 1:1. Their mean (standard deviation) age was 14.5 (2.0) years (95% CI 14.3 - 14.6). Most (48.1%) were mid-adolescents within the age range of 14 - 16 years (Table 1).
Mean age, anthropometric parameters and BP
Table 2 shows the mean characteristics of the study population including age, weight, height, BMI and BP levels. Males had a higher mean age, but females had significantly higher mean BMI and BP levels (p<0.01).
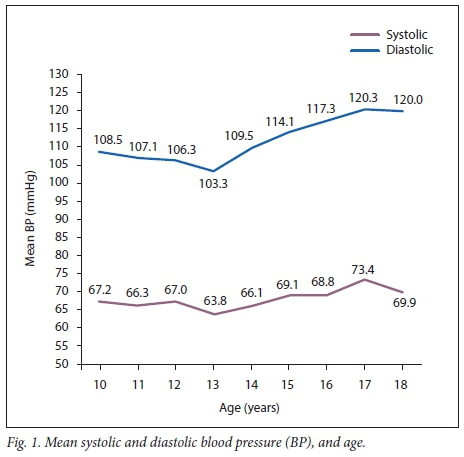
BP level and age: Fig. 1 shows that both the mean systolic and diastolic BP increased with age. There was a statistically significant rise of mean systolic and diastolic BP from age 13 years to 18 years (F=25.1, p=0.001; F=8.1, p=0.001, respectively). It was observed that the mean BP was higher in females than males between the ages of 12 and 16 years.
BMI, age and gender: The mean BMI increased with age, and was initially higher in males at the ages of 10 - 11 years, and then became consistently higher in females until 18 years (p<0.01). There was a slight lowering of BMI noted at age 13 years for both males and females. The prevalence of overweight was 5.9% (47/800), while that of obesity was 0.3% (n=2/800). The overweight subjects were mainly females, accounting for 63.8% (n=30/47), while the obese subjects were both females (p=0.001).
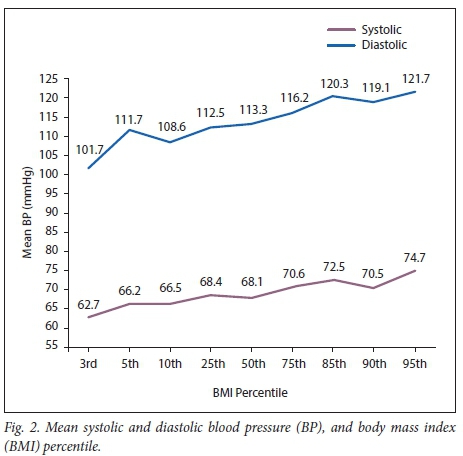
BP levels and BMI: The mean systolic and diastolic BP levels increased as the BMI percentile increased from the 3rd to the 95th percentile (Fig. 2) (p<0.01).
BP and socioeconomic status: The mean systolic and diastolic BP levels were highest in the upper socioeconomic class, and decreased steadily from the upper through the middle to lower class. This relationship was also significant using ANOVA (F=6.3, p<0.01; F=5.9, p<0.01 for systolic and diastolic BP, respectively).
BP and family history of hypertension: The subjects with a family history of hypertension in both parents had higher mean BP levels than those who had one parent with hypertension or none.
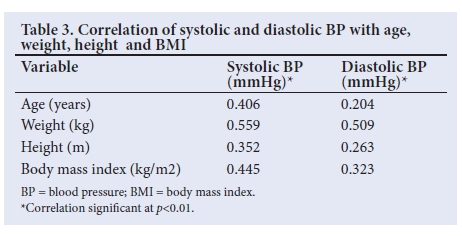
Correlation of BP with BMI and other continuous variables: BMI, age, weight and height showed a low to moderate positive correlation with BP (Table 3). Correlation coefficient values were, however, lower for diastolic compared with systolic BP. The highest correlation value was seen for weight, followed by BMI.
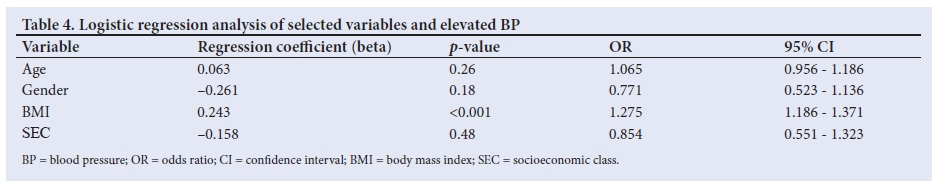
Logistic regression analysis of BMI and other variables with BP: On logistic regression analysis, the independent variables in the model used to predict the outcome of BP were age, gender, socioeconomic class and BMI. Overall, the model fit was good, and could predict BP with 81.1% precision. Together, the independent variables were responsible for 15% of the variation in BP. The OR of BMI predicting an elevated BP level was 1.3 (p<0.001). The effects of age, socioeconomic class and gender were not significant (Table 4).
Prevalence of prehypertension and hypertension
Of the 800 subjects, 637 (79.6%) had normal systolic and diastolic BP at the first measurement (<90th percentile), while 114 (14.3%) had prehypertension (>90th to <95th percentile) and 49 (6.1%) were hypertensive (BP >95th percentile) (Fig. 3).

A week later, the 163 (20.4%) subjects with elevated BP were measured a second time. Of the total sample of 800, 67 (8.4%) had prehypertension, while 28 (3.5%) had hypertension. Two weeks after the initial measurement, 60/800 (7.5%) had prehypertension, while 25 (3.1%) had hypertension. Seven subjects (0.9%) did not have their BP measured during the third screening because they were lost to follow-up. These had their assessments based on the two previous BP levels, as their second screening was normal.
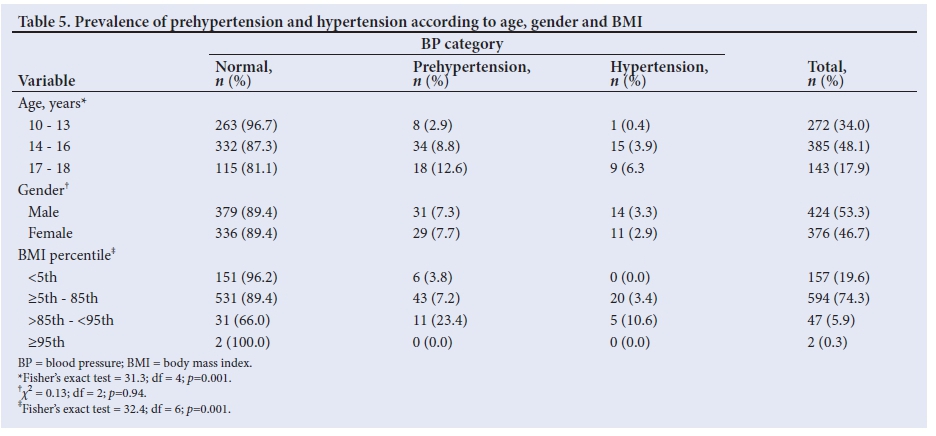
Age, gender and BMI effects: The prevalence of prehypertension and hypertension increased with age (p=0.01). Prehypertension was higher among females than males, but hypertension was higher among males than females (p=0.93). The percentage of those with prehypertension and hypertension increased as BMI increased (p=0.001) (Table 5). It was noted, however that two subjects with BMI above the 95th percentile for age had normal BP levels.
Discussion
The present study found that BP increased with age, BMI and social class. Both the mean systolic and diastolic BP, and BMI were found to be higher in females than males. The prevalence of hypertension and prehypertension was higher initially in the first measurement, but reduced with subsequent measurements.
The mean systolic and diastolic BP levels in this study were similar to those reported by Bugaje et al.,[7] Ujunwa et al.[16] and Mijinyawa et al.[17] in Zaria, Enugu and Kano, respectively, but higher than values from Lagos, Abeokuta and Sagamu in South West Nigeria.[18-20]Studies from South Africa and India showed higher mean levels of diastolic BP[21,22] Differences in BMI and social class in other studies, when compared with ours, may be responsible for the variation, as well as the devices used for BP measurement. The auscultation method with a mercury sphygmomanometer used in this study is the gold standard and measures BP more accurately than automated devices.[23]
The mean BP level increased with age. BP in adolescence usually exhibits a rapid age-related rise around mid-adolescence (14 - 16 years old) owing to the hormonal influences and weight gain of puberty. A rapid rise in mid-adolescence was reported by Bugaje et al.[7]and Ujunwa et al.[16] in Nigeria. The finding of a relatively lower BP at the age of 13 in this study could be due to the lower BMI at that age.
The mean systolic and diastolic BP was higher in females than males, as reported in previous studies,[16,17,20] and could be attributed to the higher BMI of the females. However, mean systolic BP was found to be higher among males in other studies, even though females still had a higher BMI.[18,19,22] These findings suggest that factors other than BMI may also play important roles in the determination of BP among adolescents.
The mean BP level was higher for the upper socioeconomic class and lowest in those of lower socioeconomic status. A study from Northern India[24] showed a similar pattern of a rise in BP from social class V up to social class I. Ogboye et a!.[18] also demonstrated a similar relationship in their study in Lagos. Reasons for increasing BP levels as socioeconomic status rises include a sedentary lifestyle, and indulgence in unhealthy fast foods that have a high energy and high fat content, leading to overweight.
The differences in mean BP levels according to the family history of hypertension may suggest that genetic factors have a role to play in BP. Studies by Patel et a!.,[22] Mahajan et al.[24]and Nur et a!.[25] also demonstrated this. This genetic susceptibility to developing primary hypertension results from the effects of multiple genes involved in renal sodium transport, modulated by various environmental determinants including diet, lifestyle and probably stress.[26]
The relationship between BP and BMI
Mean BP levels increased as the BMI percentile increased. None of those with BMI below the 5th centile had elevated BP, while 14.9% of those who were overweight did, a result similar to that of a study where only 2% of children with a BMI below the 5th percentile had high BP, compared with 12% of children with BMI in the 95th percentile.[27]
There was a moderately positive correlation of BP with BMI, age, weight and height. Similar findings were reported by Ogboye et a!.[18] in Lagos and Nur et a!.[25] in Turkey. BMI was the only significant predictor for elevated BP. These findings are consistent with the existing literature, as the measure of adiposity used in this study (BMI) was also positively associated with BP.
The prevalence of hypertension and prehypertension
The prevalence of hypertension was lower than that of prehypertension across all three measurements, which is similar to the results of studies in Enugu,[16] India[22] and Houston, USA.[26] However, in a study in Uyo,[28] Nigeria, among 3 - 17-year-old children, prehypertension was lower, probably because their study was not limited only to adolescents in whom prehypertension is commoner. Prehypertension presents a clear risk for future persistent hypertension and cardiovascular disease, warranting follow-up.[29]
The prevalence of both hypertension and prehypertension had reduced by half by the third measurement. Ujunwa et a!.[16]and Patel et al.[22] also noted this trend of a reduction in the prevalence of hypertension and prehypertension in BP readings at subsequent visits. The reasons for this may be regression to mean values with repeat measurement, and familiarity with the procedure and a consequent reduction in anxiety.
The prevalence of hypertension found in the present study (3.1%) is similar to the 3.7%, 3.6% and 3.2% reported by Bugaje et a!.,7 Mijinyawa et a!.,[17] and Okpere et a!.[30] from Zaria, Kano and Port Harcourt, respectively. However, the prevalence in this study was based on repeated measurements. The lower prevalence of 2.5% reported in Lagos[18] could be due to the automated BP devices used, which sometimes give less reliable readings than mercury devices.[23]
The prevalence of hypertension of 3.1% in this study over the series of three measurements is lower than the 5.4% reported by both Ujunwa et a!.[16] and Patel et a!.,[22] and the 4.4% found by Nur et a!.[25] (also across three measurements). This may be because the prevalence of overweight and obesity was found to be lower in the present study, probably as a result of differences in lifestyle and dietary patterns. Hypertension was significantly related to overweight in this study, which is similar to the findings of the above-mentioned studies, showing that higher rates of overweight lead to a greater incidence of hypertension in young populations, which may track into adulthood if not checked.
The prevalence of hypertension and prehypertension was found to increase with age, and was highest in the late adolescent age group (aged 17 - 18 years), as has been seen in other studies.[16,21] The prevalence of hypertension was slightly higher in males, while that of prehypertension was higher in females. A similar trend has been seen in other studies,[16,24] where females tended to have a higher prevalence of hypertension and obesity, probably due to the hormonal influence of puberty. Additionally, sociocultural factors that do not afford female adolescents opportunities for as much outdoor activity and exercise as their male counterparts may also be contributory.
Conclusion
BP was found to increase with age among the subjects, and was higher in females than males, and higher in upper than lower socioeconomic class subjects.
BMI was higher in females than males, and BP increased as the BMI percentile of the subject increased, supporting the premise of its predictive significance.
Recommendations
Other measures of assessing overweight, such as waist circumference or skinfold thickness, may be related to BP patterns. Adolescents, especially those who are overweight or obese, should have regular BP monitoring in early, mid and late adolescence, with repeat measurements if the levels are elevated.
Acknowledgements. The authors are grateful to the participating schools and students for their co-operation. We also thank Mr Abubakar Bala Gusau of Nursing Department, Uduth Sokoto and Drs Kehinde Aro and John Anusien who helped during the data collection process.
Author contributions. KOI conceptualised the topic, wrote the initial draft and carried out the analysis. NMJ, LIA, PKI and UMS critically reviewed the work for intellectual content. YT, BIG, AA and FBJ contributed to the data analysis and literature searches. All authors read and approved the final draft.
Funding. None.
Conflicts of interest. None.
References
1. National High Blood Pressure Education Program, Working Group on High Blood Pressure in Children, Adolescents. The fourth report on the diagnosis, evaluation, and treatment of high blood pressure in children and adolescents. Pediatrics 2004;114(2 Suppl 4th report):S555-S576. https://catalog.nhlbi.nih.gov/sites/default/files/publicationfiles/505-5267.pdf (accessed 3 July 2014). [ Links ]
2. Dietz WH. Overweight in childhood and adolescence. New Engl J Med 2004;350(9):855-857. https://doi.org/810.1056/NEJMp048008 [ Links ]
3. Freedman DS, Sherry B. The validity of BMI as an indicator of body fatness and risk among children. Pediatrics 2009;124(Suppl 1):S23-S34. https://doi.org/10.1542/peds.2008-3586E [ Links ]
4. Ejike CE, Ugwu CE, Ezeanyika LU. Variations in the prevalence of point (pre) hypertension in a Nigerian school-going adolescent population living in a semi-urban and an urban area. BMC Pediatrics 2010;10(1):13-19. https://doi.org/10.1186/1471-2431-10-13 [ Links ]
5. Oduwole AA, Ladapo TA. Obesity and elevated blood pressure among adolescents in Lagos, Nigeria: A cross-sectional study. BMC Public Health 2012;12(1):616. https://doi.org/10.1186/1471-2458-12-616 [ Links ]
6. Abiodun AG, Egwu MO, Adedoyin RA. Anthropometric indices associated with variation in cardiovascular parameters among primary school pupils in Ile-Ife. Int J Hypertens 2011;186194:1-5. https://doi.org/10.4061/2011/186194 [ Links ]
7. Bugaje AM, Yakubu AM, Ogala WN. Prevalence of adolescent hypertension in Zaria. Nig J Paeditr 2005;32(4):77-82. http://doi.org/10.4314/njp.v4332i4314.12121 [ Links ]
8. Izuora AN, Animasahun BA, Nwodo U, Ibeabuchi NM, Njokanma OF, Renner JK. Assessment of overweight and obesity among Nigerian children and adolescents using triceps skin-fold thickness and body mass index. Clin Obesity 2013;3(3-4):103-111. https://doi.org/110.1111/cob.12016 [ Links ]
9. Chinedu S, Eboji O, Emiloju O. Trends in weight abnormality of school children and adolescents in Nigeria. J Med Sci 2012;12(7):239-243. http://docsdrive.com/pdfs/ansinet/jms/2012/2239-2243.pdf (accessed 12 March 2018). [ Links ]
10. Mijinyawa MS, Abdul A, Habib AG. Pattern of blood pressure in adolescents. Sahel Med J 2012;12(4):159-164. http://www.smjonline.org/temp/SahelMedJ124159-2316587_2062605.pdf (accessed 31 January 2018). [ Links ]
11. Yusuf S, Mijinyawa M, Musa B, Gezawa I, Uloko A. Overweight and obesity among adolescents in Kano, Nigeria. J Metabolic Synd 2013;2(1):126. https://doi.org/10.4172/2167-0943.1000126 [ Links ]
12. Ahmad MM, Ahmed H, Airede K. Body mass index among school adolescents in Sokoto, North-Western Nigeria. Sahel Med J 2013;16(1):5-9. https://doi.org/10.4103/1118-8561.112049 [ Links ]
13. Ministry of Commerce, Industry and Tourism, Sokoto. Sokoto State Business Directory. A publication of the Commerce Department. Sokoto: Ministry of Commerce, Industry and Tourism, Sokoto, 2007;14-18. [ Links ]
14. Araoye MO. Sample size calculation. In: Araoye M (ed). Research Methodology with Statistics for Health and Social Sciences. Ilorin: Nathdex, 2004;115-121. [ Links ]
15. Oyedeji GA. Socioeconomic and cultural background of hospitalised children in Ilesha. Nig J Paediatr 1985;12(4):111-117. http://www.njpaediatrics.com/1985/v12n4/2Socio%20economic%20and%20Cultural %20Background%20of%20Hospitalized%20Children%20in%20Ilesha.pdf (accessed 12 Mach 2018). [ Links ]
16. Ujunwa FA, Ikefuna AN, Nwokocha ARC, Chinawa JM. Hypertension and prehypertension among adolescents in secondary schools in Enugu, South East Nigeria. Ital J Pediatr 2013;39:70. https://doi.org/10.1186/1824-7288-39-70 [ Links ]
17. Mijinyawa MS, Iliyasu Z, Borodo MM. Prevalence of hypertension among teenage students in Kano, Nigeria. Niger J Med 2008;17(2):173-178. https://www.ncbi.nlm.nih.gov/pubmed/18686834 (accessed 12 January 2018). [ Links ]
18. Ogboye AO. Blood pressure and its correlates in children and adolescents in urban Nigeria. Warwick: University of Warwick, 2012. http://go.warwick.ac.uk/wrap/56120 (accessed 13 June 2014). [ Links ]
19. Oyewole OO, Oritogun KS. Relationship between anthropometric parameters and blood pressure in Sagamu adolescents. Int J Biomed Hth Sci 2009;5(4):191-198. https://www.researchgate.net/publication/21547083 (accessed 5 March 2018). [ Links ]
20. Senbanjo IO, Oshikoya KA. Obesity and blood pressure levels of adolescents in Abeokuta, Nigeria. Cardiovasc J Afr 2012;23(5):260-264. https://www.ncbi.nlm.nih.gov/pmc/articles/PMC3721855/ (accessed 27 December 2016). [ Links ]
21. Moselakgomo VK, Toriola AL, Shaw BS, Goon DT, Akinyemi O. Body mass index, overweight, and blood pressure among adolescent schoolchildren in Limpopo province, South Africa. Revista Paulista de Pediatria 2012;30(4):562-569. http://doi.org/510.1590/S0103-05822012000400015 [ Links ]
22. Patel U, Patel N, Jain S, Ratre B, Shrivastava S. High blood pressure in school going adolescents: Prevalence and risk factors. Pediatr Rev: Int J Pediatr Res 2014;1(1):3-9. http://medresearch.in/index.php/IJPR/article/view/637 (accessed 12 January 2018). [ Links ]
23. Nelson D, Kennedy B, Regnerus C, Schweinle A. Accuracy of automated blood pressure monitors. J Dent Hyg 2008;82(4):35. https://www.ncbi.nlm.nih.gov/pubmed/18755068 (accessed 12 January 2018). [ Links ]
24. Mahajan A, Negi P. Hypertension and pre-hypertension among adolescents in Shimla, Northern India - time to awaken. Nig J Cardiol 2015;12(2):71-76. https://doi.org/10.4103/0189-7969.152008 [ Links ]
25. Naim NS, Abdùlkerim Y, Adnan A, Mustafa OB, Haldun S. Prevalence of hypertension among high school students in a middle Anatolian province of Turkey. J Health Popul Nutr 2008;26(1):88-94. https://www.ncbi.nlm.nih.gov/pmc/articles/PMC2740676/ (accessed 6 March 2018). [ Links ]
26. McNiece KL, Poffenbarger TS, Turner JL, Franco KD, Sorof JM, Portman RJ. Prevalence of hypertension and pre-hypertension among adolescents. J Pediatr 2007;150(6):640-644. https://doi.org/610.1016/j.jpeds.2007.1001.1052 [ Links ]
27. Sorof JM, Lai D, Turner J, Poffenbarger T, Portman RJ. Overweight, ethnicity, and the prevalence of hypertension in school-aged children. Paediatrics 2004;113(3 Pt 1):475-482. https://www.ncbi.nlm.nih.gov/pubmed/14993537 (accessed 19 May 2017). [ Links ]
28. Okpokowuruk FS, Akpan Enobong MU, Ikpeme E. Prevalence of hypertension and prehypertension among children and adolescents in a semi-urban area of Uyo Metropolis, Nigeria. Pan Afr Med J 2017;28:303. https://doi.org/10.11604/pamj.2017.28.303.14396 [ Links ]
29. Redwine KM, Daniels SR. Pre-hypertension in adolescents: Risk and progression. J Clin Hypertens 2012;14(6):360-364. https://doi.org/310.1111/j.1751-7176.2012.00663.x [ Links ]
30. Okpere AN, Anochie IC, Eke FU. Pattern of blood pressure and hypertension in adolescents in Port Harcourt, Nigeria. West Afr J Med 2013;32(2):93-98. https://www.ncbi.nlm.nih.gov/pubmed/23913495 (accessed 3 November 2017). [ Links ]
 Correspondence:
K O Isezuo
khadisez@yahoo.com
Accepted 14 March 2018

