


Serviços Personalizados
Artigo
 Inglês (pdf)
 Artigo em XML
 Referências do artigo
Indicadores

Links relacionados
-
 Citado por Google
 -
 Similares em Google
Compartilhar

 Permalink
South African Journal of Child Health
versão On-line ISSN 1999-7671
versão impressa ISSN 1994-3032
S. Afr. j. child health vol.12 no.3 Pretoria Jul./Set. 2018
http://dx.doi.org/10.7196/sajch.2018.v12i3.1468
ARTICLE
Food insecurity, social welfare and low birth weight: Implications for childhood malnutrition in an urban Eastern Cape Province township
S McLarenI; L SteenkampII; A FeeleyIII; J NyarkoIV; D VenterV
IMSc Dietetics; Department of Dietetics, Faculty of Health Sciences, Nelson Mandela University, Port Elizabeth, South Africa
IIMSc, MSc PHN, PhD (Dietetics); HIV/AIDS Research Unit, Nelson Mandela University, Port Elizabeth, South Africa
IIIMSc PHN, PhD; UNICEF, Pretoria, South Africa and MRC/WITS Developmental Pathways for Health Research Unit, School of Clinical Medicine, Faculty of Health Sciences, University of the Witwatersrand, Johannesburg, South Africa
IVB Cur, MBA, MPA; Maternal Child and Women's Health, Nelson Mandela Bay Health District, Port Elizabeth, South Africa
VPhD; Nelson Mandela University, Port Elizabeth, South Africa
ABSTRACT
BACKGROUND. Limited information is available regarding the impact of food insecurity, low birth weight (LBW) and the protective effect of the child support grant (CSG) on malnutrition in South Africa (SA).
OBJECTIVES. To describe malnutrition in the context of food insecurity, CSG and LBW history among children younger than 24 months from an underprivileged urban settlement in the Eastern Cape Province of SA.
METHODS. A descriptive study using a cross-sectional design was used to collect data from a non-probability sample of 400 young children from October 2015 to February 2016. Inferential statistics included t-tests to compare anthropometric data from different birth weight categories and analysis of covariance (ANCOVA) to allow for the effect of covariates.
RESULTS. Of the sample, 9% were stunted, 1% were wasted, 16% were overweight, 23% were food secure, 47% were at risk of hunger, and 31% were classified as hungry. LBW history was significantly associated with stunting but not with wasting. CSG holders and 'hungry' households' children had significantly lower mean height-for-age z-scores (HAZ) than non-CSG holders and food-secure households. Despite these apparent associations, when LBW is considered as a covariate, it becomes apparent that neither the CSG nor CCHIP category is significantly related to any of the anthropometric indicators.
CONCLUSION. The Department of Health has to recognise the significant impact of LBW on the prevalence of stunting and thus the need to prioritise antenatal care. Policymakers could aim to make the CSG available to mothers as close after birth as possible, or during pregnancy, in order to be more effective in reducing the long-term effects of LBW.
South Africa (SA) is one of the most unequal societies in the world, with a Gini coefficient of 63.4.[1] One of the direct results of inequality is insufficient access to food, which is also one of the underlying causes of malnutrition[2] According to the results of the 2016 General Household Survey, 22.3% of SA households had inadequate or severely inadequate access to food.[3] In the Eastern Cape Province, 26.4% had inadequate access to food and 5.9% suffered severe inadequate access to food, indicating a high level of vulnerability.[3] Shisana et al.[4]reported that the national prevalence of hunger was the highest in informal urban settings with an estimated 32.4% of people experiencing food insecurity.
Initiated in 1998, the SA Child Support Grant (CSG) provided a safety net to 2.5 million children from vulnerable households.[5] In 2015, 11 792 900 children were registered as CSG beneficiaries,[6]and this figure was projected to rise to 12.3 million by 2017.[7]While social grants have made some impact on SA household food security,[8] others argue that the effect of the CSG on nutritional status 'may have been eroded by food price inflation and limited progress in the provision of other important interventions and social services'.[9]
Koornhoff [10] stated that CSG-receiving households in the Western Cape Province reported significantly lower household income and more child stunting than households in the same area not receiving CSGs. In a study in urban townships in the Eastern Cape,[11] CSG-receiving households reported a higher monthly income than
non-CSG-receiving ones. However, Steenkamp et al.[11]showed that significantly more households with people receiving the CSG spent less than ZAR8 a day on food, compared with those not receiving the CSG. Households with children who received the CSG spent more money on non-food items, which may have contributed to the fact that they also experienced hunger more often, indicating that the CSG grant does not necessarily act as a safety net against hunger.
Apart from food insecurity contributing to malnutrition in children, women's health during the antenatal period may also impact fetal growth and development. A meta-analysis of 19 longitudinal birth cohorts from low- and middle-income countries revealed that children who were small for gestational age (birth weight less than 10th percentile for gestational age) were 2.4 times more likely to be stunted later in life, while preterm (less than 37 weeks' gestation) children had 1.9 times increased odds of stunting.[12] Children who were both small for gestational age (SGA) and preterm had a 4.5 times increased risk of stunting when compared with normal birth weight and term children.[12] Maternal health and nutrition are therefore both important factors in the development of chronic child undernutrition.
In SA, LBW was prevalent among 9.9% and preterm birth occurred in 11.4% of participants.[12] The LBW rate in Nelson Mandela Bay health district (NMBHD) was 16% during the 2016 calendar year (District Health Information Software, Eastern Cape Department of Health).
Despite the available data on maternal and child outcomes, limited information is available regarding the impact of food insecurity, LBW, the protective effect of CSGs on malnutrition risk during the first 1 000 days and the complex associations between these variables. The aim of the present study was to describe malnutrition risk among children younger than 2 years age residing in Motherwell, NMBHD, in the context of food insecurity, CSG and LBW history.
Methods
This was a descriptive study using a cross-sectional design. It involved measuring the weight, length or height and mid-upper arm circumference (MUAC) of children younger than 2 years residing in Motherwell. Motherwell is an area of ~25.86 km2 and with a population of 140 351 people,[13] with 5 817 children younger than 2 years in 2016. This community comprises lower-income residents with 6 clinics providing primary healthcare services. Procedures for obtaining anthropometric data followed protocols described by the Centers for Disease Control and Prevention (CDC).[14] Measurements were carried out by trained fieldworkers. Weight was measured using a Nagata BW-2010 infant scale. A Seca infantometer with a movable foot piece was used for measuring length. Non-stretch MUAC tapes were used in the study. The study also involved the use of structured questionnaires including demographic information and the household food security (HHFS) by means of the Community Childhood Hunger Identification Project (CCHIP) questionnaire.[15] This questionnaire is composed of 8 questions, with each affirmative answer adding one point to a household's score. A CCHIP score of 0 indicates food security, a score of 1 to 4 indicates that a household is at risk of hunger, and a score of >5 indicates hunger.[15] Where needed, the CCHIP questions were translated into isiXhosa and captured by a trained fieldworker. A non-probability sampling method was employed (convenience sampling) resulting in a sample of 400 infants and young children. This sample was obtained from 5 clinics and 15 Early Childhood Development (ECD) centres over the period October 2015 to February 2016. Ethical approval was obtained from the Research Ethics Committee (Human) (ref. no. H15-HEA-002), Nelson Mandela University and the Eastern Cape Department of Health. Inclusion in the study required written informed consent from the primary caregiver of the participant. Although the primary caregivers had to provide consent, not all were available at the ECD centres at the time of data collection to complete the CCHIP questionnaire or provide grant information. Anthropometric data were used to calculate z-scores for weight-for-height (WHZ), weight-for-age (WAZ) and height-for-age (HAZ) using World Health Organization (WHO) Anthro software (WHO, Switzerland). For the purpose of this study, data cleaning criteria according to WHO[16] were applied. Descriptive statistics i.e. frequencies and percentages, were used to describe outcomes of categorical data. Inferential statistics included f-tests to compare anthropometric data from different birth weight categories and ANCOVA to allow for the effect of covariates.
Results
Nine records were removed from the sample as they had implausible z-scores. A further 10 records were removed due to incomplete data or not meeting the inclusion criteria.
All of the children included in this study were of black ethnicity and younger than 2 years of age. Half of the sample were male (n=199). The mean (standard deviation (SD)) participant age was 9.78 (6.13) months (median 9 months).
Of the sample, 9% were stunted, 1% were wasted and 16% were overweight. The mean (SD) WAZ was 0.44 (1.26), the mean (SD) WHZ was 0.83 (1.28) and the mean (SD) HAZ was -0.24 (1.26). The mean WAZ, HAZ and WHZ did not differ significantly between males and females in the sample or between age categories when using 3-month age intervals. Furthermore, there were no significant differences between the age of stunted compared with non-stunted children.
Food security
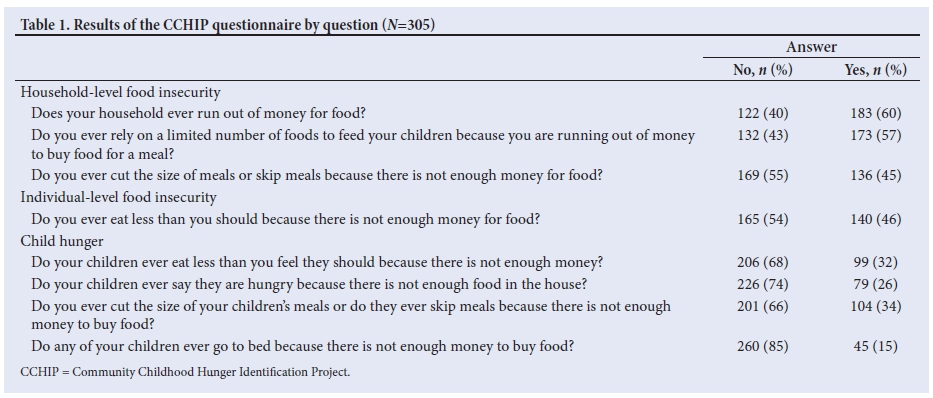
Responses to the CCHIP questionnaire were obtained from 76% (n=305) of the participants' caregivers. These (Table 1) were collated and revealed that 23% of the sample were food-secure, 47% were at risk of hunger, while 31% were classified as hungry. As illustrated in Table 1, more caregivers reported food insecurity at household level (45 - 60%) than child hunger (15 - 34%).
Children in the 'food-secure' category had a mean (SD) WHZ of + 1.0 (1.4) compared with children in the 'hungry' category who had a mean (SD) WHZ of +0.7 (1.2). Similarly, children in the 'food-secure' category had a mean (SD) HAZ of -0.2 (1.3) compared with a mean (SD) HAZ of -0.5 (1.4) in the 'hungry' category.
Birth weight
As illustrated in Table 2, 5.7% (n=22) of the sample with birth weight information available (n=386) reported a LBW (<2 500 g). The mean values for the various anthropometric indicators of nutritional status per birth weight category are presented in Table 2.
As expected, LBW participants had a significantly lower WAZ (p<0.0005) and HAZ (p<0.0005) score than normal birth weight (NBW) participants (Table 2). However, no significant differences could be observed between LBW and NBW participants for WHZ and MUAC. Therefore, during the first 1 000 days, LBW seems to be significantly associated with lower HAZ scores but not with lower WHZ scores. Interestingly, only 3% (n=12) of the NBW children deteriorated later into being stunted from birth till the survey date. These children represented 35% of the total number of stunted children (n=34) in our sample.
Child support grants
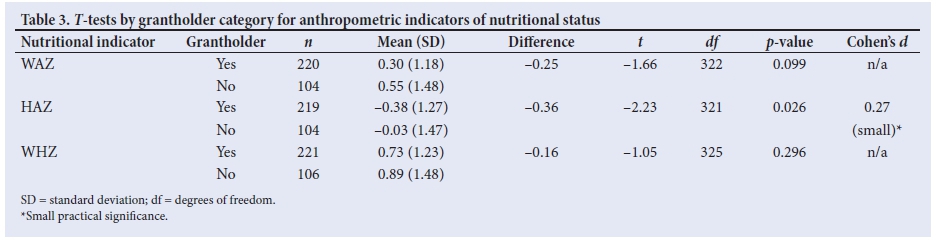
CSG data were available from 327 of the 400 participants and 67% (n=221) of participants with available CSG information were grantholders. CSG holders showed a significant (p<0.05) lower mean HAZ score than non-CSG holders (Table 3). There were no significant differences between grant recipients and non-recipients for mean WAZ and WHZ. Of the CSG holders, 10% (n=22) were classified as stunted while only 5.6% (n=6) of the non-CSG holders were classified as stunted.
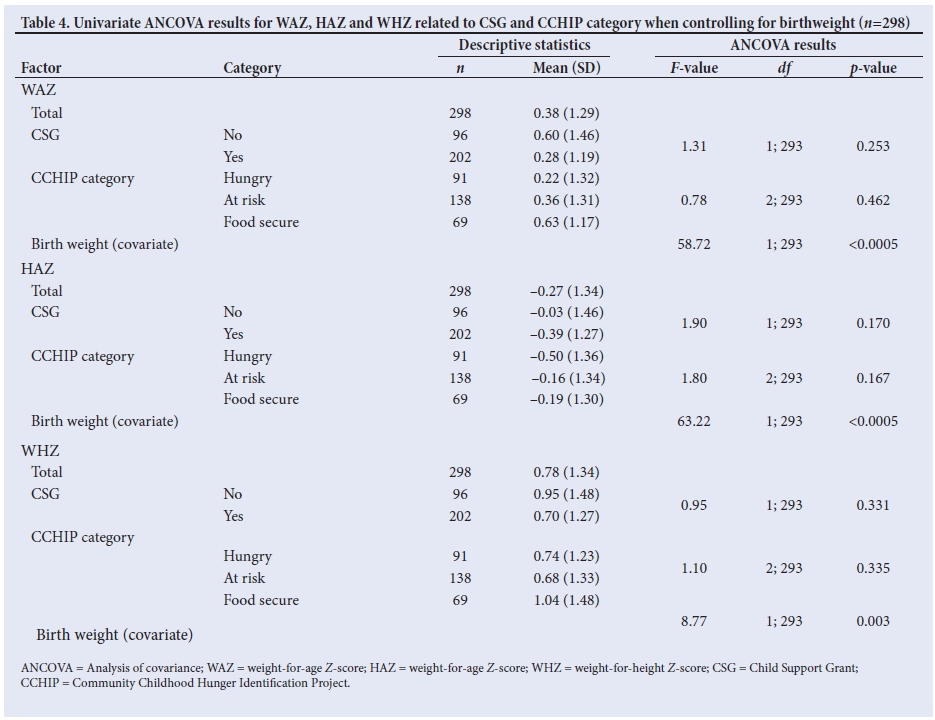
To appropriately account for all variables related to the nutritional indicators (WAZ, HAZ, WHZ), univariate ANCOVAs were conducted with CSG and CCHIP category (the independent variables), as well as birth weight (the covariate). The results are shown in Table 4 and it is clear that birth weight was the only variable significantly related to the nutritional indicators. This shows that the effect of being born LBW results in a much larger negative effect on nutritional risk than the potential impact of food insecurity or the effect of being a CSG holder.
Discussion
Stunting affected almost 10% of the participants of this study, which was lower than expected when compared with other SA studies.[4] The WHO Conceptual Framework on Childhood Stunting suggests that poor micronutrient quality, low dietary diversity and inadequate intake of animal foods as well as the low energy content of complementary foods contribute to stunting.[17] However, in this sample, only a minority of children deteriorated into stunting after being born NBW. The majority of the stunted children had a history of LBW. Since LBW may be caused by intrauterine growth restriction secondary to hypertension,[18] anaemia, teenage pregnancy,[19] smoking and snuff use, as well as alcohol abuse during gestation, optimal antenatal care during pregnancy may have a much larger impact in reversing the high stunting prevalence among children than any of the available nutrition-specific interventions, i.e. supplementation programmes to address stunting after birth.
Catch-up growth in LBW infants is important and associated with an increase in the number of years of education that children received. [20] This emphasises the importance of early identification and treatment of children who fit into high-risk categories. Community health workers or caregivers who are part of the screening process by ward-based outreach teams have a limited capacity to measure and plot the growth of children accurately. It is easier to identify food-insecure infants as well as LBW infants as potential high-risk cases and refer those cases for health facility assessments, than to screen for stunting in the community. Even though hunger affected more than half of the households in our sample, findings suggest that LBW plays a more important role than food insecurity in lower mean height-for-age z-scores observed in infants and young children and therefore strategies and actions to prevent LBW in infants in this health district should be prioritised by healthcare professionals. Low birth weight has also been associated with low maternal body mass index (BMI),[22] underlining the need for nutritional intervention for underweight women of childbearing age. Unfortunately, maternal nutritional status history was not available for this sample and longitudinal data in this district are necessary to provide adequate data to assess the impact of maternal nutritional status on birth outcomes.
As mentioned previously, a high percentage of caregivers in our sample reported hunger and risk of hunger in the households, with less than a quarter of the households being food secure. However, interestingly, the caregivers reported less children to be at risk of hunger than the number that reported households to be at risk. As stated previously, household food insecurity puts children at a high risk of malnutrition. Qualitative research to explore reasons for the lower prevalence of children at risk should be conducted since it may be related to children still receiving breastmilk during the first 1 000 days, or a reluctance to acknowledge inadequate care on the caregivers' side. However, the food insecurity situation indicates that these children will experience continued problems and that any catch-up growth among LBW children will be highly unlikely, making it almost impossible to undo the long-term effects of LBW.
Since the CSG was implemented to protect poor households against the effects of unemployment and poverty, one would expect CSG holders to be protected against hunger. In our sample, CSG holders were significantly more stunted than non-CSG holders, but when LBW covariate is controlled for, the relationship was attenuated and became non-significant. However, the CSG alone could not undo the negative impact of IUGR, and was not sufficient to allow for catch-up growth in the first 1 000 days in the older age categories in this sample. Recent economic developments may result in higher food, education and transport costs for South Africans. The resulting increase in buying power among beneficiaries may therefore be disrupted. CSG recipients were far more likely to be hungry or at risk of hunger while non-recipients were more likely to be food-secure. Zembe-Mbakile et al.[9] concluded that provision of the CSG has not provided any protection against stunting in SA.
Children younger than two years have lower take-up rates for the CSG than older children,[22] the stage of the life cycle where most of the irreversible damage to cognitive development caused by stunting occurs. In this otherwise homogenous sample, the CSG was not enough to level the variances in income with regard to food security. The results also leave us with the question whether the CSG, which can only be applied for once the child is born and registered, is not needed much earlier during gestation as suggested in a recent systematic review from programmes in 27 countries.[23] This will ensure that the pregnant mother has sufficient funds to prevent hunger and support regular clinic visits to reduce the risk of preterm deliveries associated with SGA/LBW infants.
Study limitations
Cross-sectional studies are not the study design of choice to determine growth patterns in children and this should be considered a limitation. Measuring infants and young children in clinics and crèches inherently excludes children who do not attend clinics and crèches and thus the results cannot be generalised.
Conclusion
Maternal health is important to prevent LBW and later malnourished children. Reducing the burden of childhood malnutrition will require the Department of Health to recognise the large impact of LBW and thus the need for improvements in antenatal care and healthcare for women of childbearing age. Policymakers could aim to make CSGs available to mothers as close to the time of birth as possible, or during pregnancy, to be effective during the first 1 000 days of growth and development.
Acknowledgements. None.
Author contributions. SMcL was the principal researcher and wrote the initial draft of the manuscript. LS contributed to the design of the study, intepretation of results and final preparation of the manuscript. AF contributed to content, interpretation of results and final preparation of the manuscript. JN provided local context, statistics and contributions to the final manuscript. DV did the statistical analysis and contributed to the lay-out of the results presented.
Funding. Fieldwork was funded by Nelson Mandela University.
Conflicts of interest. None.
References
1. The World Bank. GINI index (World Bank estimate). Washington: The World Bank Group, 2017. http://data.worldbank.org/indicator/SI.POV.GINI?locations=ZA (accessed 26 June 2017). [ Links ]
2. United Nations Children's Fund (UNICEF). UNICEF Conceptual Framework. https://www.unicef.org/nutrition/training/2.5/4.html (accessed 26 June 2017). [ Links ]
3. Statistics South Africa (StatsSA). General Household Survey. Pretoria: StatsSA, 2016. https://www.statssa.gov.za/publications/P0318/P03182016.pdf (accessed 3 October 2017). [ Links ]
4. Shisana O, Labadarios D, Rehle T, et al. South African National Health and Nutrition Examination Survey (SANHANES-1). Cape Town: HSRC Press, 2013. [ Links ]
5. Aguero JM, Carter MR, Woolard, I. The impact of unconditional cash transfers on nutrition: The South African Child Support Grant. Southern Africa Labour and Development Research Unit Working Paper Number 06/08. Cape Town: SALDRU, 2006. http://www.opensaldru.uct.ac.za/bitstream/handle/11090/46/06_08.pdf?sequence=1 (accessed 26 June 2017). [ Links ]
6. South Africa Social Security Agency (SASSA). Annual Report 2015/16. Pretoria: Department of Social Development, 2016. http://www.sassa.gov.za/index.php/knowledge-centre/annual-reports (accessed 26 June 2017). [ Links ]
7. National Treasury. Estimates of National Expenditure 2015 Abridged Version. Pretoria: National Treasury, 2015. http://www.treasury.gov.za/documents/national%20budget/2015/ene/FullENE.pdf (accessed 26 June 2017). [ Links ]
8. Coetzee M. Finding the benefits: Estimating the impact of the South African Child Support Grant. S Afr J Econ 2013;81(3):427-450. [ Links ]
9. Zembe-Mkabile W, Ramokolo V, Sanders D, et al. The dynamic relationship between cash transfers and child health: Can the child support grant in South Africa make a difference to child nutrition? Public Health Nutrition 2016;19(2):356-362. [ Links ]
10. Koornhof HE. A profile of children in the Avian Park and Zweletemba Settlements in the Breede Valley Local Municipality of the Western Cape Province, South Africa. MNutr thesis, Faculty of Medicine and Health Sciences, Stellenbosch University, 2014. http://scholar.sun.ac.za/handle/10019.1/86450 (accessed 27 June 2017). [ Links ]
11. Steenkamp L, Venter D, Walsh C, Dana P. Socio-economic and demographic factors related to HIV status in urban informal settlements in the Eastern Cape, South Africa. Afr J AIDS Res 2014;13(3):271-279. [ Links ]
12. Christian P, Lee SE, Donahue Angel M, et al. Risk of childhood undernutrition related to small-for-gestational age and preterm birth in low- and middle-income countries. Int J Epidemiol 2013;42(5):1340-1355. [ Links ]
13. Massyn N, Peer N, Padarath A, et al. District Health Barometer 2014/15. Durban: Health Systems Trust, 2015. [ Links ]
14. McDowell MA, Fryer CD, Ogden CL, et al. Anthropometric Reference Data for Children and Adults: United States, 2003 - 2006. National Health Statistics Report 2008;10. https://www.cdc.gov/nchs/data/nhsr/nhsr010.pdf (accessed 27 June 2017). [ Links ]
15. Wehler CA, Scott RI, Anderson JJ, et al. The Community Childhood Hunger Identification Project: A Survey of Childhood Hunger in the United States. Washington: Food Research and Action Center, 1996. [ Links ]
16. World Health Organization (WHO). Software for assessing growth and development of the world's children. Geneva: WHO, 2006. http://www.who.int/childgrowth/software/WHOAnthro2005_PC_Manual.pdf (accessed 27 June 2017). [ Links ]
17. Stewart CP, Iannotti L, Dewey KG, et al. Contextualising complementary feeding in a broader framework for stunting prevention. Matern Child Nutr 2013;9(2):27-45. [ Links ]
18. Braham K, Parnell B, Nelson-Piercy C, et al. Chronic hypertension and pregnancy outcomes: Systematic review and meta-analysis. BMJ 2014;348:g2301. https://doi.org/10.1136/bmj.g2301 [ Links ]
19. Ganchimeg T, Ota E, Morisaki N, et al. Pregnancy and childbirth outcomes among adolescent mothers: A Word Health Organization multicountry study. BJOG 2014;121(S1):40-48. [ Links ]
20. Martorell R. Birth weight, early child growth and young adult height and school attainment: A pooled analysis from birth cohorts in five developing and transitional countries:S34-2. Ann Nutr Metab 2009;55:48-49. [ Links ]
21. Yu Z, Han S, Zhu J, et al. Pre-pregnancy body mass index in relation to infant birth weight and offspring overweight/obesity: A systematic review and meta-analysis. PLoS ONE 2013;8(4):e61627. https://doi.org/10.1371/journal.pone.0061627 [ Links ]
22. Zembe-Mbakile W, Surender R, Sanders D, et al. The experience of cash transfers in alleviating childhood poverty in South Africa: Mothers' experiences of the Child Support Grant. Glob Public Health 2015;10(7):834-851. [ Links ]
23. Chersich MF, Luchters S, Blaauw D, et al. Safeguarding maternal and child health in South Africa by starting the Child Support Grant before birth: Design lessons from pregnancy support programmes in 27 countries. S Afr Med J 2016;106(12):1192-1210. [ Links ]
 Correspondence:
L Steenkamp
liana.steenkamp@nmmu.ac.za
Accepted 23 April 2018

