


Servicios Personalizados
Articulo
 Inglés (pdf)
 Articulo en XML
 Referencias del artículo
Indicadores

Links relacionados
-
 Citado por Google
 -
 Similares en Google
Compartir

 Permalink
South African Journal of Child Health
versión On-line ISSN 1999-7671
versión impresa ISSN 1994-3032
S. Afr. j. child health vol.11 no.1 Pretoria ene./mar. 2017
http://dx.doi.org/10.7196/sajch.2017.v11i1.1201
RESEARCH
doi:10.7196/sajch.2017.v11i1.1201
Short-term and sustained effects of a health system strengthening intervention to improve mortality trends for paediatric severe malnutrition in rural South African hospitals
M MuzigabaI, II; G KigoziIII; T PuoaneIV
IPhD, MPhil, MPH, BSc; School of Clinical Medicine, College of Health Sciences, University of KwaZulu-Natal, Durban, South Africa
IIPhD, MPhil, MPH, BSc; Faculty of Community and Health Sciences, School of Public Health, University of the Western Cape, Cape Town, South Africa
IIIPhD, MA, BA; Centre for Health Systems Research and Development, University of the Free State, Bloemfontein, South Africa
IVDr PH, MPH, BCur, BSocSci; Faculty of Community and Health Sciences, School of Public Health, University of the Western Cape, Cape Town, South Africa
ABSTRACT
BACKGROUND. Case fatality rates for childhood severe acute malnutrition (SAM) remain high in some resource-limited facilities in South Africa (SA), despite the widespread availability of the World Health Organization treatment guidelines. There is a need to develop reproducible interventions that reinforce the implementation of these guidelines and assess their effect and sustainability.
OBJECTIVES. To assess the short-term and sustained effects of a health system strengthening intervention on mortality attributable to SAM in two hospitals located in the Eastern Cape Province of SA.
METHODS. This was a theory-driven evaluation conducted in two rural hospitals in SA over a 69-month period (2009 - 2014). In both facilities, a health system strengthening intervention was implemented within the first 32 months, and thereafter discontinued. Sixty-nine monthly data series were collected on: (i) monthly total SAM case fatality rate (CFR); (ii) monthly SAM CFR within 24 hours of admission; and (iii) monthly SAM CFR among HIV-positive cases, to determine the intervention's effect within the first 32 months and sustainability over the remaining 37 months. The data were analysed using Linden's method for analysing interrupted time series data.
RESULTS. The study revealed that the intervention was associated with a statistically significant decrease of up to 0.4% in monthly total SAM CFR, a non-statistically significant decrease of up to 0.09% in monthly SAM CFR within 24 hours of admission and a non-statistically significant decrease of up to 0.11% in monthly SAM CFR among HIV-positive cases. The decrease in mortality trends for both outcomes was only slightly reversed upon the discontinuation of the intervention. No autocorrelation was detected in the regression models generated during data analyses.
CONCLUSION. The study findings suggest that although the intervention was designed to be self-sustaining, this may not have been the case. A qualitative enquiry into the moderating factors responsible for failure to sustain such an intervention, as well as the process of care, would add value to the findings presented in this study.
Severe acute malnutrition (SAM) in children aged 6 - 59 months remains a public health problem worldwide.[1] Childhood SAM is defined as a weight-for-height <-3 z-score of the median of the World Health Organization (WHO) growth standard,[2] or the presence of clinical signs of bilateral pitting oedema of nutritional origin (oedematous malnutrition), despite other measures being above specified cut-off values.[3] The 2016 joint report on child malnutrition estimates, which was developed by the World Bank, WHO and the United Nations Children's Fund (UNICEF),[4] indicates that although stunting has declined over the past 5 years, it remained as high as 23.2% in 2015. However, wasting has risen slightly to 7.4% within the same period. The joint report also indicates that in 2015, more than half (56%) of all stunted under-5 children lived in Asia and more than one third (37%) lived in Africa. Regarding wasting, 68% of all wasted under-5 children lived in Asia whereas 28% lived in Africa.
The mortality rate of undernourished children is much higher than their well-nourished counterparts.[5] Children with SAM also do not respond to medical treatment in the same way as well-nourished children.[6] Special guidelines for treating severely malnourished children are therefore required because of the peculiar pathophysiological and metabolic changes that the undernourished body undergoes. The reductive adaptation that occurs in SAM requires specialised management, and practitioners involved with the rehabilitation of SAM cases should be aware of this delicate homeostatic mechanism.[7]
The WHO 10-step guidelines for management of severe malnutrition were developed for this purpose.[8] The guidelines are currently promoted worldwide as the standard by which children with SAM should be treated.[9] Some studies have shown that with strict adherence to these guidelines, mortality can be reduced to <15%.[10] In 2004, Puoane et al.[11] conducted a study in rural hospitals in South Africa (SA) to explore why some hospitals achieved better outcomes for severely malnourished children than others. They concluded that the WHO clinical guidelines and external training are valuable, but they may be insufficient to ensure quality of care. They identified a need for a self-sustaining programme that should focus on continuous in-service training for healthcare workers, supervision and audit of the process of care, and parallel interventions for senior hospital and clinical managers to foster leadership and teamwork. They also concluded that for the WHO guidelines to succeed, tasks have to be performed assiduously and consistently by the frontline healthcare providers.
In response to the recommendations from Puoane et al.,[11] we developed, implemented and evaluated a comprehensive health system strengthening intervention in two of the district hospitals where their study was conducted. In contrast to previous research that evaluated similar interventions,[10] we used a robust impact evaluation design - the interrupted time series (ITS) design - with a view to assessing the intervention's short-term effects on mortality levels and trends attributable to SAM, as well as the sustainability of these effects after completion of the research. More specifically, the objectives of the study were as follows:
• to develop a package of interventions targeting healthcare workers, hospital managers and administrators, and other support structures within and outside two purposefully selected hospitals, with a view to improving the organisational structures, health workforce capacity and processes of care
• to implement the same intervention in each of the two district hospitals over a specific period of time
• to discontinue the intervention and assess, in each hospital, whether the discontinuation would result in a shift in the levels and trends of case fatality rates (CFRs) attributable to SAM compared with levels and trends in the pre-discontinuation period
• to compare the temporal changes in CFRs attributable to SAM between the two hospitals before and after the intervention was discontinued.
Methods
Setting
The study was conducted in two rural district hospitals located in the Eastern Cape Province (EC) that were already implementing the WHO treatment guidelines.[11] In this article, the two hospitals are referred to as hospitals A and B. The hospitals were selected based on the fact that they had participated in the initial province-wide intervention to improve the management of SAM in the EC and had been implementing the WHO 10-step guidelines more effectively than other hospitals in the region. However, hospital-level statistics at the time of the current study had revealed that the annual CFRs attributable to SAM had increased in excess of 25% in hospital A and 32% in hospital B since the last intervention by Puoane et al.,[11] which was implemented in 2004 in the same facilities.
Standard of care
The standard of care consisted of routine care processes, such as: patient diagnosis on arrival at the facility; documentation of clinical/ medical history; disease classification; HIV testing and disease staging; documentation of the treatment protocol to be followed and admission of the patient to the ward as required; and treatment of the patients by the health worker using the WHO 10-step guidelines. The inputs and infrastructure included: available amenities/facilities; medical equipment; therapeutic resources; hospital support services; financial resources and incentives; and therapeutic guidelines (WHO management protocol).
Study intervention
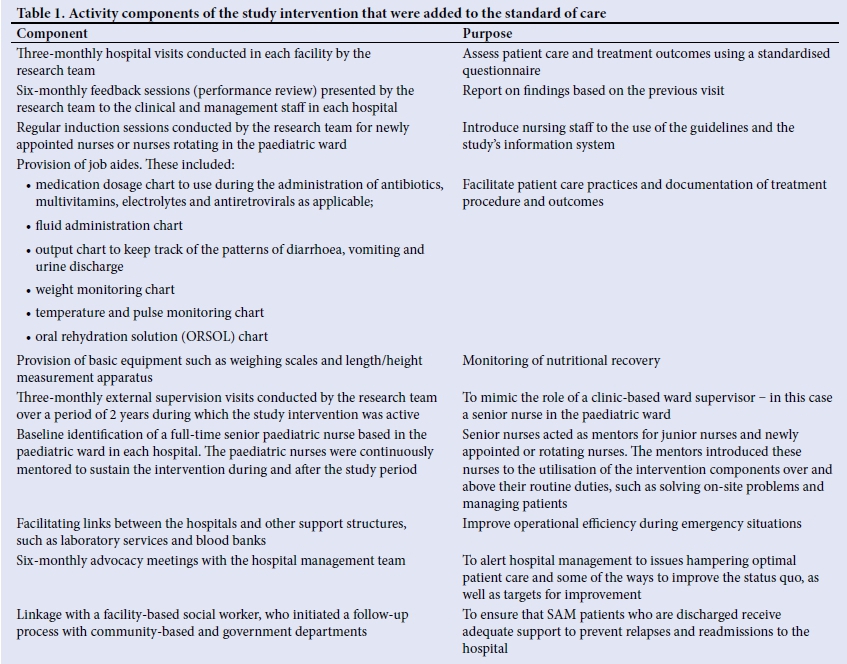
The study intervention was modelled on a similar clinical guideline-based intervention implemented in Kenya as part of a cluster randomised trial to improve paediatric care and outcomes in Kenyan hospitals. The intervention was designed to ameliorate treatment outcomes through improved organisational structures, health workforce capacity, and processes of care.[12] The current study intervention was designed to achieve similar goals, but was adapted to the local context and the disease of interest. In addition to the standard of care, the current study intervention included inputs and processes as described in Table 1. The components of the study intervention were introduced in each hospital from January 2009 to August 2011.
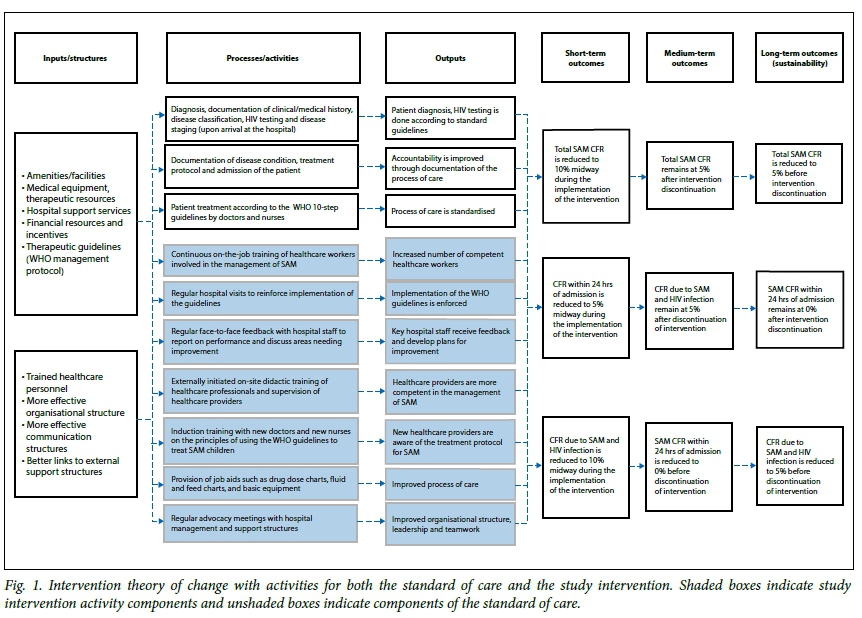
Intervention theory of change
The intervention theory of change for the current study is summarised in Fig. 1. The components of the study intervention and the standard of care are all embedded in the theory of change as shaded and unshaded boxes, respectively. As shown in Fig. 1, each activity was designed to be executed using specific resources and to generate specific outputs which, as a collective, would result in a cascade of outcomes (short-, medium- and long-term outcomes). Each level of outcome, whether short-, medium- or long-term, had specific targets to be met during the evaluation period.
Study design
This study was approved by the University of the Western Cape Research Ethics Committee (reg. no. 12/10/37). It involved an ITS study design, which has been shown to be a rigorous quasi-experimental alternative to randomised control trials when the latter are not feasible to conduct and time series data are available.[13] As far as could be ascertained, the ITS design has not been used before to specifically assess the impact of discontinuing a facility-based nutrition rehabilitation intervention involving the WHO clinical guidelines for management of SAM. Some scientists have also argued that the ITS is the strongest quasi-experimental design that can be used to evaluate longitudinal effects oftime-defined interventions.[14,15] The method usually involves the measurement of a variable (or variables) of interest before and after the introduction of specific interventions to assess whether the intervention has had an impact on that variable over time.[14,15] The impact of the intervention can then be measured by assessing the level and trend (slope) changes of that variable over time, which are presumed to be affected by the presence of the intervention alone.
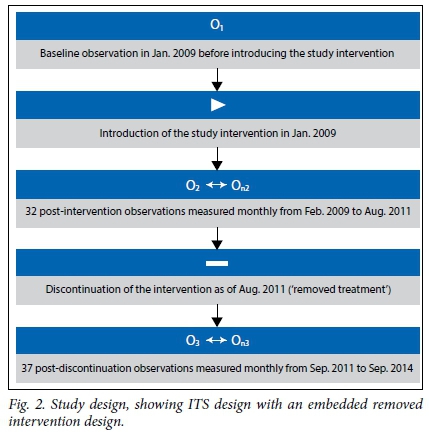
During this study, we used the same ITS notion. However, we assessed whether discontinuing the study intervention, instead of introducing it, would have an effect on the level and trend of three specific mortality outcomes, i.e: (i) total monthly SAM CFR; (ii) monthly SAM CFR within 24 hours of admission; and (iii) monthly SAM CFR among cases with HIV infection. The calculation of these outcomes is explained further below. The resultant study design was therefore an ITS design with an embedded 'removed intervention design.
The aim of the removed intervention design was to demonstrate that mortality outcomes improved or worsened with the presence or absence of an intervention - a result that could be otherwise explained only by a threat to validity that similarly rose and fell over the same time period.[15]
Fig. 2 illustrates the removed intervention design used in this study. The same intervention was implemented in each hospital over a period of 32 months (from January 2009 to July 2011). Thereafter, the study intervention was discontinued (solely because of the end of the funding period), but mortality outcomes of interest were monitored for a further 37 months (from August 2011 to September 2014). The sustainability of the study intervention was therefore determined from the pattern of mortality outcomes in the period after July 2011, when components of the study intervention that required researchers' input were no longer active. During this period, both hospitals were presumed to be managing SAM cases independently.
This approach was applied to time series data from both hospitals so that results could be compared. The use of a second group in ITS analysis has been encouraged by some researchers.[13,16] However, in our study, both hospitals received the same intervention for comparison purposes, unlike in traditional multiple-group ITS, where control groups do not receive the intervention.
Study outcomes and measurement
To enhance the internal validity of the study, monthly mortality statistics for SAM were recorded objectively by a trained research nurse in each hospital, using a standardised performance monitoring tool developed by the research team. Data recorded included, among others, number of: total ward admissions; ward deaths; ward admission due to SAM; deaths due to SAM; deaths due to SAM among HIV-positive cases; deaths due to SAM within 24 hours; and children admitted with SAM receiving child support grants. In this study SAM was defined at admission as per the Wellcome classification system.[17] It was also important that the data collection process was not influenced by the intervention. Therefore, the research nurses were blinded to the aim of the study and the use of the data collected over the study period. Furthermore, the composition of the dataset at each time point measured in the study consisted of at least 95% of SAM cases that were treated in each hospital over the study period.
At the end of the study period (November 2014) the research team used a standardised registry abstraction form to gather all the data collected by research nurses over the study period. The data pertinent to this study were retrospectively verified, as far as possible, for precision, timeliness, comprehensiveness, validity and accuracy. This dataset included the total number of admissions due to SAM, number of SAM admissions with HIV infection, total number of deaths due to SAM, total number of deaths due to SAM that occurred within 24 hours of admission, and total number of deaths due to SAM among HIV-positive cases. Using these metrics, the following three study outcomes were calculated:
• total monthly SAM CFR
• monthly SAM CFR within 24 hours
• monthly SAM CFR among HIV-positive cases.
Since the CFR for either outcome in any given month was dependent on the number of patients admitted with SAM in that month, it was important to transform each outcome so that the monthly CFRs of interest were weighted against the corresponding denominator for that month. Thus the monthly outcome statistics used in this evaluation were computed as follows:
• Weighted monthly total SAM CFR = [Deaths due to SAM (N)/SAM admissions (N) χ 100 ] x weighted score
• Weighted monthly SAM CFR within 24 hours = [Deaths due to SAM (N)within 24 hours of admission/SAM admissions (N) x 100] χ weighted score
• Weighted monthly SAM CFR among HIV-positive cases = [SAM deaths (N)with HIV comorbidity/SAM admissions (N) with HIV comorbidity χ 1001 χ weighted score
Data analysis
The data were transformed and analysed in Stata 13.0 (StataCorp., USA) using a widely used method developed by Linden.[17] The ITS analysis involved two groups in which data from the two hospitals were compared to determine whether there were similarities in parameter estimates of interest. The key assumption underlying the two-group ITS analysis was that the change in the level and/ or trend in the three outcome variables was the same for both the control group (in this case hospital A), and the other group (in this case hospital B). It was assumed that the confounding variables affected the two hospitals similarly.[17] The major strength of the two-group ITS analysis is therefore its ability to test for comparability between the two hospitals, thereby supporting the predicted effects or lack thereof.
In this study, the regression model equation for the two-group analysis took the following form, which is detailed in the article by Linden[17] where:
Yt= + β0 + β1Tt + β2Xt + β3XtTt + β4Z + β5ZTt + β6ZXt + β7ZXtTt + εt
Yt = outcome variable measured every month t during the study period
Tt = time since the start of the study in January 2009
Xt = dummy variable representing the presence or absence of the intervention (in this study, the intervention period = 0 and the period after the intervention discontinuation = 1)
Z = a dummy variable to denote the group assignment (hospital A or B)
XtTt, ZTt, ZXt, and ZXtTt = interaction terms
β0 = the intercept (starting level of the outcome variable)
β1 = the slope (trajectory of the outcome variable until the 'removal' of the intervention)
β2 = the change in the level of the outcome that occurs in the period immediately after the removal of the intervention
β3 = the difference between pre- and post-intervention discontinuation slopes for the outcome
β4 = the difference in the level (intercept) of the outcome variable between the two hospitals before the discontinuation of the intervention
β5 = the difference in the slope (trend) of the outcome variable between the two hospitals prior to the discontinuation of the intervention
β7 = the difference between the two hospitals in the slope (trend) of the outcome variable after the discontinuation of the intervention.
The ordinary least squares (OLS) regression model was estimated for each outcome variable, with the Newey-West standard errors to handle autocorrelation and possible heteroscedasticity. The Cumby-Huizinga test was used to verify whether the model estimates accounted for the correct autocorrelation structure. Model estimates were also plotted for visual inspection of actual and predicted trends and levels in the outcome variables before and after the intervention was discontinued.
Results
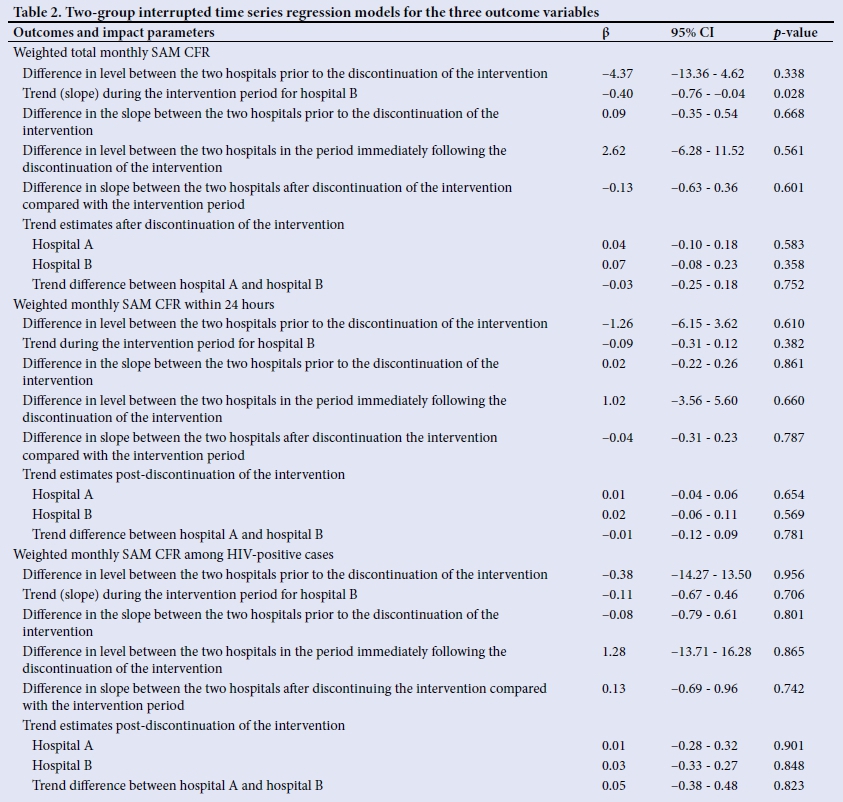
The regression model coefficients, 95% confidence intervals (CIs) and p-values for (i) weighted total monthly SAM CFR; (ii) weighted monthly SAM CFR within 24 hours; and (iii) weighted monthly SAM CFR among HIV-positive cases are presented in Table 2, and the corresponding graphical visualisations of level and trend changes are shown in Figs 3, 4 and 5, respectively. The Cumby-Huizinga test revealed no autocorrelation at any of the 69 lags for the regression models fitted on all three outcome variables.
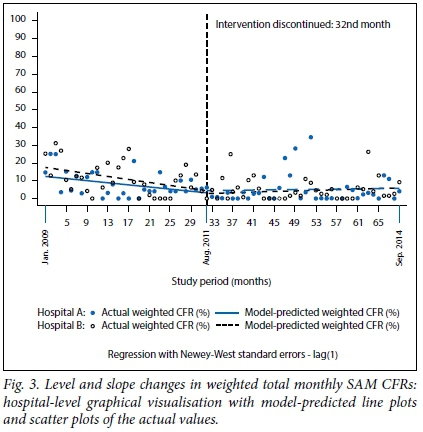
The model-predicted line plot in Fig. 3 shows that the starting level of the weighted total monthly SAM CFR was about 17% in hospital B, which was 4% higher than in hospital A. However, this difference was not statistically significant (CI -3.36 - 4.62; p=0.338), as shown in Table 2. There was a downward trend in weighted total monthly SAM CFR in both hospitals during the intervention period, with small differences that were not statistically significant (β=0.09, CI -0.35 - 0.54; p=0.668). Contrary to hospital A, hospital B had a statistically significant monthly reduction of 0.4% in mortality during the period within which the intervention was active (β=-0.40; CI -0.76 - -0.04; p=0.028). The level and slope changes for both hospitals during the intervention period are shown in Fig. 3. The trajectory in mortality in both hospitals appears to have moderately fallen during this period.
The results in Table 2 and Fig. 3 also show that after the discontinuation of the intervention, there was a very small and not statistically significant increase in the weighted total monthly SAM CFR in both hospitals. The CFR increased slightly every month by 0.04% in hospital A (β=0.04; CI -0.10 - 0.18; p=0.583) and by 0.07% in hospital B (β=0.07; CI -0.08 - 0.23; p=0.358). The difference in slope between the two hospitals after discontinuing the intervention compared with the intervention period was very small (-0.03%) and not statistically significant (p=0.752). Again, these results indicate that the trends in CFR were comparable between the two hospitals throughout the study period.
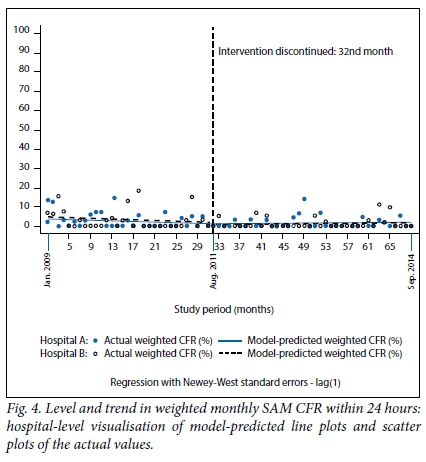
Weighted monthly SAM CFR within 24 hours
As shown in Fig. 4, during the first month before the introduction of the intervention, the weighted monthly SAM CFR within 24 hours was again higher in hospital B (5%) compared with hospital A (3.7%), but this difference was not statistically significant (p=0.601). Early CFR declined steadily every month in both hospitals during the intervention period, but the difference in slope between the two hospitals was not statistically significant (β=0.02, CI -0.22 - 0.26; p=0.861). The trend analysis post intervention discontinuation shows that both hospitals experienced a very negligible monthly increase in early CFR. Hospital A had a month-to-month increase of 0.01% and hospital B an increase of 0.02%. These results show that levels and trends in the weighted monthly SAM CFR within 24 hours were statistically comparable between the two hospitals during the study period.
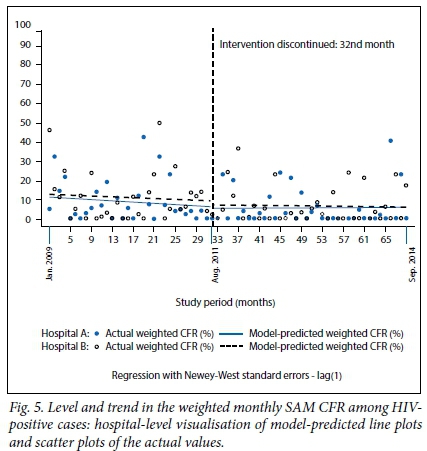
Weighted monthly SAM CFR among HIV-positive cases
Fig. 5 and Table 2 show that the baseline level of the weighted monthly SAM CFR among HIV-positive cases in both hospitals was ~12%, which declined at the rate of 0.11% every month in hospital B during the intervention period, and at a monthly rate of 0.05% in hospital A. The trend estimates post discontinuation of the intervention show that mortality trends remained fairly constant. There was a very slight and not statistically significant monthly increase in mortality of 0.01% in hospital A, and a negligible monthly decrease of 0.03% in hospital B.
Discussion
The ITS design has been widely documented as a powerful quasi-experimental design that can be used to evaluate the effects of interventions when random assignments are not feasible.[14,15,18] This study used the ITS design to assess the short-term and sustained effects of a health system strengthening intervention on mortality attributable to SAM in two hospitals located in the EC. Traditional experimental and quasi-experimental research in public health has involved testing the effectiveness of an intervention following its introduction, but wtthout due regard to the sustainability once it has been discontinued. This study therefore used a novel approach in the area of SAM, which can be explored further in future research using other performance indicators of choice.
This study revealed that the intervention was associated with a downwardtrend in all three mortality outcomes during the intervention period in both hospitals. However, this effect was not statistically significant, except; for the total monthly SAM (CFR in hospital B, which was significantly reduced during the intervention period.
By design, the trend in mortality during the intervention segment, projected into the period during which the intervention was not active, served as a counterfactual.[16] Graphical inspections and regression model estimates for all three mortality outcomes showed that the effects realised during the intervention, although not always statistically significant, were slightly reversed after the intervention was discontinued, but the reversal was very minimal compared with the trends in the intervention segment and not statistically significant.
This finding can also be explained in light of the actual targets set for this study. The theory of change for the intervention posited that the study intervention would reduce the total SAM CFR to 10%, the SAM CFR in 24 hours to 5% and the SAM CFR among HIV-positive cases to 10% midway during the implementation of the project. When considering the model-predicted baseline levels for each outcome, as shown in Figs 3, 4, and 5, these short-term targets were met. The medium-term targets involved a reduction in total SAM CFR to 5%, the SAM CFR in 24 hours to 0% and the SAM CFR among HIV-positive cases to 5% just before the discontinuation of the intervention. Again, based on the model-predictedmortality levels shown in Figs 3 and 4, the first two targets were met in both hospitals. However, the target of reducing SAM CFR among HIVpositive cases to 10% was not met at hospital A, unlike at hospital B, as shown in Fig 5. The theory of change also posited that the levels of mortality for all three study outcomes - which were realised before the intervention was discontinued - would be maintained during the period when the intervention was not active; however, these targets were not met, indicating that the presence of the intervention had a positive effect on the outcomes of interest.
Despite the lack of statistical significance, however, the predicted changes in mortality trends during the intervention period demonstrate the possible effect of the intervention on mortality during this period. To our knowledge, the intervention occurred independently of other changes to the healthcare milieu during the study period. Furthermore, the shifts in mortality trends and levels were similar in both hospitals. This lends support to the view that the effects reported in this study were unbiased and associated with the corresponding presence of the intervention.[16] The lack of statistically significant reversal in the effects realised during the intervention period for all three outcomes is unlikely related to the number of data points used to estimate the effects. There is evidence to show that the minimum number of data points required to detect the effect is 12, before and after series interruption - in this case the discontinuation of the intervention.[19] The current study involved 69 data points in total, 32 of which were used in the pre-intervention discontinuation segment and 37 in the segment following the discontinuation. It is therefore possible that the effects were reversed, but not to levels that would have shown statistical significance.
An ethnographic study would have provided more elaborate insights into the process of care and the dynamics within the healthcare environment throughout the study intervention, to help validate the estimates reported here. Taljaard et al.[18] have cautioned about using ITS design to evaluate disease management interventions in healthcare facilities, as the process of care may involve subtle changes at individual level and different intervals, which may affect outcomes of interest.
This study raises an important research topic that can be investigated in future studies. The study intervention was designed to be self-sustaining through, to mention but a few, the standardisation of the process of care, provision of job aids and quality assurance resources, establishment of a healthcare monitoring infrastructure, as well as training and mentoring of a paediatric ward champion (paediatric nurse) to enforce the implementation of the intervention components and act as a healthcare advocate and the go-to health professional for relatively junior nurses. It was unclear whether the intervention alone or the involvement of the research team, or both, had an effect on the outcomes observed during the intervention period, as the withdrawal of the research team saw a reversal in the gains made during this period.
Study strengths
One of the strengths of this study design was its potential to control for selection bias as much as a randomised control trial.[15] The study outcomes were measured objectively and constituted at least 95% of SAM patients who were admitted during the study period. Furthermore, data analysis revealed that the model was free of autocorrelation and involved two comparable groups, a design which is encouraged in ITS analysis. The study involved a relatively well-conceived intervention design which was informed by the literature and practical experience.
Study limitations
The fact that the OLS regression method used in this study assumes a linear trend over time is a possible limitation to consider in light of the reported findings. Despite the measures put in place to verify the quality of the data used in this study, it was not ascertained beyond doubt that all the patients included in the dataset died solely as a result of SAM. Both hospitals receive large number of patients with SAM with HIV comorbidities, and it is possible that some patients may have died of HIV/AIDS rather than SAM. The use of covariates in the model would have been valuable to address this potential problem. The study was not designed to contextualise the trends in mortality during the study period, in terms of the process of care. This would have added value to findings reported here by suggesting some of the reasons why, for example, the intervention effects were not sustained after the intervention was discontinued.
Conclusion
The study showed that the presence of the intervention was associated with non-statistically significant monthly decreases in total CFR and early CFR associated with SAM, and that the discontinuation of the intervention reversed the effects slightly. These findings suggest that although the intervention was designed to be self-sustaining, this may not have been the case. A qualitative ethnographic enquiry into the process of care throughout the study period and the moderating factors responsible for the failure in sustaining such an intervention are encouraged in future research to substantiate the findings presented in this evaluation.
Acknowledgements. This research was made possible by a grant from the South African National Research Foundation (NRF) and the South African Centre for Epidemiological Modelling and Analysis (SACEMA). Its contents are solely the responsibility of the authors and do not necessarily represent the official views of the funders. Special thanks also go to all the staff from the two hospitals who contributed to the study.
Authors' contributions. TP and MM were involved in the conception of the study and MM was responsible for the acquisition, analysis and interpretation of data, as well as the drafting of the manuscript and finalisation for submission. Both authors have also given final approval of the version to be published and agree to be accountable for all aspects of the work.
REFERENCES
1. United Nations Children's Emergency Fund. Global Child Malnutrition Trends (1999 - 2012). New York: UNICEF, 2013 http://www.childinfo.org/malnutrition_dashboard.html (accessed 9 January 2016). [ Links ]
2. World Health Organization. Management of Severe Malnutrition: A Manual for Physicians and other Senior Health Workers. Geneva: WHO, 1999. http://whqlibdoc.who.int/hq/1999/a57361.pdf (accessed 12 January 2016). [ Links ]
3. World Health Organization. WHO Child Growth Standards and the Identification of Severe Acute Malnutrition in Infants and Children. A Joint statement by the World Health Organization and the United Nations Children's Fund. Geneva: WHO, 2009. http://apps.who.int/iris/bitstream/10665/44129/1/9789241598163_eng.pdf (accessed 10 December 2015). [ Links ]
4. United Nation Children's Fund/World Health Organization/World Bank. Levels and trends in child malnutrition. UNICEF/WHO/World Bank Group joint child malnutrition estimates. 2016. http://data.unicef.org/wp-content/uploads/2016/09/UNICEF-Joint-Malnutrition-brochure.pdf (accessed 6 Oct-ober 2016). [ Links ]
5. Pelletier DL, Frongillo EA, Schroeder DG, Habicht JP. The effects of malnutrition on child mortality in developing countries. Bull World Health Organ 1995;73(4):443-448. [ Links ]
6. Jackson A, Ashworth A, Khanum S. Improving child survival: Malnutrition task force and the paediatrician's responsibility. Arch Dis Child 2006;91(8):706-710. https://doi.org/10.1136/adc.2006.095596 [ Links ]
7. Waterlow JC. Metabolic adaptation to low intakes of energy and protein. Annu Rev Nutr 1986;6:495-526. https://doi.org/10.1146/annurev.nutr.6.1.495 [ Links ]
8. Heikens GT. How can we improve the care of severely malnourished children in Africa? Plos Med 2007;4(2):e45. https://doi.org/10.1371/journal.pmed.0040045 [ Links ]
9. Schub C. Management of severe malnutrition. S Afr J Clin Nutr 2010;23(1). https://doi.org/10.1080/16070658.2010.11734264 [ Links ]
10. Ashworth A, Khanum S, Jackson A, Schofield C. Guidelines for the Inpatient Treatment of Severely Malnourished Children. New Delhi: World Health Organization Regional Office for South-East Asia, 2003. http://www.who.int/nutrition/publications/guide_inpatient_text.pdf (accessed 2 June 2016). https://doi.org/10.1177/156482650502600215 [ Links ]
11. Puoane T, Cuming K, Sanders D, Ashworth A. Why do some hospitals achieve better care of severely malnourished children than others? Five-year follow-up of rural hospitals in Eastern Cape, South Africa. Health Policy Plan 2008;23(6):428-437. https://doi.org/10.1093/heapol/czn036 [ Links ]
12. Ayieko P, Ntoburi S, Wagai J, et al. A multifaceted intervention to implement guidelines and improve admission paediatric care in Kenyan district hospitals: A cluster randomised trial. PLoS Med 2011;8(4):e1001018. https://doi.org/10.1371/journal.pmed.1001018 [ Links ]
13. Biglan A, Metzler CW, Ary DV. Increasing the prevalence of successful children: The case for community intervention research. Behav Anal 1994;17(2):335-351. [ Links ]
14. Gillings D, Makuc D, Siegel E. Analysis of interrupted time series mortality trends: An example to evaluate regionalized perinatal care. Am J Public Health 1981;71(1):38-46. https://doi.org/10.2105/ajph.71.1.38 [ Links ]
15. Shadish RW, Cook DT, Campbell DT. Experimental and Quasi Experimental Designs for Generalized Causal Inference. 2nd ed. Boston: Houghton Mifflin Harcourt, 2002. [ Links ]
16. Linden A. Conducting interrupted time-series analysis for single- and multiple-group comparisons. Stata J 2015;15(2):480-500. [ Links ]
17. Murgod R, Ahmed M. Instant nutrition assessment in children with protein energy undernutrition. Int J Appl Bio Pharma Tech 2015;6(1):171-177. [ Links ]
18. Taljaard M, McKenzie, JE, Ramsay, CR, Grimshaw, JM. The use of segmented regression in analysing interrupted time series studies: An example in pre-hospital ambulance care. Implement Sci 2014;19(9):77-80. https://doi.org/10.1186/1748-5908-9-77 [ Links ]
19. Ramsay CR, Matowe L, Grilli R, Grimshaw JM, Thomas RE. Interrupted time series designs in health technology assessment: Lessons from two systematic reviews of behavior change strategies. Int J Technol Assess Health Care 2003;19(4):613-623. https://doi.org/10.1017/s0266462303000576 [ Links ]
 Correspondence:
M Muzigaba
mochemoseo@gmail.com

