


Services on Demand
Article
 English (pdf)
 Article in xml format
 Article references
Indicators

Related links
-
 Cited by Google
 -
 Similars in Google
Share

 Permalink
South African Journal of Child Health
On-line version ISSN 1999-7671
Print version ISSN 1994-3032
S. Afr. j. child health vol.11 n.1 Pretoria Jan./Mar. 2017
http://dx.doi.org/10.7196/sajch.2017.v11i1.1124
RESEARCH
doi:10.7196/sajch.2017.v11i1.1124
Nutritional status of children on the National School Nutrition Programme in Capricorn District, Limpopo Province, South Africa
F MalonganeI; X G MbhenyaneII
IDT (HPCSA), MSc; Department of Life and Consumer Sciences, College of Agriculture and Environmental Sciences, University of South Africa, Pretoria, South Africa
IIDT (HPCSA), PhD; Department of Interdisciplinary Health Sciences, Faculty of Medicine and Health Sciences, Stellenbosch University and Tygerberg Academic Hospital, Cape Town, South Africa
ABSTRACT
BACKGROUND. School feeding programmes are intended to alleviate short-term hunger, improve nutrition and cognition of children, and provide incomes to families.
OBJECTIVES. To assess the nutritional status of children receiving meals provided by the National School Nutrition Programme (NSNP) in Capricorn Municipality, Limpopo Province, South Africa.
METHODS. The setting was 18 randomly selected schools on the NSNP in Capricorn District. The total sample comprised 602 randomly selected schoolchildren from grades 4 to 7, aged 10 (26.6%), 11 (35.4%) and 12 (35.4%). Socioeconomic characteristics, anthropometric measurements, dietary patterns and school attendance were determined. Children were interviewed to assess their nutritional status using a validated questionnaire. Descriptive statistics such as means, standard deviations (SDs) and ranges were used for socioeconomic parameters and dietary patterns, and z-scores for anthropometric data.
RESULTS. The results showed that boys (9.5%) and girls (7.8% ) were underweight. The prevalence of stunting in the sample was 11.3% for boys and 7.4% for girls, whereas boys (3.6%) and girls (4.2%) were wasted, with a z-score of -2 SD. School attendance was good.
CONCLUSION. The nutritional status of most subjects in the study was within the acceptable range as indicated by the assessment of growth using anthropometric measurements.
School feeding programmes have been implemented in both developed and developing countries, where they are often implemented by national government organisations or nongovernmental organisations (NGOs). The largest provider in developing countries is the United Nations with its World Food Programme, which was operational in up to 78 countries in 2006.[1] Numerous other agencies and NGOs operate school feeding programmes at the national, regional and local levels.[1] The National School Nutrition Programme (NSNP), commonly known as the school feeding scheme, was introduced in South Africa (SA) by the government in 1994 to alleviate hunger and contribute to learning in schools by providing learners with nutritious meals.[2]
There is evidence that education and learning depend on good nutrition. Studies done in Honduras showed that the academic performance and mental ability of learners with good nutritional status were significantly higher than those of learners with poor nutritional status, irrespective of the level of family income, school quality and teacher ability.[3] School feeding alleviates short-term hunger, thus enhancing active learning capacity, school attendance and punctuality among needy and hungry children. In Jamaica, providing breakfast to primary school learners significantly increased attendance and arithmetic scores.[4] A similar study in the USA showed the benefits of providing breakfast to disadvantaged primary school learners. This programme, which targeted children coming from low-income families, improved their test scores significantly and improved school attendance.[5]
In SA, the NSNP is designed to identify and reach areas where poverty is most extreme, with the aim of providing one meal or snack a day by 10h00 through approved menu options.[6] The NSNP, as implemented in Limpopo Province, follows a warm menu which includes beans, soya, samp and vegetables as well as bread and peanut butter. The minimum number of days for feeding was reported to be 156 out of 197 school days in a year.[6] The Limpopo Province initially aimed to provide state-funded primary schools with NSNP meals for grade R to grade 7 learners, with priorities given to those situated in rural areas, farms and informal settlements.[6] The programme was extended to secondary schools in 2009 and has progressively covered quintiles 1 - 3.[2]
Limpopo is known to be one of the poorest provinces in SA, with 89.0% of the provincial population living in rural areas and 11.0% in urban/peri-urban areas, with a very high rate (38.9%) of unemployment.[7] There are more than 2 747 primary schools in the province, most of which are situated in rural and peri-urban areas.[7]
The objective of this study was to assess the socioeconomic characteristics, anthropometric status, school attendance and dietary patterns of children receiving NSNP meals in Capricorn District Municipality of Limpopo.
Methods
A descriptive, cross-sectional survey design was used to obtain data on selected parameters of primary schoolchildren on the NSNP in Capricorn District, Limpopo Province, SA. Prior to the collection of data, written permission was obtained from the Limpopo Department of Education and local education authorities. Parents were requested to give written consent after an information leaflet had been sent to them. Ethical clearance was given by the University of Venda research ethics committee. The survey was conducted in 18 (10.7%) primary schools randomly selected from a total of 169 in the district. All children aged 9 - 13 years in grades 4 - 7 were recruited, and those whose parents consented to participation were included in the study. The volunteers responsible for the preparation of school meals were consulted to provide information on the NSNP meals. Two volunteers per school were randomly selected on the day of data collection. Data collection was conducted from May 2007 to March 2008.
Variables measured included socioeconomic factors, anthropometric status, school attendance and usual dietary patterns. Socioeconomic factors affecting children's dietary patterns were parents' employment status, receipt of pension or children's grants and number of household members. These data were collected by the researcher and two trained field workers, who were trained nutritionists, using a researcher-administered standardised questionnaire. The language used for interviews was Sepedi. School attendance refers to the number of days attended v. the number of school days. Anthropometric status for the purpose of this study included height and weight, from which height-for-age (HAZ), weight-for-age (WAZ), weight-for-height (WHZ) and body mass index (BMI) z-scores were calculated. Height was recorded without shoes using a measuring board and read to the nearest 0.5 cm. The subjects were weighed using a calibrated electronic scale and the weight was recorded to the nearest 0.2 kg. All measurements were done by a trained 3rd-year nutrition student of the University of Venda and were monitored and checked by the researcher.
Usual dietary patterns and food from the NSNP meal were measured using selected food frequency and 24-hour recall instruments. The SA Medical Research Council dietary analysis software program was used to analyse the dietary data collected.[8]
Dietary patterns included meal frequency, frequency of food consumption and consumption of breakfast, all of which were measured via a food frequency questionnaire. The 24-hour recall was provided by two volunteers per school working on the NSNP with the purpose of verifying the meal provided at the school a day before.
The reliability and validity of the questionnaires were tested in a pilot study. Necessary adjustments were made thereafter; the children involved in this pilot study were not included in the final survey. Statistical analysis was conducted to determine the mean weight and height of children as well as the z-score distribution of the anthropometric variables. The data were exported into Statistical Package for Social Sciences version 21 (IBM Corp., USA) for further analysis. The Centers for Disease Control/National Center for Health Statistics 2000 growth references/standards were used to determine z-score values during analysis. Dietary reference intakes were used to estimate nutrient adequacy of the subjects.[9]
Results
Socioeconomic factors
The study included 602 children from 18 primary schools. Their ages ranged from 9 to 13 years and females represented 63.3% of the total sample. Table 1 provides a summary of the demographic characteristics of the study population.

Anthropometric measurements
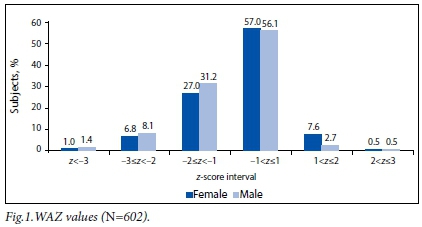
WAZ values of children
The majority of children were of normal weight for age (Fig. 1).
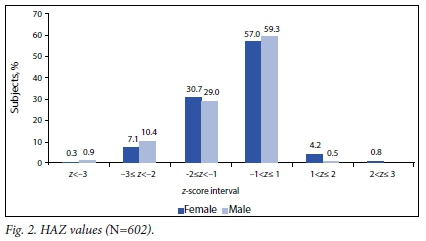
HAZ values of children
The interval for normal height had the highest number of children, both male and female. Of the children, <10% were stunted and <8% were tall for their age (Fig. 2).

BMI values of children
The majority of the participants (67.2% of males, 71.5% of females) had normal BMI values for their age. Of the female participants, 20.5% were <-1 standard deviation (SD) while the same was true for 19.9% of the male participants. The difference was not regarded as significant. Few children (8.6% of males, 12.3% of females) were >+1 SD.
School attendance
School attendance was also determined as a percentage, with 100% meaning all school days had been attended. The majority (74.9%) of participants attended all their school days, 19.1% missed 1 - 2 school days, 4.4% missed 3 - 4 days and 0.7% missed 5 - 8 days. Only 1.3% missed 9 - 16 school days.
Dietary patterns
The majority (77.2%) of the participants ate breakfast more than five times a week, while 22.5% did not have breakfast or did so only occasionally. Ninety-five percent of subjects reported eating three or four meals per day, with 93.5% consuming porridge and 74.8% eating bread four to seven times a week and 21.4% and 15.8% eating rice and potato, respectively. Fish (76.2%), chicken necks, feet and livers (70.1%) and chicken meat (63.5%) were the highest consumed protein products at one to three times a week. The majority of subjects reported consuming eggs (72.6%), yoghurt (59%) and milk (58.6%) one to three times a week. Furthermore, the majority of subjects reported consuming peanuts (75.4%), beans (69.4%) and peas (39.9%) one to three times a week.
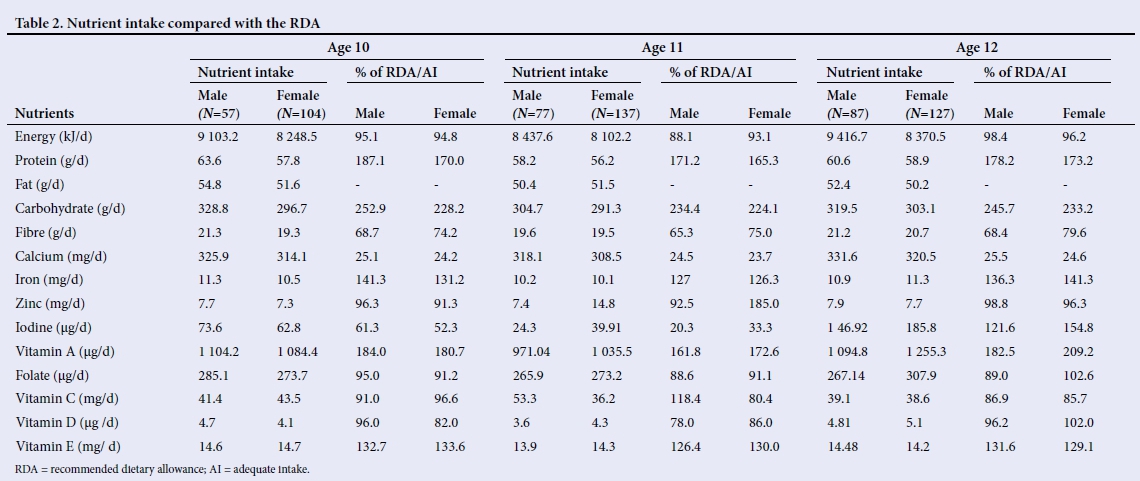
More than half of the participants reported eating vegetables one to three times a week, while <18% were consuming vegetables regularly (four to seven times a week). Cabbage (59.6%), beetroot (59.3%), traditional vegetables (53.2%) and spinach (51.8%) were mostly consumed at least one to three times a week. Most of the participants reported consuming fruit one to three times a week, with only 4.5% not eating fruit at all. Apples and bananas were consumed by 26.7% and 18.9%, respectively, four to seven times a week. The majority of subjects reported drinking tea or coffee (66.4%), artificial juice (41.3%) and carbonated drinks (11.0%) four to seven times a week. Margarine was the most-used bread spread with 36.2% of participants using it four to seven times a week, while 14.7% and 10.8% reported using peanut butter and jam, respectively, four to seven times a week. The majority of participants reported eating maize chips (60.6%), sweets (56.6%), potato chips (54.3%) and ice cream (51.5%) one to three times a week. Dietary pattern data also included meals provided by the NSNP. The average intake of nutrients is presented in Table 2.
Discussion
The majority of the children were in grades 4 - 6. This is in contrast to a Jamaican study, which selected children in grades 3 and 4.[10] Similar grades were selected by an SA study that focused on grades 5 - 7.[11] The present study's selection of grades was based on the ability of the children to recall information. Most of the participants were within the age range 10 - 12 years.
The unemployment rate in Limpopo was 38.9% in 2011.[7] In the present study, participants' fathers had showed a lower unemployment rate of 17.3% compared with the national statistic of 29.8% and the provincial statistic of 38.9%, while close to 49.5% of participants' mothers were unemployed. In addition, 24.0% of mothers occupied lower-paid jobs such as service workers compared with fathers (18.9%), and only 11.0% of mothers were public servants compared with 23.3% of fathers. It has been reported by Casale and Posel[12] that even though more women are represented in the labour force than previously, there is still a rising rate of female unemployment and low-paid and insecure forms of employment are becoming increasingly feminised. It is well known that the unemployment rate is high among women in SA and that this is worse in rural areas.[13]
Subjects receiving child grants constituted 50.5% of the study population, meaning that they had passed the social development means test. This observation is in agreement with the report of the Department of Health and Social Development, which stated that over half of rural households nationally received government grants.[14] Such grants can be used to purchase food, thus leading to improved nutritional status. At the time of this study, the child grant was valid for children up to 14 years of age and the amount was ZAR180 per month per child. Approximately 69.8% of children in this study were receiving some form of government grant, supporting the characterisation of Limpopo as being largely rural.[15]
The WAZ values in the present study showed that the majority of females (91.6%) and males (90.0%) were within the acceptable weight range. Male children were found to be most affected by underweight (<-2 SD) at 9.5% while the figure for females was at 7.8%, indicating low public health significance given that the prevalence of underweight was <10%.[16] The results were similar to those reported by the SA anthropometric survey, the National Food Consumption Survey (NFCS)-Fortification Baseline and the NFCS, which found 9.0, 9.3 and 10.0% of SA children to be underweight, respectively.[17-19] Compared with a Nigerian semi-urban population study that revealed 25.5% of children were underweight,[20] SA has a low prevalence of underweight children. The good nutritional status of SA children could be explained by the fact that their dietary patterns suggest that they were consuming adequate levels of all macro- and micronutrients. Their good school attendance also meant they received the school meal daily.
HAZ values were similar for both female and male children between 9 and 12 years. Similar results have been reported by Oninla et al.,[22] with boys being taller than girls until the age of 2 years and there being no statistical difference in height for age in both sexes thereafter. This study showed that 10.4% of male participants and 7.1% of females were moderately stunted (<-2 SD). The incidence of stunting was low compared with World Health Organization guidelines, which rate a country as moderately affected by stunting if 25 - 50% of its children are stunted.[16] Studies conducted in Nigeria[22] and on the tea-garden workers of Assam, India,[23] found a high level of stunting among children between 9 and 14 years at 27.6% and 53.9%, respectively. The results of the present study concur with those of a study carried out in Agincourt, a rural sub-district of Mpumalanga Province, SA, which reported the stunting rate to be 5.0% and 9.0% among children of 5 - 9 and 10 -14 years of age, respectively.[24] The lower levels of stunting observed in the present study could be the result of a combination of factors, which may include direct or indirect nutritional interventions, e.g. child support grants, the NSNP and fortification of maize meal and bread. It was reported in a review study conducted on the impact of school feeding in developing countries that school-fed children gained 1.43 cm (in height) more than controls who were not given the school meal.[25] However, the present study did not include a comparative study or a before-or-after trial effect owing to a lack of assessment before the commencement of the NSNP in Limpopo. There was a small difference in the BMI pattern of the two sex groups within the age range from 9 to 12 years. Female participants were slightly heavier than males, contrary to what has been reported in Osun State, Nigeria, where wasting was higher in females (15.0%) than in males (13.0%).[26] In the current study the level of severe wasting (<-3 SD) was low for both males (0.9%) and females (0.8%). Only 3.4% of females and 2.7% of males had moderate wasting (<-2 SD). Studies conducted in Nigeria among primary schoolchildren reported the grade 1 level of wasting to be 77.3%, which indicated that wasting remains a problem in some African countries.[27] The present study concurs with the NFCS and the SA anthropometric survey that reported wasting to be at 3.7% and 2.6%, respectively.[17,18] Very few males (0.5%) and females (1%) were overweight (>+2 SD). The results for overweight were low compared with the results of a study conducted in five SA provinces, which showed a prevalence of overweight of 14.0% for boys and 17.9% for girls.[28] The present study did not include children from urban areas as their schools were excluded from receiving NSNP meals.
The average intake of all nutrients of all age groups and sexes was good except for females in age group 10, who reported 52.3% of the recommended dietary allowance (RDA) for iodine intake, and males in age group 11, who had 20.3% for iodine. All age groups had a calcium intake of <25.5% of the RDA and AI (adequate intake). They also reported a moderate intake of fibre, <79.6% of the AI with the exception of males aged 11 years. The intakes of protein, carbohydrates, vitamin A and vitamin E were above the RDA/AI. Children who either missed or only had breakfast occasionally constituted 22.5% of the study population. This is in agreement with what has been reported[29] in another SA study, the Birth to Twenty Cohorts study, where only 76.4% of children aged 13 had breakfast. The recommendation of 400 g of fruits and vegetables a day,[30] the equivalent of five servings of 80 g each, was not met in this study group. The majority of participants consumed vegetables or fruits one to three times a week, including those provided by NSNP meals. Similar results were reported in KwaZulu-Natal Province, SA, where consumption of fruits and vegetables was low, especially among the low living standard measure categories.[31] Good school attendance in this study could not be attributed to the school feeding programme since the researcher did not obtain retrospective data preceding the feeding programme.
Conclusion
The unemployment rate of mothers was high (49.5%) compared with that of fathers (17.3%), and the majority of subjects (69.8%) depended on government grants. The anthropometric measurements revealed that most children were of normal weight, and normal height and had a normal weight for height. A small number of children showed stunting and wasting, which could have serious health implications and warrants attention. Most children attended school and consumed the NSNP meals. Fruit and vegetable consumption was reported to be low in most subjects. There is a need for more continuous nutritional assessment of learners receiving NSNP meals to allow for a proper evaluation of programme effectiveness. Further studies should explore the impact of the NSNP on the educational performance outcomes of the primary school children.
REFERENCES
1. Briggs B. School feeding programs: Summary of the Literature and Best Practices. Village Hope Technical Report 6. Idaho, USA:Village Hope, 2008:3-4. [ Links ]
2. Department ofBasic Education, South Africa. National School Nutrition Programme. http://www.education.gov.za/Programmes/NationalSchoolNutritionProgramme (accessed 24 June 2013). [ Links ]
3. Wilcox M, Israel R, Praun A. Lessons Learned from Honduras School Nutrition and Health Assessment Study. Newton, Mass., USA: Education Development Center, 1993:5-7. [ Links ]
4. Simeon DT, Grantham-McGregor S. Effects of missing breakfast on the cognitive functions of school children of differing nutritional status. Am J Clin Nutr 1989;49(4):646-653. [ Links ]
5. Meyers AF, Sampson AE, Weitzman M, Rogers BL, Kayne H. School breakfast program and school performance. Am J Dis Child 1989;143(10):1234-1239. [ Links ]
6. Kallman K. Food for Thought: A review of the National School Nutrition Programme. In: Leatt A, Rosa S, eds. Towards a Means to Live: Targeting Poverty Alleviation to Make Children's Rights Real. Cape Town: Children's Institute, University of Cape Town, 2005:12-13. [ Links ]
7. Statistics South Africa. Census 2001: Provinces at a Glance. Pretoria: SSA, 2012:1-43. [ Links ]
8. Food Finder 3. Dietary analysis software program, version 1.0.7. Cape Town: South African Medical Research Council, 2002. [ Links ]
9. Mahan KL, Escott Stump S. Krause's Food Nutrition and Diet Therapy, 12th ed. St. Louis, Mo,: Elsevier, 2008:39-135. [ Links ]
10. Grantham-McGregor SM, Chang S, Walker SP. Evaluation of school feeding programs: Some Jamaican examples. J Clin Nutr 1998;67(Suppl):S785-S789. [ Links ]
11. Faber M, Laubscher R, Berti C. Poor dietary diversity and low nutrient density of the complementary diet for 6- to 24-month-old children in urban and rural KwaZulu-Natal, South Africa. Matern Child Nutr 2014;5(5):1-18. http://dx.doi.org/10.1111/mcn.12146 [ Links ]
12. Casale D, Posel D. The continued feminisation of the labour force in South Africa: An analysis of recent data and trends. S Afr J Econ 2002;70(1):156-184. http://dx.doi.org/10.1111/j.1813-6982.2002.tb00042.x [ Links ]
13. Kongolo M, Bamgose OO. Participation of rural women in development: A case study of Tsheseng, Thintwa, and Makhalaneng villages, South Africa. J Int Womens Stud 2002;4(1):79-92. [ Links ]
14. Department of Health and Social Development, South Africa. Socio-economic Impact of HIV and AIDS on Population and Development in Limpopo Province. Polokwane: Limpopo Provincial Government, 2006:4-5. [ Links ]
15. Neves D, du Toit A. Rural livelihoods in South Africa: Complexity, vulnerability and differentiation. J Agrar Change 2013;13(1):93-115. http://dx.doi.org/10.1111/joac.12009 [ Links ]
16. De Onis M, Habicht JP. Anthropometric reference data for international use: Recommendations from a World Health Organization expert committee. Am J Clin Nutr 1996;64(4):650-658. [ Links ]
17. Labadarios D, Steyn N, Maunder E, et al. The National Food Consumption Survey (NFCS): Children aged 1 - 9 years, South Africa. Stellenbosch: Department of Health, Directorate of Nutrition, 2000:1-20. [ Links ]
18. Vorster HH, Oosthuizen W, Jerling JC, Veldman FJ, Burger HM. The Nutritional Status of South Africans: A Review of the Literature from 1975 - 1996. Durban: Health Systems Trust, 1997:7-10. [ Links ]
19. Kruger HS, Steyn NP, Swart EC, et al. Overweight among children decreased, but obesity prevalence remained high among women in South Africa, 1999- 2005. Public Health Nutr 2011;15(4):594-599. http://dx.doi.org/10.1017/S136898001100262X [ Links ]
20. Fetuga MB, Ogunlesi TA, Adekanmbi AF, Alabi AD. Nutritional status of semi-urban Nigerian school children using 2007 WHO reference population. West Afr J Med 2011;30(5):331-336. [ Links ]
21. Botton J, Heude B, Maccario J, Ducimetière P, Charles MA, LFVS Study Group. Postnatal weight and height growth velocities at different ages between birth and 5 y and body composition in adolescent boys and girls. Am J Clin Nutr 2008;87(6):1760-1768. https://dx.doi.org/10.1159/000362203 [ Links ]
22. Oninla SO, Owa JA, Onayade AA, Taiwo O. Comparative study of nutritional status of urban and rural Nigerian school children. J Trop Pediatr 2007;53(1):39-43. https://dx.doi.org/10.1093/tropej/fml051 [ Links ]
23. Medhi GK, Barua A, Mahanta J. Growth and nutritional status of school age children (6 - 14 years) of tea garden worker of Assam. J Hum Ecol 2006;19(2):83-85. [ Links ]
24. Kimani-Murage EW, Kahn K, Pettifor JM, et al. The prevalence of stunting, overweight and obesity, and metabolic disease risk in rural South African children. BMC Public Health 2010;10(1):158-170. http://dx.doi.org/10.1186/1471-2458-10-158 [ Links ]
25. Jomaa LH, McDonnell E, Probart C. School feeding programs in developing countries: Impacts on children's health and educational outcomes. Nutr Rev 2011;69(2):83-98. http://dx.doi.org/10.1111/j.1753-4887.2010.00369.x [ Links ]
26. Falade OS, Otemuyiwa I, Oluwasola O, Oladipo W, Adewusi SA. School feeding programme in Nigeria: The nutritional status of learners in a public primary school in Ile-Ife, Osun State, Nigeria. Food Nutr Sci 2012;3(5):596-605. http://dx.doi.org/10.4236/fns.2012.35082 [ Links ]
27. Goon DT, Toriola AL, Shaw BS, et al. Anthropometrically determined nutritional status of urban primary schoolchildren in Makurdi, Nigeria. BMC Public Health 2011;11(1):769-777. http://dx.doi.org/10.1186/1471-2458-11-769 [ Links ]
28. Armstrong MEG, Lambert MI, Sharwood KA, Lambert EV. Obesity and overweight in South African primary school children - the Health of the Nation Study. S Afr Med J 2006;96(5):439-444. https://dx.doi.org/10.1080/22201009.2006.10872144 [ Links ]
29. Feeley A, Musenge E, Pettifor JM, Norris SA. Changes in dietary habits and eating practices in adolescents living in urban South Africa: The birth to twenty cohort. Nutrition 2012;28(7-8):e1-e6. http://dx.doi.org/10.1016/j.nut.2011.11.025 [ Links ]
30. World Health Organization, Food and Agricultural Organization. Diet, nutrition, and the prevention of chronic diseases: Report of a joint/FAO expert consultation. Geneva: WHO, 2003;95-101. [ Links ]
31. Faber M, Laubscher R, Laurie S. Availability of, access to and consumption of fruits and vegetables in a peri-urban area in KwaZulu-Natal, South Africa. Matern Child Nutr 2013;9(3):409-424. http://dx.doi.org/10.1111/j.1740-8709.2011.00372.x [ Links ]
 Correspondence:
F Malongane
malonf@unisa.ac.za

