


Services on Demand
Article
 English (pdf)
 Article in xml format
 Article references
Indicators

Related links
-
 Cited by Google
 -
 Similars in Google
Share

 Permalink
South African Journal of Child Health
On-line version ISSN 1999-7671
Print version ISSN 1994-3032
S. Afr. j. child health vol.10 n.1 Pretoria Jan./Mar. 2016
http://dx.doi.org/10.7196/sajch.2016.v10i1.984
RESEARCH
Selected facets of nutrition during the first 1 000 days of life in vulnerable South African communities
L M du PlessisI; M G HerselmanI; M H McLachlanI; J H NelII
IPhD; Division of Human Nutrition, Faculty of Medicine and Health Sciences, Stellenbosch University, Cape Town, South Africa
IIPhD; Department of Logistics, Faculty of Economic and Management Sciences, Stellenbosch University, Cape Town, South Africa
ABSTRACT
BACKGROUND: Optimal nutrition during the first 1 000 days of life can reap lasting benefits throughout life.
OBJECTIVES: To assess infant and young child-feeding (IYCF) practices and mother/caregiver-child anthropometry in two vulnerable Breede Valley communities, Western Cape.
METHODS: Mothers of children aged 0 - 23 months (N=322) were interviewed to assess IYCF practices. Anthropometric measurements of mothers/caregivers and children were performed according to standard procedures.
RESULTS: Mothers reported early breastfeeding (BF) initiation in 75.2% (242/322) of cases. Of infants <6 months old, 38.5% (45/117) were recorded as exclusively breastfed (EBF). Cross-checking this figure with other research from the area, however, suggests significant over-reporting of EBF. One in five infants <6 months were exclusively bottle fed (19.7%; 23/117) and 48.4% (156/322) aged 0 - 23 months had received bottle feeding in the preceding 24 hours. Eighty-four percent (36/43) of 6 - 8-month-old infants were receiving complementary foods. BF was continued in 32.5% (13/40) of children 12 - 15 months old. In children 6 - 23 months, 44.0% (90/205) received foods from four or more food groups, 71.0% (145/205) received complementary foods the recommended minimum number of times or more, and 44.4% (91/205) received a minimum acceptable diet. The prevalence of stunting and overweight in children was 28.9% and 21.8%, respectively. The prevalence of overweight in mothers/caregivers was 28.9%, and 33.7% were obese, with a mean waist circumference of 88.6 cm
CONCLUSION: Indicators showed sub-optimal IYCF practices with child under- and overnutrition coexisting with maternal/caregiver overnutrition. This profile signals a need for urgent and appropriate interventions focusing on the first 1 000 days of life.
Background
A growing body of evidence is intensifying the focus and interest around the importance of nutrition during the first 1 000 days of life, i.e. from pregnancy up to a child's second birthday.[1-3] Achieving good nutrition and healthy growth during this well-delineated time period in the lifecycle has been shown to reap lasting benefits throughout life.[1-6] This statement is more profound in view of the findings published in the Lancet Series on Maternal and Child Nutrition, 2013, [7] which stated that maternal and child malnutrition is persistent and encompasses both undernutrition and a growing problem of overweight and obesity in low- and middle-income countries. Concerted efforts should therefore be made to curb malnutrition in women of childbearing age as well as newborns and young children.[7]
It is very important to assess infant and young child feeding (IYCF) practices on a continuous basis in order to act on problem areas appropriately and timeously.[8] A World Health Organization (WHO) Working Group developed valid and reliable indicators to assess IYCF practices.[9] These indicators focus on selected food-related aspects of child feeding that could be measured using data from population surveys.[9,10] They were mainly designed for use in large-scale surveys or national programmes, but it was proposed that they could also be used in smaller local and regional programmes.[9] The United Nations Children's Fund (UNICEF) Programming Guide (2011) recommends that these WHO indicators be used for the situation assessment in the core process of development, planning and implementation of a comprehensive approach to improving IYCF.[8]
A review of the IYCF practices around the world, using data derived from 86 developing countries with trend data on key indicators, painted a dismal picture.[8] The global rate for early initiation of breastfeeding remains below 40% and the rate of exclusive breastfeeding (EBF) during the first 6 months of life has only increased slightly (from 33% to 38%) over the past decade. The global data reflect very slow advancement in improving overall EBF, but countries that have shown strong commitment and have devoted serious attention to improving IYCF have shown significant progress.[8]
There is a less clear global picture for complementary feeding, since the indicators to measure this were finalised after those for breastfeeding.[9] However, according to the State of the World's Children (2010) report, in developing countries only 58% of breastfed children aged 6 - 9 months had received any complementary foods in the previous 24 hours.[11] When stunting figures (29% on a global level in 2010) are reviewed to inform this picture, it becomes evident that a large proportion of young children are not receiving a varied diet on a frequent basis.[11]
South Africa (SA) is classified as one of the 36 high-burden countries for child malnutrition, with specific reference to a stunting prevalence of higher than 20%.[12] In the absence of trend data on IYCF in SA, other information and indices have to be used to inform the IYCF profile. The anthropometric status of young children in SA (i.e. >20% stunting, ~10% underweight and >30% overweight and obesity combined) is coupled with the presence of micronutrient malnutrition, including deficiencies in vitamin A, iron and a range of other micronutrients.[13,14] National breastfeeding data for SA are scarce, but there are reports of 88% of mothers initiating breastfeeding after birth.[15] The very low rates of reported EBF of ~8% at 6 months of age are of concern.[15] The majority of infants are formula fed or mixed fed and more than 70% receive other fluids and foods before the age of 6 months.[15,16]
Female overweight and obesity (25% and 40%, respectively) in SA, described in the South African National Health and Nutrition Examination Survey (SANHANES-1), are also of concern.[14] Coupled with a vitamin A deficiency (VAD) prevalence of 13%, which indicates a moderate public health problem and anaemia prevalence of 23%, SA women of childbearing age (15 years and older)[14] face a predicament in the context of maternal nutritional health and resultant birth outcomes.[7]
The Community-Based Nutrition Security Project (CNSP) of the Division of Human Nutrition, Stellenbosch University, investigated the community food security situation in two vulnerable communities (Avian Park and Zweletemba) in the Breede Valley sub-district, Western Cape Province. This baseline survey provided an opportunity to investigate IYCF practices at household level in this area.
The main objective of this sub-section of the CNSP baseline survey was to assess the feeding practices of infants and young children aged 0 - 23 months with the core WHO validated indicators. The IYCF practices will be discussed within the context of selected anthropometric measurements of mother/caregiver-child pairs.
Methods
Study design and sample selection
A descriptive cross-sectional study was conducted. The sampling frame of the CNSP baseline survey consisted of all households within the selected communities. A simple random selection of households was performed. Households with young children (0 - 36 months) were the basic unit for selection and assessment in the CNSP study. A qualifying household was defined as 'any household with at least one child (0 -36 months) and mother/primary caregiver pair. Age was verified with a birth certificate or Road-to-Health Booklet (SA tool to assess and monitor the health status of children younger than 5 years). In situations where more than one household lived at an address and both households had a qualifying mother/primary caregiver-and-child pair, participation was determined through random selection. The same procedure was followed if more than one child of the same mother/ primary caregiver qualified for inclusion.
Households with infants or children between the ages of 0 and 36 months, who resided in Zweletemba or Avian Park for at least 27 weeks of the year, were eligible for inclusion.
Sample size
A power analysis on one-way analysis of variance (ANOVA) with a 5% significance design provided 90% power with a sample size of 170 per group (two groups in two areas). To allow for a response rate of 85%, the total sample size was calculated at 200 per group per area. The final, slightly oversampled, sample size of the CNSP study was 443 mother/primary caregiver and child pairs. For the focus of this article, complete data were captured for 322 infants/young children in the age range 0 - 36 months (n=117 aged 0 - 6 months; n=205 aged 6 - 23 months), and a total of 312 for the mothers/caregivers.
Methodology
The complete methodology of the CNSP baseline survey is described in the parent protocol (Ethics Committee Ref No: N10/11/368).
The assessment of IYCF practices for children aged 0 - 23 months as well as a description of selected demographic and anthropometric data for these children and their mothers/caregivers is provided here.
IYCF questionnaire
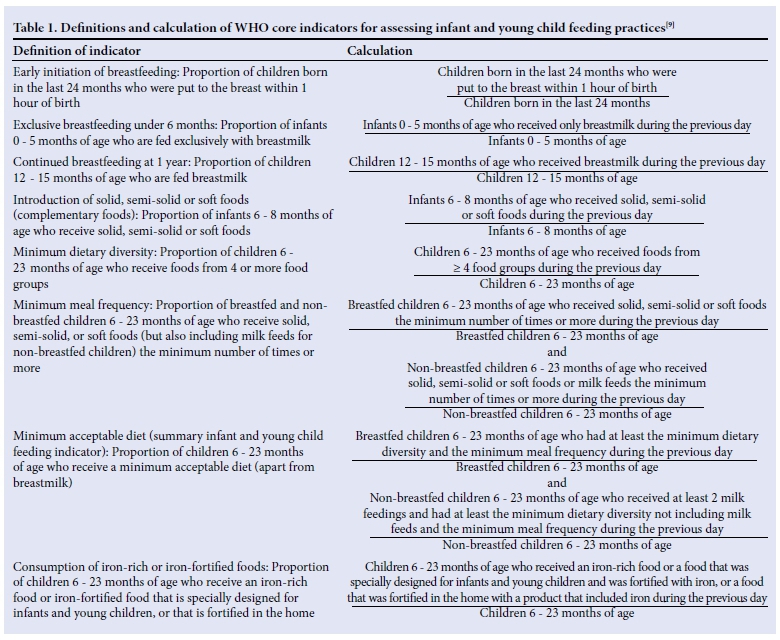
A one-page questionnaire consisting of ten questions was formulated based on the wording of the eight WHO-validated IYCF core indicators[9] (Table 1; column 1). It also included two questions on bottle-feeding from the optional indicators. The questionnaire had to be administered time-efficiently, since the anthropometric measurements and interviews (including sociodemographic questionnaire, household food insecurity access scale, food frequency questionnaire, hunger questionnaire and a dietary diversity questionnaire for mothers and children) of the broader CNSP baseline survey took approximately 2 hours to complete.
All questions were based on recall of the previous day, except for 'breastfeeding initiation' which was based on historic recall and Does your baby receive any of the following (iron sources)?' which was based on usual practice. The age range for the questions was 0 - 23 months, divided into specific monthly intervals, as appropriate to capture information for the different indicators. All questions could be answered either by 'yes' or 'no.
Training of fieldworkers, pilot study and data collection
Women were recruited from the two communities included in the study to act as fieldworkers. These fieldworkers were trained and standardised to administer the IYCF questionnaire, together with other questionnaires within the broader CNSP survey.
Height/length and weight measurements of children and the weight, height and waist circumference (WC) measurements of mothers/ primary caregivers were taken by two dietitians aided by two trained assistants, according to standard procedures.[17,18]
A pilot study was conducted in March 2011 over a period of 1 week in order to test the face and content validity of all the questionnaires. Data collection took place between March and July 2011. During data collection, questionnaires were checked for completeness and accuracy by CNSP research staff.
Data analysis
Data were captured in Microsoft Excel and analysed using SAS 9.3 (2002 - 2010) (SAS Institute Inc., USA).[19]
IYCF indicators were calculated as prescribed in the 'Indicators for assessing infant and young child feeding practices: Part I' (Table 1; column 2) document.[9] Demographic data and indicators were described using means, standard deviations and percentages.
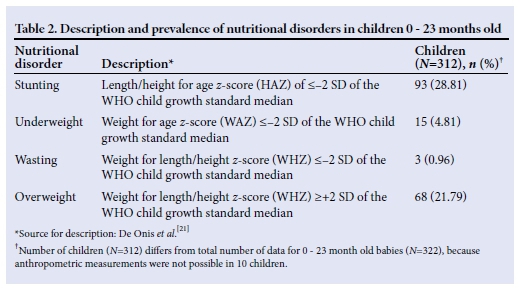
Children's ages, weights and heights were used to calculate length/height-forage z-scores (HAZ), weight-for-age z-scores (WAZ), weight-for-length/height z-scores (WHZ) and body mass index (BMI)-for-age z-scores (BAZ) using WHO Anthro (version 3.2.2) software (StatSoft, 2013, USA).[20] Data were interpreted using WHO child growth standards and cut-off values[21] (Table 2).
Adult women's BMI (weight (in kg)/ height (in m2)) was interpreted using the WHO Consultation on Obesity classification (1999), i.e. underweight (BMI <18.5 kg/m2), normal weight (BMI = 18.5 - 24.99 kg/m2), overweight (BMI = 25 - 29.99 kg/m2) or obese (BMI >30 kg/m2) as well as waist circumferences with a cut-off point of 88 cm indicating a substantially increased risk of metabolic complications.[22] The cut-off used for maternal short stature is a height measurement of <1.45 m.[23]
Ethics and legal aspects
Ethics approval was granted for the CNSP baseline survey from the Health Research Ethics Committee, Faculty of Medicine and Health Sciences, Stellenbosch University (Ref No. N10/11/368). The consent form was explained and written informed consent was obtained from the mothers of the infants/ young children. This document was available in the three official languages of the Western Cape, i.e. English, Afrikaans and isiXhosa. Participants were ensured of the anonymous nature of the interviews. Confidentiality was ensured by not recording any personal identification on records and anonymity was ensured by referring only to the group as a whole and not to individuals or individual findings.
Results
Selected demographic and anthropometric data of mothers and children
The average age (standard deviation (SD)) of the mothers/caregivers of children aged 0 -23 months was 29.5 (9.67) years and that of the children was 9.85 (7.11) months. Of the mothers/caregivers, 89.1% (278/312) were the children's biological mothers and 10.9% were caregivers (grandmothers/day-mothers).
The mean (SD) BMI of mothers/caregivers was 28.52 (7.98) kg/m2. The prevalence of underweight was 4.2%; normal weight was 33.3%; overweight was 28.9% and obesity 33.7%. The mean (SD) waist circumference was 88.6 (16.89) cm in mothers/caregivers of children aged 0 - 23 months. Mean (SD) maternal/caregiver height was 1.56 (0.073) m.
The prevalence of stunting, underweight, wasting and overweight (Table 2) in children aged 0 - 23 months was 28.9%, 4.8%, 0.96% and 21.8%, respectively.
Infant and young child feeding (IYCF) practices
Breastfeeding initiation within 1 hour after birth was calculated to occur in 75.2% (n=242/322) of the sample. Thirty-eight and a half percent (38.5%; n=45/117) of the infant population younger than 6 months was recorded as being exclusively breastfed (EBF). Breastfeeding was continued in 32.5% (n=13/40) of babies 12 - 15 months of age.
Nearly 20% of babies 0 - 6 months of age received exclusive bottle feeding (19.7%; 23/117), while 48.4% of babies aged 0 - 23 months received bottle feeding in the preceding 24-hour period (156/322).
Eighty-four percent (36/43) of infants 6-8 months of age received solid, semi-solid or soft foods. The proportion of children 6-23 months of age who received foods from four or more food groups was calculated at 44.0% (90/205). These food groups included: (i) grains, roots, tubers (e.g. bread, cereal, cooked porridge or potato); (ii) legumes and nuts; (iii) dairy products, excluding breastmilk (milk, yoghurt, cheese); (iv) meat, fish, poultry and liver/ organ meat; (v) eggs; (vi) vitamin A-rich fruit and vegetables (sweet potato, carrots, pumpkin, butternut, spinach, broccoli, apricot, peach, mango); and (vii) other fruits and vegetables.
Just over 70% of breastfed and non-breastfed children aged 6 - 23 months received solid, semi-solid, or soft foods (but also including milk feeds for non-breastfed children) the recommended minimum number of times or more per day (70.7%; 145/205). Forty-four percent of children 6 - 23 months of age received a minimum acceptable diet (apart from breastmilk) (44.4%; 91/205). Eighty-nine percent (182/205) of children 6 - 23 months old received iron in a food or supplement form, with 55.6% (114/205) receiving iron-rich food/s, 42.4% (87/205) receiving a multivitamin containing iron and 53.2% (109/205) receiving baby cereal or foodstuffs manufactured for babies containing iron.
Discussion
In this sub-section of a larger research project, sub-optimal IYCF practices and poor anthropometric profiles were found in mother/ caregiver-child pairs in two vulnerable communities in the Breede Valley, Western Cape Province.
Early initiation of breastfeeding in newborn babies at 75% was lower than the national figure of 88%[15], but corresponds with data derived from a sub-study of the CNSP, where 77% of mothers with babies aged 0 - 6 months reported initiating breastfeeding early. [24] Early initiation of breastfeeding holds many documented benefits[25] and should be a supported practice at various points of contact with pregnant mothers, including in antenatal clinics and maternity wards.[26]
When the very low average EBF rate for SA (~8%) is considered,[15] the reported EBF rate in this study, of more than a third of babies aged younger than 6 months, probably better reflects predominant and partial breastfeeding.[24] Similarly, when the data gathered from the IYCF questionnaire were checked for consistency against data derived from a dietary diversity questionnaire (DDQ), administered to mother/caregiver-child pairs within the broad CNSP baseline study, 35% of babies aged younger than 6 months were recorded as being EBF. However, a more in-depth assessment of breastfeeding practices in the younger age group (0 - 6 months) in the same communities suggests significant over-reporting of EBF with both the DDQ and the WHO indicator.[24] Previous work in SA has shown that the term 'EBF' was not well understood or practised.[27,28] In this study area it is possible that the term was either not well understood or participants reported on what they think should be done rather than their own practices. Furthermore, it is acknowledged that the EBF indicator lacks sensitivity (i.e. it commonly may classify children as EBF who may have received non-breastmilk liquids or foods prior to the survey) and therefore overestimates the proportion of EBF infants.[9] This overestimation of EBF rates by 1-day recall measures has been observed previously.[29-31] In-depth questioning around this specific aspect of infant feeding should therefore be stressed in field research for calculation of this indicator.
Only about a third of babies were reported as still being breastfed at 12 - 15 months of age, falling far short of the WHO recommendation of 'continued breastfeeding up to two years of age and beyond.[32]
One in five babies received bottle feeding from birth and were never breastfed, and almost half of babies aged 0 - 23 months received bottle feeding during the previous 24 hours. Bottle feeding does not provide a safe alternative to breastfeeding in SA, mainly because of poor caregiver knowledge and education, as well as a lack of resources that result in poor hygiene and suboptimal IYCF practices.[33] Furthermore, the development of undernutrition as well as overweight and obesity has also been linked to formula feeding, with practices of dilution and overconcentration/overfeeding, respectively.[34,35]
Infants between 6 and 8 months of age should be receiving solid, semi-solid or soft foods; however, about a third of babies in this study did not receive complementary foods in the preceding 24 hours. Almost half of the children 6 - 23 months of age received a diverse diet of minimum acceptability. The mean dietary diversity score (DDS) for children 6 - 35 months, calculated from the broader CNSP dataset was 4.16, indicating a diet of adequate diversity (Table 3).
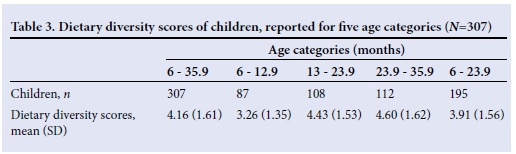
However, in the age group 6 - 12 months the DDS was 3.26, and in the age group 6 - 23 months the DDS was 3.91. Both these values are below a score of 4, indicating insufficient dietary diversity.[36] This corresponds with the low percentage of children aged 6 - 23 months who received foods from four or more food groups, as calculated with the related WHO indicator.
Intake of iron-rich food and/or supplements in the studied communities seems acceptable. These data correspond with SANHANES-1 data, which has attributed this improvement at national level to the SA food fortification programme enacted in 2003.[141 However, the question in the IYCF questionnaire posed to mothers/caregivers in the Breede Valley communities specifically listed the following options for iron-rich food and/or supplements: (i) meat, fish, poultry and liver/organ meats; (ii) baby cereal or other special baby food enriched with iron; (iii) multivitamin syrup (containing iron) or iron drops, and did not include bread and maize meal, which are the staple foods fortified by law in SA.[40] Children in the studied communities seem to have adequate dietary iron intake from the mentioned sources.
In the Breede Valley sub-study, anthropometric indices indicated that maternal overnutrition and child undernutrition, particularly stunting, as well as child overnutrition coexisted. A high prevalence of overweight and obesity of mothers/primary caregivers, coupled with a high mean waist circumference, indicates an increased risk for non-communicable diseases. When the IYCF practices and child anthropometric profile are considered together with the maternal anthropometric profile, it is clear that nutritional practices in the first 1 000 days of life place the future development, growth and health of children in the Breede Valley in serious jeopardy.
Studies conducted in other provinces of SA also indicated the coexistence of stunting and overweight/obesity in children younger than 5 years of age.[35,41,42] Furthermore, the coexistence of overweight and obesity in mothers/caregivers and undernutrition, particularly stunting, in children has also been reported.[43-45] This presents evidence of a worrying double burden of malnutrition in SA communities undergoing a nutrition transition.[16]
The National Department ofHealth's Integrated Nutrition Programme (INP) for SA has focused on furthering the maternal and child nutrition agenda over the past two decades.[28] However, a recent, independently prepared report - Evaluation of Nutrition Interventions for Children from Conception to Age 5 - highlighted the limited progress SA has made in improving child nutrition over the past 20 years.[46]
The report also states that, although the Departments of Health, Social Development (DSD), Agriculture, Forestry and Fisheries (DAFF) as well as the Department of Rural Development and Land Reform (DRDLR) each have sufficient policies, regulations, and strategies to guide their respective portfolios of nutrition interventions, evidence points to unequal commitment to nutrition across departments with varying levels of leadership, management, planning, budgeting, and staffing.[46]
Various recommendations are made in the report to address the current situation, including elevating the status of the INP within the national and provincial government structures with a well-developed nutrition plan that includes nutrition output in a delivery agreement across all sectors. It is also recommended that common indicators should be developed for tracking food and nutrition across all sectors with measurable targets over the short, medium, and long term, as well as a consolidated monitoring and evaluation framework for tracking delivery and the effects of nutrition interventions.[46]
These recommendations support the collection of data relevant to the construction of the WHO IYCF indicators which should be included in community-based research projects, larger-scale population studies in SA, including the Demographic and Health Survey and follow-on SANHANES, as well as the country's District Health Information System (DHIS).[28] It has been proposed in the updated SA IYCF policy (2013) that the following indicators should be calculated from information gathered in surveys and the 14-week data through the DHIS: (i) percentage of mothers initiating breastfeeding within 1 hour of birth; (ii) percentage of babies EBF at 14 weeks; and (iii) percentage of infants 0 - 6 months EBF.[47] The potential to monitor more indicators should be investigated and supported,[28] especially in the light of the recommendations made in the evaluation report.[46]
Study limitations
Although the WHO indicators used to assess IYCF are valid and reliable, the questionnaire used in this study was not validated. This limitation warrants a separate study.
Conclusion
It is of utmost importance to optimise infant nutrition and growth, especially in the first 2 years of life. Although indicators have limitations, they provide a good starting point for decision makers to implement appropriate interventions.[47] IYCF indicators applied in a household survey, among children aged 0 - 23 months, in the Breede Valley indicated sub-optimal IYCF practices. Anthropometric indices indicated that maternal overnutrition and child under- and overnutrition coexist. The combined anthropometric and IYCF practices profile points to poor nutrition during the first 1 000 days of life of infants and young children from these communities.
Valuable experience was gained working with the IYCF indicators at service delivery level. It is recommended that the National and Provincial Nutrition Directorates in collaboration with other government departments strengthen the use of at least some of the core set of WHO IYCF indicators in the DHIS community-based research projects, as well as larger-scale population studies in SA.
Acknowledgements. The project manager, the management team and fieldworkers of the CNSP study, as well as the participants, are gratefully acknowledged for their contributions. Prof. S E Drimie is acknowledged for providing insightful comments on drafts of the paper.
Source of funding. The CNSP project received funding from Stellenbosch University (SU)'s Food Security Initiative (FSI), which forms part of the SU HOPE project. The first author also received funding from the Fund for Innovative Research in Rural Health (FIRRH) and the Stellenbosch University Rural Medical Education Partnerships Initiative (SURMEPI) (supported by the President's Emergency Plan for AIDS relief (PEPFAR) through HRSA under the terms of T84HA21652) both administered by the SU Faculty of Medicine and Health Sciences.
References
1. Bhutta ZA, Ahmed T, Black RE, et al. What works? Interventions for maternal and child undernutrition and survival. Lancet 2008;371:417-440. [http://dx.doi.org/10.1016/S0140-6736(07)61693-6] [ Links ]
2. Dewey KG, Huffman SL. Maternal, infant and young child nutrition: Combining efforts to maximize impacts on child growth and micronutrient status. Food and Nutrition Bulletin 2009;30(2 Suppl):S187-S189. [ Links ]
3. Victora CG, Adair LS, Fall C, et al. and the Maternal and Child Undernutrition Study Group. Maternal and child undernutrition: Consequences for adult health and human capital. Lancet 2008;371:340-357. [http://dx.doi.org/10.1016/S0140-6736(07)61692-4] [ Links ]
4. Victora CG, de Onis M, Hallal PC, et al. Worldwide timing of growth faltering: Revisiting implications for interventions. Pediatrics 2010;125:e473-e480. [http://dx.doi.org/10.1542/peds.2009-1519] [ Links ]
5. Martorell R, Horta BL, Adair LS, et al. Weight gain in the first two years of life is an important predictor of schooling outcomes in pooled analyses from five birth cohorts from low- and middle-income countries. J Nutr 2010;140(2):348-354. [http://dx.doi.org/10.3945/jn.109.112300] [ Links ]
6. Fall CH, Borja JB, Osmond C, et al. COHORTS group. Infant-feeding patterns and cardiovascular risk factors in young adulthood: Data from five cohorts in low- and middle-income countries. Int J Epidemiol 2011;40(1):47-62. [http://dx.doi.org/10.1093/ije/dyq155] [ Links ]
7. Black RE, Victora CG, Walker SP, et al. and the Maternal and Child Nutrition Study Group. Maternal and child undernutrition and overweight in low-income and middle-income countries. Lancet 2013 [http://dx.doi.org/10.1016/S0140-6736(13)60937-X] [ Links ]
8. The United Nations Children's Fund. Programming guide: Infant and young child feeding. UNICEF 'homepage on the Internet!. 2011. http://www.unicef.org/nutrition/files/Fina_IYCF_programmmg_guide_2011.pdf (accessed 28 February 2015). [ Links ]
9. World Health Organization. Indicators for Assessing Infant and Young Child Feeding Practices: Part I. Geneva: World Health Organization, 2008. http://whqlibdoc.who.int/publications/2008/9789241596664_eng.pdf?ua=1 (accessed 28 February 2015). [ Links ]
10. Arimond M, Daelmans B, Dewey K. Indicators for feeding practices in children. Lancet 2008;371(9612):541-542. [http://dx.doi.org/10.1016/S0140-6736(08)60250-0] [ Links ]
11. The United Nations Children's Fund. State of the World's Children 2010 report. New York: UNICEF. 2012. http://www.unicef.org/rightsite/sowc/pdfs/SOWC_Spec%20Ed_CRC_Main%20Repor_.EN_090409.pdf (accessed 28 February 2015). [ Links ]
12. Black RE, Allen LH, Bhutta ZA, et al. Maternal and child undernutrition: Global and regional exposures and health consequences. Lancet 2008;371(9608):246-260. [http://dx.doi.org/10.1016/S0140-6736(07)61690-0] [ Links ]
13. Labadarios D, Swart R, Maunder EMW, et al. Executive summary of the National Food Consumption Survey Fortification Baseline (NFCS-FB-I) South Africa, 2005. S Afr J Clin Nutr 2008;21(3):245-300. [ Links ]
14. Shisana O, Labadarios D, Rehle T, et al. South African National Health and Nutrition Examination Survey (NHANES-1). Cape Town: Human Sciences Research Council Press, 2013. [ Links ]
15. Mhlanga RE. Maternal, newborn and child health: 30 years on. In: Barron P, Roma-Reardon J, eds. South African Health Review. Durban: Health Systems Trust [homepage on the Internet] 2008. http://www.hst.org.za/publications/841 (accessed 8 May 2015). [ Links ]
16. Du Plessis LM, Kruger S, Sweet L. Complementary feeding: critical window of opportunity from 6 months onwards. S Afr J Clin Nutr 2013;26(3):S129-S140. [ Links ]
17. Cogill B. Anthropometric Indicators Measurement Guide. Washington, DC: Food and Nutrition Technical Assistance (FANTA) Project, FHI 360, 2003. http://www.fantaproject.org/sites/default/files/resources/anthropometry-2003-ENG.pdf_(accessed 28 February 2015). [ Links ]
18. World Health Organization. Physical Status: The Use and Interpretation of Anthropometry. Report of a WHO Expert Committee. Technical Report Series No. 854 Geneva: World Health Organization, 1995. http://whqlibdoc.who.int/trs/WHO_TRS_854.pdf?ua=1 (accessed 28 February 2015) [ Links ]
19. StatSoft, Inc. Electronic Statistics Textbook. Tulsa, OK: StatSoft. 2013. 'Online1. Available: http://www.statsoft.com/textbook/_(accessed 28 February 2015). [ Links ]
20. World Health Organization. Anthro for personal computers. Version 3.2.2. Software for assessing growth and development of the world's children. Geneva: World Health Organization, 2011. http://www.who.int/childgrowth/software/en/_(accessed 28 February 2015). [ Links ]
21. De Onis M, Onyango A, Borghi E, Siyam A, Pinol A, eds. WHO Child Growth Standards: Length/height-for-age, weight-for-age, weight-for-length, weight-for-height and body mass index-for-age: Methods and development. 2006. http://www.who.int/childgrowth/standards/Technical_report.pdf (accessed 28 February 2015). [ Links ]
22. World Health Organization. Obesity: Preventing and Managing the Global Epidemic: Report of a WHO Consultation. Technical Report Series No. 894. Geneva: World Health Organization, 1999. http://whqlibdoc.who.int/trs/WHO_TRS_894.pdf_(accessed 28 February 2015). [ Links ]
23. Kruger S. Maternal anthropometry and pregnancy outcomes: A proposal for the monitoring of pregnancy weight gain in outpatient clinics in South Africa. Curationis 2005;28(4):40-49. [http://dx.doi.org/10.4102/curationis.v28i4.1012] [ Links ]
24. Goosen C, McLachlan MH, Schubl C. Infant feeding practices during the first 6 months of life in a low-income area of the Western Cape Province. S Afr J Child Health 2014;8(2):50-54 [http://dx.doi.org/10.7196/sajch.675] [ Links ]
25. World Health Organization Collaborative Study Team on the Role of Breastfeeding on the Prevention of Infant Mortality. Effect of breastfeeding on infant and child mortality due to infectious diseases in less developed countries: A pooled analysis. Lancet 2000;355(9202):451-455. [http://dx.doi.org/10.1016/s0140-6736(99)06260-1] [ Links ]
26. Perez-Escamilla R. Evidence Based Breast-Feeding Promotion: The Baby-Friendly Hospital Initiative. J. Nutr 2007;137:484-487. [ Links ]
27. Doherty T, Chopra M, Nkonki L, et al. Effect of the HIV epidemic on infant feeding in South Africa: 'When they see me coming with the tins they laugh at me'. Bull World Health Organ 2006;84(2):90-96. http://www.who.int/bulletin/volumes/84/2/90.pdf (accessed 28 February 2015). [ Links ]
28. Du Plessis LM, Pereira C. Commitment and capacity for the support for breastfeeding in South Africa. S Afr J Clin Nutr 2013;26(3):S120-S128. [ Links ]
29. Zohoori N, Popkin BM, Fernandez ME. Breastfeeding patterns in the Philippines: A prospective analysis. J Biosoc Sci 1993;25:127-138. [ Links ]
30. Piwoz EG, Creed De Kanashiro H, Lopez De Romana G, et al. Potential for misclassification of infants' usual feeding practices using 24-hour dietary assessment methods. J Nutr 1995;125:57-65. [ Links ]
31. Arimond M, Ruel MT. Progress in Developing an Infant and Child Feeding Index: An Example Using the Ethiopia Demographic and Health Survey 2000. Washington, DC: International Food Policy Research Institute, 2002. [ Links ]
32. World Health Organization. Global strategy for infant and young child feeding. Geneva: World Health Organization, 2003. http://whqlibdoc.who.int/publications/2003/9241562218.pdf. (accessed 28 February 2015). [ Links ]
33. Du Plessis LM. Editorial: Infant and young child feeding in South Africa: Stop the crying beloved country. S Afr J Clin Nutr 2013;26(1):4-5. [ Links ]
34. Arenz A, Ruckerl R, Koletzkos B, von Kries R. Breast-feeding and childhood obesity: a systematic review. International Journal of Obesity 2004;28:1247-1256. [http://dx.doi.org/10.1038/sj.ijo.0802758] [ Links ]
35. Mamabolo RL, Alberts M, Mbenyane GX, et al. Feeding practices and growth of infants from birth to 12 months in the central region of the Limpopo Province of South Africa. Nutrition 2004;20(3):327-333. [http://dx.doi.org/10.1016/j.nut.2003.11.011] [ Links ]
36. Food and Agriculture Organization. Guidelines for Measuring Household and Individual Dietary Diversity. Nutrition and Consumer Protection Division, Food and Agriculture Organization of the United Nations. Rome, Italy. 2010. http://www.fao.org/3/a-i1983e.pdf (accessed: 8 May 2015). [ Links ]
37. Goosen C, McLachlan MH, Schubl C. Factors impeding exclusive breastfeeding in a low-income area of the Western Cape province of South Africa. Africa Journal of Nursing and Midwifery 2014;16(1):13-31. [ Links ]
38. Matthysen M, Lombard MJ, Daniels LC. Factors that influence attitude, beliefs and barriers of caregivers regarding complementary feeding practices of infants aged 6-12 months in the Breede Valley District of the Western Cape. Stellenbosch University Library and Information Services. SUNscholar Research Repository. Dissertation. 2014. http://scholar.sun.ac.za/handle/10019.1/86713 (accessed 28 February 2015). [ Links ]
39. Bhutta ZA, Das JK, Rizvi A, et al. Evidence-based interventions for improvement of maternal and child nutrition: What can be done and at what cost? Lancet 2013;382(9890):452-477. [http://dx.doi.org/10.1016/S0140-6736(13)60996-4] [ Links ]
40. Department of Health. Regulations relating to the fortification of certain foodstuffs. 2003. http://www.doh.gov.za/docs/regulations/2003/Regulations_Fortification.pdf_(accessed 28 February 2015). [ Links ]
41. Mamabolo RL, Steyn NP, Alberts M. Can the high prevalence of micronutrient deficiencies, stunting and overweight in children at ages 1 and 3 years in the Central Region of Limpopo province be explained by diet? S Afr J Clin Nutr 2006;19(3):102-113. [ Links ]
42. Kimani-Murage EW, Kahn K, Pettifor JM, et al. The prevalence of stunting, overweight and obesity, and metabolic disease risk in rural South African children. BMC Public Health 2010;10:158. [http://dx.doi.org/10.1186/1471-2458-10-158] [ Links ]
43. Steyn NP, Labadarios D, Maunder EMW, et al. Secondary anthropometric data analysis of the national food consumption survey in South Africa: The double burden. Nutrition 2005;21:4-13. [http://dx.doi.org/10.1016/j.nut.2004.09.003] [ Links ]
44. Smuts CM, Faber M, Schoeman SE, et al. Socio-demographic profiles and anthropometric status of 0- to 71-month-old children and their caregivers in rural districts of the Eastern Cape and KwaZulu-Natal provinces of South Africa. S Afr J Clin Nutr 2008;21:117-124. [ Links ]
45. Ardington C, Case A. Health: Analysis of the NIDS Wave 1 dataset. NIDS Discussion paper 2. 2009. http://www.nids.uct.ac.za/documents/discussion-papers/93-nids-discussion-paper-no02 (accessed 28 February 2015). [ Links ]
46. Department of Health, Department of Social Development, Department of Performance Monitoring and Evaluation. Evaluation of Nutrition Interventions for Children from Conception to Age 5. Pretoria. 2014. http://www.google.co.za/url?sa=t&rct=j&q=&esrc=s&source=web&cd=1&ved=0CBwQFjAA&url=http%3A%2F%2Fwww.thepresidency-dpme.gov.za%2Fnews%2FDocuments%2FAnnual%2520Report%2520on%2520Evaluations%2520compressed%25202013-14%252014%252010%252022.pdf&ei=Bu3qVJviIoLtaszbgAg&usg=AFQjCNHLfV7Y_hc3wRwDs-jwWuucbVwX7A (accessed 28 February 2015). [ Links ]
47. Department of Health. Infant and Young Child Feeding Policy. Department of Health. 2013. http://www.health-e.org.za/2013/09/20/infant-young-child-feed-policy-2013/#lightbox/0/_(accessed 28 February 2015). [ Links ]
48. Bryce J, Coitinho D, Darnton-Hill I, et al. for the Maternal and Child Undernutrition Study Group. Maternal and child undernutrition: effective action at national level. Lancet 2008;371(9608):510-526. [http://dx.doi.org/10.1016/S0140-6736(07)61694-8] [ Links ]
 Correspondence:
L M du Plessis
lmdup@sun.ac.za

