


Servicios Personalizados
Articulo
 Inglés (pdf)
 Articulo en XML
 Referencias del artículo
Indicadores

Links relacionados
-
 Citado por Google
 -
 Similares en Google
Compartir

 Permalink
South African Journal of Child Health
versión On-line ISSN 1999-7671
versión impresa ISSN 1994-3032
S. Afr. j. child health vol.7 no.3 Pretoria ene. 2013
RESEARCH
The current pattern of gestational age-related anthropometric parameters of term Nigerian neonates
O OluwafemiI ; F NjokanmaII; E DisuII ; T OgunlesiIII
IFWACP, Mother and Child Hospital, Akure, Nigeria
IIFWACP, Lagos State University Teaching Hospital, Ikeja, Lagos, Nigeria
IIIFWACP, Olabisi Onabanjo University Teaching Hospital, Sagamu, Nigeria
ABSTRACT
BACKGROUND: Weight and length at birth reflect the quality of intra-uterine growth and exert a strong influence on postnatal survival.
OBJECTIVE: To determine the current range of anthropometric measurements of term Nigerian neonates.
METHODS: Consecutive term singleton mother-baby pairs were surveyed in the first 24 hours after birth. Weight, length, occipitofrontal circumference (OFC) and ponderal index were determined.
RESULTS: A total of 825 babies (440 males and 385 females) were studied. The overall mean birth weight (± standard deviation (SD)) of the study subjects was 3 233±539 g, the mean ±SD length 49.0±2.5 cm, the mean ±SD OFC 34.6±1.4 cm, and the mean ±SD ponderal index 2.7±0.4 g/cm3.
CONCLUSION: The anthropometric parameters of the Nigerian infants studied were within the range previously reported for Africa and other developing countries, but lower than figures from some developed countries.
Newborn babies are usually classified according to birth weight and/or gestational age, the latter being the strongest determinant of birth weight and postnatal survival.[1,2] Birth weight, occipitofrontal circumference (OFC) and body length of newborn babies are important indicators for evaluating intra-uterine growth.[3] Birth weight may be classified as low (<2 500 g), normal (2 500 - 3 999 g), or high (≥4 000 g).[4,5]
Infants whose birth weights are too low or too high have been shown to have higher mortality and morbidity than those of appropriate weight for gestational age, and to have an increased risk of complications such as peripartum asphyxia and birth trauma.[3,6-10] Body length is also of prognostic significance; an infant who is underweight but of normal length has normal growth potential, but a small infant with short body length is likely to have impaired growth potential because of genetic factors or infectious or other insults in early fetal life.[11,12] A recent study has shown that body length is also a predictor of perinatal mortality, with long infants being at higher risk of perinatal death.[12,13] Infants born with excessively small or large heads may have malformations of the central nervous system secondary to genetic or chromosomal abnormalities, or teratogenic insults with grave prognostic implications.
Unfortunately there is a paucity of data on the anthropometric parameters of newborn infants in most parts of the developing world where perinatal and neonatal mortality have been demonstrated to be high. The current study therefore aimed to determine the pattern of birth weights, lengths, OFCs and ponderal indices (PIs) of term Nigerian babies.
Subjects and methods
This cross-sectional study was conducted in the maternity section of Lagos State University Teaching Hospital (LASUTH), Ikeja, southwestern Nigeria. The average number of deliveries is 4 000 per annum, with term babies accounting for approximately 90%. The facility serves both booked and non-booked women of diverse socioeconomic backgrounds.
Ethical clearance was obtained from the LASUTH Research/Ethics Committee, and written informed consent was obtained from the mothers.
The subjects comprised term singleton infants aged 12 - 24 hours. The age of the babies at the point of enrolment into the study gave time for mothers to recover fully from the effects of anaesthesia and for postoperative pain after caesarean section to decrease, while the babies were still within acceptable age limits for neonatal examination as described by Ballard et al.[14] Babies with gross congenital anomalies were excluded from the study.
The anthropometric parameters studied were birth weight, crown-heel length, OFC and PI. Each baby was weighed using an RGZ-20 scale calibrated in grams to the nearest 25 g. The scale was adjusted for zero error before each reading. Other measures taken to ensure reliability of results included weekly standardisation of the scale, using known weights. Length was measured in centimetres with a metal anthropometric linear rule fixed to a horizontal flat board, using standard procedures.[4] OFC was measured to the nearest cm with a non-stretchable tape, using the glabella and the tip of the occiput as the landmarks.[4] Gestational age was calculated from the first day of the mother's last menstrual period and was corroborated by scores obtained using methods described by Ballard et al.[14] Where the difference between the two techniques was more than 2 weeks, the gestational age obtained using the New Ballard Score was upheld and recorded. The PI was calculated using the formula: weight (g) x 100 ÷ length (cm). A baby whose birth weight was less than the 10th percentile on the international chart (Lubchenco chart)[15] was considered to be small for gestational age (SGA).
Descriptive and inferential statistics were appropriately applied in the course of analysis using Pearson's chi-square test, Student's t-test and analysis of variance (ANOVA). Any p-value <0.05 was considered to be statistically significant (95% confidence level).
Results
There were a total of 1 052 live births at LASUTH between September and December 2009. Of this number, 195 preterm babies, 27 products of multiple gestation, 4 babies with various congenital abnormalities and 1 baby with a fractured femur were excluded from the study, leaving 825 consecutive term singleton babies studied in their first 24 hours of life.
The mean (± standard deviation (SD)) gestational age of the babies was 39.0±1.3 weeks (39.0±1.4 for males and 39.0±1.3 for females). The overall mean ±SD birth weight was 3 233±539 g (range 1 580 - 5 500 g and modal group 3 000 - 3 499 g). There were 56 (6.8%) low-birth-weight babies (<2 500 g) and 73 (8.8%) ofhigh birth weight (≥4 000 g), while 178 (21.6%) weighed between 2 500 g and 2 900 g and 186 (22.5%) between 3 500 g and 3 999 g. The overall mean ±SD length was 49.0±2.5 cm (range 41.0 - 57.0 cm). The corresponding figures for OFC and PI were 34.6±1.4 cm (30.0 - 40.0 cm) and 2.7±0.4 g/cm3 (1.7 - 4.4 g/cm3), respectively.
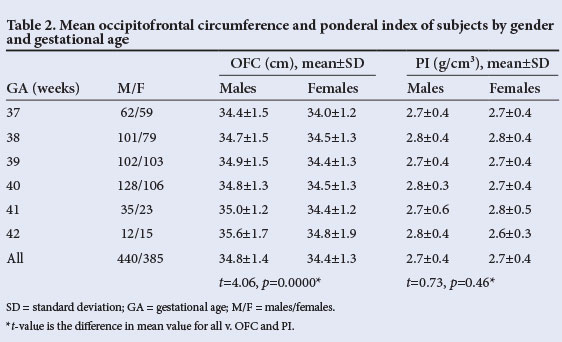
Tables 1 and 2 show the mean birth weight, crown-heel length, OFC and PI of the study subjects according to gender and gestational age. Overall males weighed significantly more than females (p=0.004) and were also longer (p=0.048). At each gestational age, males generally had higher measurements than females. There was, however, no significant difference between males and females with regard to overall mean PI (p=0.46).

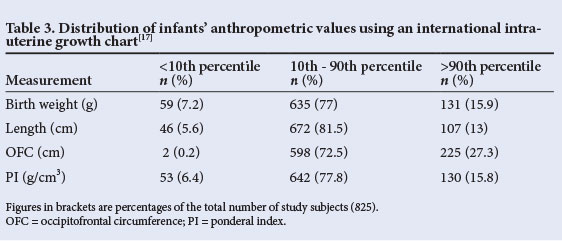
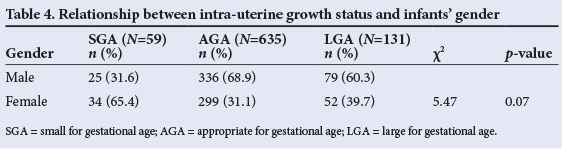
The babies were then classified according to intra-uterine growth. The distribution of birth weight, length, OFC and PI of the 825 study subjects in relation to the study reference chart[15] is shown in Table 3. Less than 10% of subjects had measurements below the 10th percentile for any of the parameters, with the OFC having the best profile, i.e. only 0.2% of the infants having OFCs below the 10th percentile. At the other end, more than 10% of subjects had measurements higher than the 90th percentile. Of the parameters measured, OFC had the best profile (i.e. more infants had an OFC above the 90th percentile than had either length or weight above the 90th percentile). Of the infants, 59 (7.2%) had birth weights below the 10th percentile of the Lubchenco chart[15] and were therefore judged to be SGA. This translated to a prevalence rate of 7.2%. The corresponding figures for AGA (10th - 90th percentile) and large for gestational age (>90th percentile) babies were 635 (77.0%) and 131 (15.9%), respectively. The prevalence of SGA among females was double the figure for males (Table 4). However, the difference was not statistically significant (p=0.07).
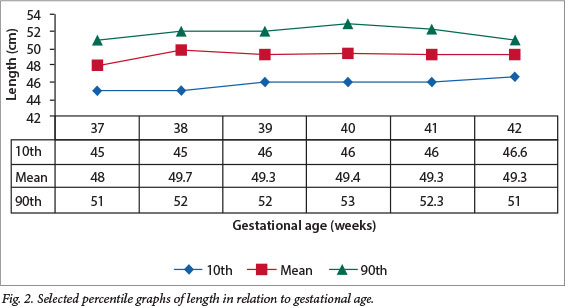
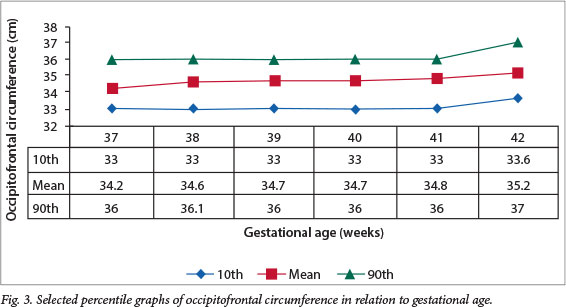
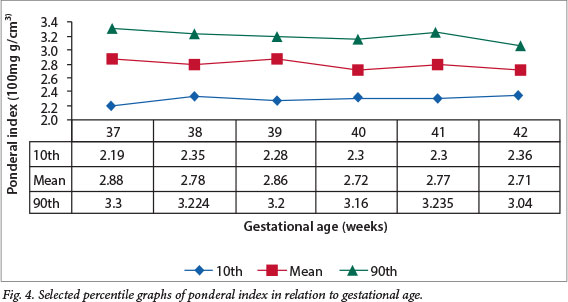
Figs 1 - 4 show the selected percentile graphs (10th, mean, 90th) for birth weight, length, PIs and OFC, respectively, at 37, 38, 39, 40, 41 and 42 weeks' gestation. Mean birth weight increased progressively until 41 weeks' gestation, showing a slight decrease at 42 weeks. Length also increased progressively, but showed a slight drop at 41 weeks before another slight increase at 42 weeks. OFC increased steadily all through the gestational age range, whereas the PI appeared to reach a plateau after 38 weeks.

Discussion
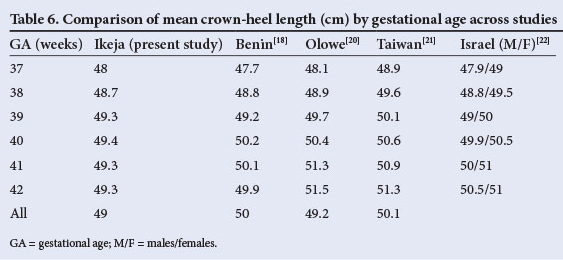
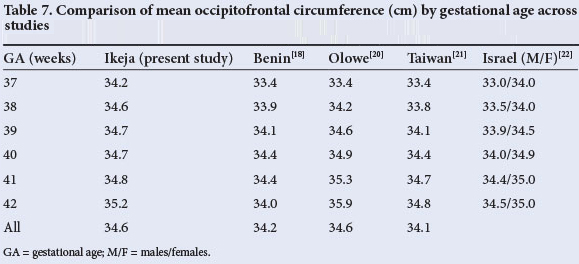
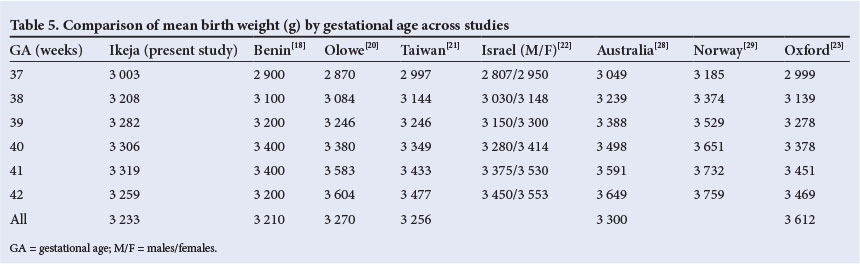
The overall mean birth weight of 3 233 g in the current study falls within the upper range of the spectrum (2 900 g - 3 200 g) reported from earlier Nigerian studies.[16-18] It is, however, lower than the 3 466 g observed in a private hospital,[19] also in Lagos, Nigeria. For comparison, mean birth weights, crown-heel lengths and OFCs from some studies within and outside Nigeria are shown in Tables 5, 6 and 7. In comparison with findings in other Nigerian teaching hospitals, including two earlier reports from Lagos[20] and Benin,[18] mean birth weights in the current study were slightly higher for gestational ages between 37 and 39 weeks but slightly lower at older gestational ages. The same observation applies to the comparison between our findings and those from Taiwan,[21] Israel[22] and Oxford, UK[23] (Table 5). Overall, mean birth weights reported from elsewhere in Africa (ranging from 3 100 g to 3 300 g) are similar to ours.[24,25] In contrast, the mean birth weight in the current study was notably higher than the 2 666 g observed in Pune, India,[26] and the 3 053 g reported for Guatemala.[27] However, our figures are lower than those reported from Australia[28] and Norway.[29]
Birth weight is bound to vary to some extent from one centre to another. However, larger variations are attributable to a number of factors. A privileged socio-economic environment, for example, is known to enhance birth weight and probably explains the lower mean birth weight in the present study than in a private hospital in Lagos.[19] The private hospital caters exclusively for the most affluent members of our society, in contrast to our catchment population, which cuts across a range of socio-economic strata. Socio-economic differences also probably explain the lower birth weight in the current study compared with studies in wealthier countries. Another factor that may explain the differences in mean birth weight is geographical altitude.[30] Lagos is at sea level, and the birth weight profile would be expected to be higher than in places at a much more elevated altitude. This fact may partly explain the higher mean birth weight in the current study than those in Zaria and Ilorin, which are located at 2 500 m and 2 900 m above sea level, respectively.[20] A third possible explanation is racial or genetic differences.[31,32] Taking into account that there were no excessive maternal or gestational risk factors among our subjects, environmental factors alone may not account for the wide differences in birth weight between the infants in the current study and, for example, white infants in the USA.[30]
The mean length of babies in the current study (49.0 cm) is comparable to the 49.1 cm reported from Ilesa, southwestern Nigeria,[33] 49.2 cm and 50 cm from other Nigerian series,[18,20] 48.6 cm in Ethiopia,[25] 49.8 cm in Southampton, UK,[23] and 50.1 cm reported for Chinese newborns.[3] It is, however, much higher than the 47.7 cm reported from Pune in India.[26] As with the observations on birth weight, the babies in the current series were slightly longer than those in the series from Nigeria[18,33] at 37 - 39 weeks, but somewhat shorter at older gestational ages. Overall, the figure in the current study falls within a narrow range of 49 - 51 cm reported in other studies (Table 6).
The mean head circumference of 34.6 cm in the current study is within the range of 33.1 - 35.2 cm in earlier reports[26,34] (Table 7). Comparison with other Nigerian and African studies is desirable, but limited by the fact that the focus in most earlier studies was almost exclusively on birth weight, and measurements of length and OFC were not reported.
The mean PI of 2.7 g/cm3 recorded in the current study is lower than the 3.0 g/cm3 reported from Ghana.[35] The Pune study in India[26] reported a lower figure of 2.4 g/ cm3 in comparison with 2.8 g/cm3 from Southampton, UK.[23] An extensive literature search did not reveal other Nigerian or African studies for comparison. However, our figure lies between the 50th and 75th percentiles of the Denver reference chart,[15] suggesting that the weight/length proportionality of our subjects was within expected limits.
Fifty-nine (7.2%) of the 825 term babies in our study were SGA. The male/female ratio of these babies (0.7:1) is somewhat lower than the range of 0.83:1 - 1:1 found in earlier studies from Nigeria,[36,37] elsewhere in Africa,[1] and the Middle East.[38] The slight preponderance of female SGA babies in our study probably reflects the tendency for males to weigh more than females at birth.[3,16,17,28,29,32,39] It is possible that adverse gestational factors may have more profound effects on the intra-uterine growth of females than males.
In summary, the mean birth weight, length, OFC and PI in our study are within the ranges previously reported for Nigeria and other developing countries, but lower than figures from some developed countries. In addition, the current prevalence of SGA babies at LASUTH (7.2%) is lower than the ≥12% reported elsewhere in Nigeria,[18,33] but much higher than the <5% reported in some developed countries.
References
1. Nyaruhucha CN, Msimbe HP. Some factors affecting birth weights in Morogoro, Tanzania. East Afr Med J 1993;70(12):749-751. [ Links ]
2. Ezeaka VC, Ekure EN, Iroha EO, Egri-Okwaji MTC. Outcome of low birth weight neonates in a tertiary health care centre in Lagos, Nigeria. Afr J Med Med Sci 2004;33(4):299-303. [ Links ]
3. Fox TF, SO HK, Wong E, et al. Updated gestational age specific birth weight, crown-length and head circumference of Chinese newborns. Arch Dis Child Fetal Neonatal Ed 2003;88(3):F229-F236. [http://dx.doi.org/10.1136/fn.88.3.F229] [ Links ]
4. Lawrence EJ. A matter of size: Evaluating the growth restricted neonate. Advanced Neonatal Care 2006;6(6):313-322. http://www.medscape.com/view article/551365 (accessed 4 May 2007). [ Links ]
5. Centers for Disease Control. Pediatric and Pregnancy Nutrition Surveillance System. http://www.cdc.gov/pednss/what_is/pednss_health_indicators.htm (accessed 6 July 2010). [ Links ]
6. Wilcox AJ, Skjaerven R. Birth weight and perinatal mortality: The effect of gestational age. Am J Public Health 1992;82(3):378-382. [http://dx.doi. org/10.2105/AJPH.82.3.378] [ Links ]
7. Wilcox AJ, Russell IT. Birthweight and perinatal mortality. II. On weight-specific mortality. Int J Epidemiol 1983;12(3):319-325. [http://dx.doi. org/10.1093/ije/12.3.319] [ Links ]
8. Susser M, Marolla FA, Fleiss J. Birth weight, fetal age and perinatal mortality. Am J Epidemiol 1972;96(3):197-204. [ Links ]
9. Koops BL, Morgan LJ, Battaglia FC. Neonatal mortality risk in relation to birth weight and gestational age: Update. J Pediatr 1982;101(6):969-977. [ Links ]
10. Williams RL, Creasy RK, Cunningham GC, et al. Fetal growth and perinatal viability in California. Obstet Gynecol 1982;59(5):624-632. [ Links ]
11. Allen MC. Developmental outcome and followup of the small for gestational age infant. Semin Perinatol 1984;8(2):123-156. [ Links ]
12. Commey JO, Fitzhardinge PM. Handicap in the preterm small-for-gestational age infant. J Pediatr 1979;94(5):779-786. [http://dx.doi.org/10.1016/s0022-3476(79)80156-0] [ Links ]
13. Melve KK, Gjessing HK, Skjaerven R, Oyen N. Infants' length at birth: An independent effect on perinatal mortality. Acta Obstet Gynecol Scand 2000;79(6):459-464. [http://dx.doi.org/10.1080/j.1600-0412.2000.079006459.x] [ Links ]
14. Ballard JL, Khoury JC, Wedig K, Wang L, Eilers-Walsman BL, Lipp R. New Ballard score, expanded to include extremely premature infants. J Pediatr 1991;119(3):417-423. [http://dx.doi.org/10.1016/s0022-3476(05)82056-6] [ Links ]
15. Lubchenco LO, Hansman C, Boyd E. Intrauterine growth in length and head circumference as estimated from live births gestational ages from 26 to 42 weeks. Pediatrics 1966;37(3):403-408. [ Links ]
16. Ebomoyi E, Adetoro OO, Wickremasinghe AR. Birth weight and socio-biological factors in Ilorin, Nigeria. J Biosoc Sci 1991;23(4):417-423. [http://dx.doi.org/10.1017/s0021932000019520] [ Links ]
17. Oni GA. The effects of maternal age, education and parity on birth weight in a Nigerian community: The comparison of results from bivariate and multivariate analyses. J Trop Pediatr 1986;32(6):295-300. [ Links ]
18. Sadoh WE, Sadoh AE. Iduoryekemwen NJ. Newborn anthropometry: Effects of socio-demographic factors and maternal anthropometry. Nigerian Journal of Paediatrics 2007;34(3&4):68-78. [ Links ]
19. Okoro T, Njokanma F, Goswami K. The effect of sex, parity and maternal age on birth weights in a specialist hospital setting in Nigeria. J Obstet Gynaecol 2004:24(6);657-661. [http://dx.doi.org/10.1080/01443610400007919] [ Links ]
20. Olowe SA. Standards in intrauterine growth for an African child at sea level. J Pediatr 1981;99(3):489-495. [http://dx.doi.org/10.1016/s0022-3476(81)80358-7] [ Links ]
21. Wang CS, Chou P. Risk factors for low birth weight among first-time mothers in southern Taiwan. J Formos Med Assoc 2001;100(3):168-172. [ Links ]
22. Davidson S, Sokolover N, Erlich A, Litwin A, Linder N, Sirota L. New and improved Israeli reference of birth weight, birth length, and head circumference by gestational age: A hospital-based study. Isr Med Assoc J 2008;10(2):130-134. [ Links ]
23. Yudkin PL, Aboualfa M, Eyre JA, et al. New birthweight and head circumference centiles for gestational ages 24 to 42 weeks. Early Hum Dev 1987;15(1):45-52. [http://dx.doi.org/10.1016/0378-3782(87)90099-5] [ Links ]
24. Dole N, Gleiter K, Savitz DA, Chimbira TH, Mbizuro T. Birthweight patterns in Harare, Zimbabwe. Int J Epidemiol 1990;19(1):98-100. [ Links ]
25. Feleke Y, Enquoselassie F. Maternal age, parity and gestational age on the size of the newborn in Addis Ababa. East Afr Med J 1999;76(8):468-471. [ Links ]
26. Yajnik CS, Fall CHD, Coyaji KJ, et al. Neonatal anthropometry: The thin-fat Indian baby. The Pune Maternal Nutrition Study. Int J Obes Relat Metab Disord 2003;27(2):173-180. [http://dx.doi.org/10.1038/sj.ijo.802219] [ Links ]
27. Schroeder DG, Martorell R. Fatness and body mass index from birth to young adulthood in a rural Guatemalan population. Am J Clin Nutr 1999;70(1):137S-144S. [ Links ]
28. Roberts CL, Lancaster PA. Australian national birthweight percentiles by gestational age. Med J Aust 1999;170(3):114-118. [ Links ]
29. Skjaerven R, Gjessing HK, Bakketeig LS. Birthweight by gestational age in Norway. Acta Obstet Gynecol Scand 2000;79(6):440-449. [http://dx.doi. org/10.1034/j.1600-0412.2000.079006440.x] [ Links ]
30. Galan HL, Rigano S, Radaelli T, et al. Reduction of subcutaneous mass, but not lean mass, in normal fetuses in Denver, Colorado. Am J Obstet Gynecol 2001;185(4):839-844. [http://dx.doi.org/10.1067/mob.2001.117350] [ Links ]
31. Singh KA, Huston-Presley LP, Mencin P, Thomas A, Amini SB, Catalano PM. Birth weight and body composition of neonates born to Caucasian compared with African-American mothers. Obstet Gynecol 2010;115(5):998-1002. [http://dx.doi.org/10.1097/AOG.ob013e3181/da901a] [ Links ]
32. Zhang J, Bowes WA. Birth-weight-for -gestational age patterns by race, sex, and parity in the United States population. Obstet Gynecol 1995;86(2):200-208. [http://dx.doi.org/10.1016/0029-7844(95)00142-E] [ Links ]
33. Adebami OJ, Oyedeji GA, Owa JA, Oyelami OA. Maternal factors in the etiology of fetal malnutrition in Nigeria. Paediatrics International 2007;49(2):150-155. [http://dx.doi.org/10.1111/j.1442-200x.2007.0238x] [ Links ]
34. Lee PA, Chernausek SD, Hokken-Koelega AC, Czernichow P. International Small For Gestational Age Advisory Board Consensus Development Conference Statement: Management of short children born small for gestational age, April 24 - October 1, 2001. Pediatrics 2003;111(6):1253-1261. [http://dx.doi.org/10.1542/peds.111.6.1253] [ Links ]
35. Obed SA, Aniteye P. Birth weight and ponderal index in pre-eclampsia: A comparative study. Ghana Med J 2006;40(1):8-13. [ Links ]
36. Njokanma OF, Sule-Odu AO. Intrauterine growth retardation in Nigerian neonates. Trop J Obstet Gynaecol 1998;15:25-29. [ Links ]
37. Adebami OJ, Owa JA, Oyedeji GA, Oyelami OA. Prevalence and problems of fetal malnutrition in term babies at Wesley Guild Hospital, south-western Nigeria. West Afr J Med 2007;26(4):278-282. [ Links ]
38. Campbell S, Thomas A. Ultrasound measurement of the fetal head to abdominal circumference ratio in the assessment of growth restriction. Br J Obstet Gynaecol 1977;84(3):165-174. [http://dx.doi.org/10.1111/j.1471-0528.1977.tb12550.x] [ Links ]
39. Barbieri MA, Silva AAM, Bettiol H, Gomes UA. Risk factors for the increasing trend in low birth weight among live births born by vaginal delivery, Brazil. Rev Saude Publica 2000;34(6):596-602. [http://dx.doi.org/10.1590/s0034-89102000000600006] [ Links ]
 Correspondence: T Ogunlesi (togunlesi.52@gmail.com)

