


Servicios Personalizados
Articulo
 Inglés (pdf)
 Articulo en XML
 Referencias del artículo
Indicadores

Links relacionados
-
 Citado por Google
 -
 Similares en Google
Compartir

 Permalink
South African Journal of Child Health
versión On-line ISSN 1999-7671
versión impresa ISSN 1994-3032
S. Afr. j. child health vol.7 no.2 Pretoria may. 2013
RESEARCH
A study to evaluate the performance of black South African urban infants on the Bayley Scales of Infant Development III
V RademeyerI; L JacklinII
IBSc (Physio), MMed Child Health (Neurodevelopment). Charlotte Maxeke Academic Hospital and Department of Paediatrics, University of the Witwatersrand, Johannesburg, South Africa
IIMB BCh, FCP (SA) (Paed), MSc Child Health (Neurodevelopment), MMed (Paed). Charlotte Maxeke Academic Hospital and Department of Paediatrics, University of the Witwatersrand, Johannesburg, South Africa
ABSTRACT
BACKGROUND: A suitable tool is needed to assess child development in South Africa (SA). Using Western normed tools presents difficulties.
AIM: To determine whether the Bayley Scales of Infant Development III (Bayley-III) can be used on black African urban infants in SA.
METHOD: One hundred and twenty-two black African infants in Gauteng, SA, were assessed using the Bayley-III.
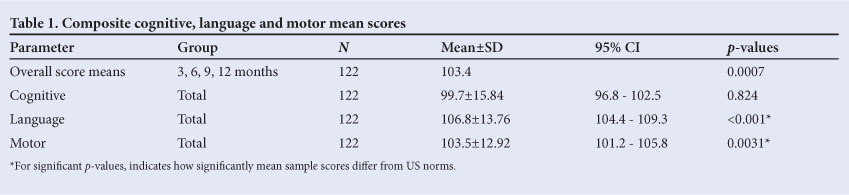
RESULTS: Overall the SA mean score was 103.4, which is statistically significantly higher (p=0.0007) than the mean of 100 for the USA. For subtests, the mean score was 99.7 for the cognitive, 106.8 for the language and 103.5 for the motor subtests as opposed to 100 for the USA.
CONCLUSION: The results of this study showed that SA scores were statistically significantly higher than the US norms. Clinically, however, the difference is small when one considers the variability of development.
RECOMMENDATION: The Bayley-III is a suitable tool for use on the black urban African population in Gauteng, SA.
South Africa (SA) needs a suitable tool to evaluate child development. No standardised tools designed to assess infant development in the SA population are available as yet. Well-known standardised tests designed in First-World countries are often used, but results may be invalid when these are used on populations they were not designed for. The Bayley Scales of Infant Development (Bayley), a tool designed and normed in the USA and considered to be the gold standard in infant assessment,[1] needs to be evaluated for validity in the SA population. The revised and updated 3rd edition was published in 2006, and no studies have been done on its use on populations other than in the USA. The US and SA populations are very different and therefore may perform differently on the test.
Infants may need to be development ally assessed to detect abnormalities and initiate early intervention. There are many forms of developmental assessment, and careful consideration is necessary to determine which type of test is suitable. For most of the population, screening tools are used to detect infants at risk of developmental delay. For high-risk cases, such as premature infants, more detailed assessment over a longer period is necessary, as problems become evident over time. For this purpose, standardised assessment tools are ideal.[2] The present study focused on this type of tool for assessing development. Standardised tests are psychometric tools designed to measure an individual's developmental status and compare it with what would be expected of that individual at their specific age. Individual results are compared with a norm. These tests are structured to be performed in a standard manner with a qualified examiner who administers the test according to a strict protocol. This ensures objectivity and allows the test to be used on large populations by multiple examiners.[2] The process of standardising tools, known as standardisation, involves testing a large number of individuals with the test that was designed for them. They are known as the normative sample. An individual's score can be compared with this standardised score. These scores are age-adjusted and follow a normal distribution, with a prescribed mean and standard deviation (SD). Standardised tests are subject to stringent analysis of their psychometric properties during development. They are assessed for representativeness, reliability and validity. The better a tool's psychometric properties, the more valid, reliable and accurate are the conclusions that can be drawn about a particular child's develop-ment.[2] Examples of standardised tests that can be used to assess child development are the Griffiths Mental Scales, the Bayley, the Ages and Stages Questionnaire, the Batelle Inventory, the Developmental Assessment of Young Children, the Mullen Scales of Early Learning, the Denver Developmental Screening Test and the Miller Function and Participation Scales. All these have different advantages and disadvantages, and choosing the appropriate tool is imperative as it allows for early identification and treatment of problems arising in childhood.[2]
SA is a developing country facing many challenges that have been identified as potentially affecting child development. These include unemployment, poverty and disease, particularly tuberculosis and HIV disease.[3,4] There is therefore a need for assessment (routine screening or detailed assessment as necessary) and suitable tools to ensure that SA children reach their full potential.
Assessing the development of infants is complicated by the normal variations in age at which specific milestones are achieved, as well as the impact of a variety of influences on development.[5,6] A child's development can be affected by individual characteristics such as genetic make-up, personality or gender.[7-9] It can also be influenced by physical and social environmental circumstances,[7] including quality of stimulation, geographical location, poverty, nutrition, infectious diseases such as malaria and HIV, exposure to violence and exposure to contaminated water and toxins.[8] Nutritional deficiencies identified as detrimental risk factors for development include iodine and iron deficiencies and especially growth stunting.[5,8-15]
Standardised tools are time consuming and costly, but they provide objective, valid and reliable information on a child's developmental level in comparison with his or her peers. These tests are based on the population of the country of origin of the test. and may not be appropriate for use on all populations.[6,16-18] Because of the many factors affecting development, different populations may have different rates of development. This is an important consideration when tools are used for populations they were not designed for, as this may invalidate results.[16-18]
The Bayley Scales of Infant Development, 1st edition (Bayley-I) and 2nd edition (Bayley-II), are well-known standardised tools with adequate psychometric properties and have been widely used for research and clinical purposes.[1] They are known as the gold standard of infant assessment[1] and are reliable, valid tools used to assess infants' mental and motor development from 0 to 42 months of age.[19,20] The Bayley-I and Bayley-II, released in 1969 and 1993, respectively, have been followed by the updated Bayley Scales of Infant Development III (Bayley-III).[21] Since previous research showed that SA infants perform better than US infants on the Bayley-I,[6,16] we felt that similar differences in the updated version are likely and that a similar study on the Bayley-III is necessary.
The main aim of this study was to use the Bayley-III to evaluate the performance of a cohort of black urban African infants in SA, to determine whether it is a suitable tool for use on this population. Other objectives were to determine whether gender affects performance on the Bayley-III, and whether height, weight or head circumference have any correlation with infant scores.
Methods
The revised Bayley-III was used to assess the performance of 122 black African infants in several urban clinics in Gauteng, SA. The clinics are located in Yeoville, Bezuidenhout Valley and Johannesburg City Centre and are predominantly attended by black urban Africans. The following groups made up the total of 122:31 infants in the 3-month group (14 female and 17 male), 30 in the 6-month group (14 female and 16 male), 31 in the 9-month group (16 female and 15 male) and 30 in the 12-month group (16 female and 14 male). In total 60 were female and 62 male. Most infants were brought to the clinics by their mothers, a close relative or a caregiver for routine well-baby healthcare, in particular immunisation, and all appeared to be in good health. Ethical clearance was obtained before commencement of the study, and informed consent was obtained from the parents or the adult accompanying the child before assessment of each child. The sample chosen was a convenience sample of children who were available and fulfilled the inclusion criteria.
Inclusion criteria
Participating infants had to be 3, 6, 9 and 12 months old, or within 16 days of that age, and to appear clinically normal. Only black African infants born in SA were assessed. Infants whose parents were from other African countries were included if the infant had been born in SA.
Infants were assessed according to their age and corresponding start points on the Bayley-III. The Bayley-III assessed cognitive, language and motor abilities and took 30 - 60 minutes to adminster. Height, weight and head circumference was also measured and recorded.
SA scores were compared with US norms. Scores were compared across age groups, subtests and genders. Height, weight and head circumference measures were converted into Z-scores and correlated with test scores. The comparison of SA scores and Bayley III norms was done using Student's t-test. Testing was done at the 0.05 level of significance. Infants scoring one or more SDs below or above the norms were considered to be significantly delayed or advanced. One-sample Student's t-tests were done to compare mean cognitive, language and motor composite scores in the study sample with the US norms. One-way analysis of variance (ANOVA) was done to assess mean cognitive/language/motor composite score differences across age groups, and two-way ANOVA to assess cognitive, language and motor composite scores by age group and by gender (gender was included as a variable since, by chance, almost equal numbers of males and females were included in the sample; it was not an objective initially intended to be included in the study).
Anthropometric measures were converted into Z-scores for age. A correlation coefficient (Pearson's product-moment correlation coefficient) was calculated to see whether there were any correlations between the Z-scores and cognitive, language and motor subtest scores. This was done to determine whether anthropometric parameters influenced scores on the Bayley-III. The t-test was used to determine whether the correlation coefficient differed significantly from zero.
Results
Overall US versus SA scores
Mean (±SD) composite scores for the USA were 100±15. The mean composite score for the SA sample was 103.4 (p=0.0007). Overall, the score for the SA sample was therefore statistically significantly higher than those for the USA (Table 1).
SA scores according to subtests
Composite score means for the SA sample (N=122) were 99.7 for cognitive, 106.8 for language and 103.5 for motor (includes fine and gross motor skills) (Table 1).
Differences between age groups
Younger age groups (2 - 7 months) tended to have higher scores than older age groups (6 - 12 months). This is just an overall observation and is not statistically proven.
Differences in subtest scores within age groups
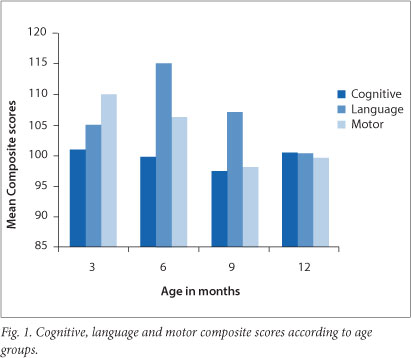
At 3 months. Motor scores were significantly higher than cognitive scores (p=0.007). Motor scores were not significantly different from language scores (p=0.1285). Language scores were not significantly different from cognitive scores (p=0.248).
At 6 months. Language scores were significantly higher than cognitive scores (p<0.001). Motor scores were significantly higher than cognitive scores (p=0.022). Language scores were significantly higher than motor scores (p=0.002).
At 9 months. Language scores were significantly higher than cognitive scores (p<0.001). Motor scores (p<0.001) did not differ significantly from cognitive scores (p=0.776). Language scores were significantly higher than motor scores (p<0.001).
At 12 months. Cognitive, language and motor scores were not significantly different (Fig. 1).
Subtest scores
We will now look at each subtest individually, noting: (i) how the mean scores in the subtest compared with the mean US scores;
(ii) how age groups differed in performance on each subtest; and
(iii) gender differences in scores within age groups.
Subtest scores: Cognitive composite scores
1. For the total sample (N=122), the mean cognitive composite score did not differ significantly (p=0.82) from the US norm of 100 (Table 1).
2. In a one-way analysis of variance (ANOVA), age groups did not differ significantly (p=0.82) with regard to mean cognitive scores (Fig. 1).
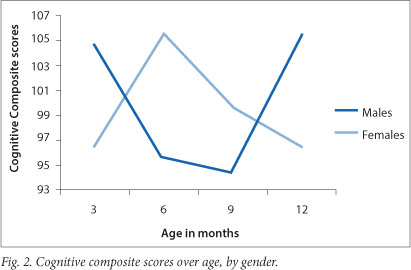
3. Since gender can be expected to play a role, a two-way ANOVA was done with the factors age group and gender. Also included was the interaction term for gender by age group. Again age groups did not differ significantly (p=0.77), and neither did gender categories (p=0.83). However, there was a significant interaction (p=0.05); in particular, boys and girls behaved differently at 3 months, 6 months and 12 months. This interaction was probably the reason why age groups could not be determined as significantly different in the pooled sample. In other words, at 3, 6 and 12 months boys' and girls' scores were so different that they would have affected the mean scores to such an extent as to make them very similar across age groups (Fig. 2).
Subtest scores: Language composite scores
1. For the total sample (N=122), the mean language composite score was significantly higher (p<0.001) than the US norm of 100 (Table 1).
2. Age groups differed significantly (p<0.001) with regard to mean composite language scores in the one-way ANOVA. In particular, scores at 6 months were significantly higher than at 3 months (p=0.014) and 12 months (p<0.001), but only marginally significantly higher than the scores at 9 months (p=0.097) (Fig. 1).
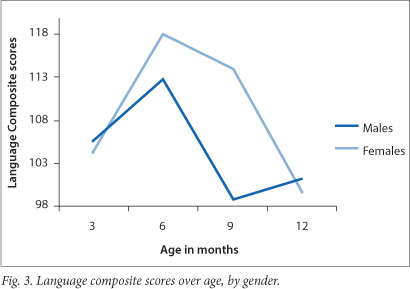
3. Again the groups differed significantly (p<0.001) in the two-way ANOVA, while gender categories were marginally significantly different (p=0.06). For language scores, females therefore had marginally significantly higher scores overall than males. Furthermore, a significant interaction was noted (p=0.029); in particular, boys and girls behaved differently at 9 months. Girls tended to have higher scores than boys at 9 months (Fig. 3).
Subtest scores: Motor composite scores
1. For the total sample (N=122), the mean composite motor score was statistically significantly higher (p=0.003) than the US norm of 100 (Table 1).
2. In a one-way ANOVA, age groups differed significantly (p<0.001) with regard to motor composite scores. In particular, statistically significant differences were found between the 3-month-old group (which had higher scores) and the 9-month-old group (p=0.001), and between the 3-month-old group (higher) and the 12-month-old group (p=0.007). A marginally significant difference was found between the 6-month-old group (higher) and the 9-month-old group (p=0.053) (Fig. 1).
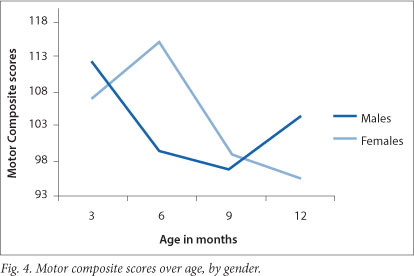
3. Again in a two-way ANOVA age groups differed significantly (p<0.001), but gender categories did not (p=0.69). However, for individual age groups a significant interaction between males and females (p<0.001) existed; in other words they behaved differently. At 6 months females had higher scores than males, while at 12 months males had higher scores than females (Fig. 4).
Height, weight and head circumference
Height, weight and head circumference did not significantly affect infant scores on the Bayley-III.
Discussion
The USA is a developed country, so its population may have an advantage when compared with that of SA, a developing country. Since the two populations differ culturally, geographically, ethnically and socio-economically, their performances on tests can be expected to differ, as these factors are known to influence development. Furthermore, previous studies have found that black African infants scored higher than US infants on the Bayley-I, so much so that the creation of local norms was necessary.[16,17] Richter and Griesel found SA infants' scores to be much higher than US scores on the Bayley-I. This necessitated the creation of local norms for black SA infants to assist with interpretation of Bayley-I results.[16] Aina and Morakinyo found that Nigerian infants scored higher on the Bayley-I than the USA norms.[17] Both studies were done on a different version of the Bayley scales to that used in the present study, so it is difficult to compare the two. The findings of both these studies are replicated in the present study, using the more recent Bayley-III.
Overall US v. SA scores
Overall, when combining all subgroups (cognitive, language and motor), SA scores were significantly higher, with a mean of 103.4 (p=0007) compared with the US mean of 100. These results indicate that typically developing black African urban infants in Gauteng from the study sample, aged between 2 and 13 months, perform better than American infants on the Bayley-III, supporting previous claims of African infant developmental precocity. However, although the SA sample scored significantly higher than the US norms, clinically the difference is small when one considers the variability of development. Developmental milestones can be reached within windows of time, which can vary considerably. Although the study population tends to have average (90 - 109), high average (110 - 119) and superior (120 - 129) scores, especially for the language and motor subtests, these can still be considered normal. Children scoring 1 SD (85) below the mean in more than one subtest or 2 SD (70) below the mean in one subtest will still be considered delayed and require intervention in keeping with Bayley-III recommendations. This applies to both the US and SA groups.
Although we would have expected the US sample to be advantaged and perhaps have higher scores, they did not. The SA and US scores may have differed as a result of differences between characteristics of the two samples. The SA sample consisted of 122 black African infants living in an urban area of SA. The US sample was a stratified sample of 1700 children and included a clinical sample. Mean scores for the US standardisation sample were 100, with an SD of 15.[22] This applied to language, cognitive and motor scores. Of the children's scores, 58% fell within the range 85 - 115, 98% within the range 70 -130, and all within the range 55 - 145.
The US sample included a clinical group (10% of the normative sample), i.e. their normative sample included infants with clinical syndromes or diagnoses. These infants would have scored very low on the Bayley-III, and this would have lowered the mean values for the sample. Our study sample comprised only healthy infants, which may be the reason why the sample mean scores were higher than the US norms. The Bayley-III norms also included infants from 36 weeks' GA, whereas in the present study infants were included from 37 weeks' GA. Another reason for the differences may be variations in developmental rates of the two populations.[22]
SA scores according to subtests
When looking at subgroups, cognitive mean scores (2 - 13 months) for SA did not differ significantly from the US norms. The mean language composite score (2 - 13 months) was 106.8 and the mean motor composite score (2 - 13 months) was 103.5. These were statistically significantly higher than the US norm of 100 (Table 1), especially from 2 to 10 months. These differences may be due to differences between the US sample and the study sample; however, this does not explain why cognitive scores were not affected, as infants with syndromes would be expected to have lower cognitive scores as well as lower language and motor scores, as language and cognition are closely related. Developmental theories describe the need for a combination of brain maturation and environmental shaping.[23] It may be that in the study sample, caregivers encourage language and motor abilities more than cognitive abilities in the early months. Regional differences in brain growth may also explain differences in performance of the subtests, as may different rates of development across populations.
Differences between age groups
In the present study, the trend was for younger age groups (2 - 7 months) to achieve higher scores than older age groups (7 - 13 months). Aina and Morakinyo found the lower age groups (2, 4 and 8 months) to have the highest scores overall. Scores for the older age groups (10 - 30 months) tended to be slightly lower.[17] It is possible that younger age groups are not expected to do as much as older age groups. Their scores would therefore appear better if the test was not sensitive enough in the younger age groups, or if developmental delay is less obvious early on when less is expected of a child.
Differences in subtest scores within age groups
When comparing scores within age groups, only the 12-month-old age group had similar subtest mean scores (Fig. 1). All the other age groups had large differences in scores, with language or motor scores being higher than other scores. This may be due to variations in rates of cognitive, language and motor development in children aged under 12 months, who then reach a point at 12 months where they are equally competent in all areas. This implies that timing and order of milestone achievement may not be as important as that certain milestones should be achieved within a specified time period. Again, the test may not be sensitive enough for testing motor or language skills from ages 2 - 7 months, or perhaps the study sample develop their language and motor skills earlier than the US sample.
When comparing across the age groups, at 3 months motor scores were the highest scoring subtest. This could mean that in our population motor development is more rapid in the first 3 months, or that the test is not sensitive enough to detect motor development at this age. At 6 months language was the highest scoring subtest.
Language skills may be particularly well developed at this age as a result of factors affecting development such as culture and caregiving practices. At 9 months language was the highest scoring subtest. Again language skills may be advanced in this population at this time. At 12 months subtest scores were similar. This may indicate that although motor and language development in the study sample are faster in the early months, by 12 months they have slowed to reach levels similar to those of the US sample. Cognitive scores, however, appear to develop at a steadier rate than language or motor scores. The differences between the age groups may therefore be due to a lack of sensitivity in the test, or the sample population having varying rates of development in the early months.
Subtest scores: Cognitive composite scores
1. The present study only assessed children up to 12 months, but cognitive skill scores were not higher than the norms. In Richter and Griesels study, infants' mental index scores (the equivalent of cognitive and language composite scores combined) were higher than US norms from 3 to 15 months and not from 18 to 30 months.[16] Aina and Morakinyo's study scores were higher than US norms for ages 2 - 10 months and not for 12 - 30 months.[17]
The above discrepancies may be because cognitive scores are a separate score in the Bayley-III, i.e. there are 3 scores: cognitive, language and motor, whereas in the Bayley-I and Bayley-II language is included in the mental index score. Language skills may therefore form the basis of the increased mental index scores in the latter two studies. Language scores may be higher because infants under 12 months have less language development and again the test may not be sensitive enough to assess language skills adequately from 0 to 12 months, or these infants may have advanced language skills at this age.
2. Since age groups did not differ with regard to mean cognitive scores, the Bayley-III can be used for urban SA black infants in Gauteng at 3, 6, 9 or 12 months. However, the lack of differences between groups may have been due to the large differences between male and female scores, which can be seen in each age group (Fig. 2). This lack of differences between groups should therefore be interpreted with caution. If such large differences between males and females had not existed, the age groups may have differed significantly. In the Bayley-III norms production, although equal numbers of males and females were included, they were not assessed for differences, so we do not know whether similar differences existed between males and females in the Bayley-III norms sample. Testing of older children may reveal larger differences in cognitive development. Further, since developmental theories suggest that brain maturation and environmental shaping are necessary for development, cognitive development may differ more in older children, who have had more time to absorb the impact of environmental influences. Children aged under 12 months may simply be developing according to their innate brain maturation, and environmental influences may be less important.
3. When male scores were compared with female scores it was noted that overall no significant differences existed in cognitive scores, but that at 3, 6 and 12 months there were large differences in the way males and females behaved. Fig. 2 shows that females have higher scores at 6 months, while males have higher scores at 3 and 12 months. A previous study found that girls performed better than boys on the mental scales (cognitive composite scores) of the Bayley-I.[13] This contradicts the results of the present study; however, again mental scales included language in the Bayley-I and II, but were separate in the Bayley-III. It may therefore have been the girls' language performance that pushed their mental scale scores above those of the boys. Further, the sample size in each subgroup in the present study is small. Larger numbers need to be assessed to increase the statistical power of these results, and further research is necessary. Despite these inconsistencies in results, it is clear that gender differences in development may exist. By 18 or 24 months males and females may have achieved the same milestones but at different rates. It may not be as important when a milestone is achieved as that it simply is achieved within a specified time period.
Subtest scores: Language composite scores
1. The SA study sample achieved higher language scores than the US norms between 2 and 10 months, implying that SA infants have advanced language skills at this age. Alternatively, the assessment may not be sensitive enough to assess language between 2 and 10 months. These results are similar to those of Richter et al., who found that infants' mental index scores (which include language) were significantly higher in SA children from 2 to 10 months, and not from 18 to 30 months.[6] In Richter et al.'s study it may have been above-average language skills that elevated their mental index scores. If this was so, the cognitive part of the mental index scores may have been in the average range, as it was in the present study sample. Mental index scores of infants in Aina and Morakinyo's study were higher than US norms from 2 to 10 months and not from 12 to 30 months.[17] Again this may have been due to the Nigerian children's language skills. The above two studies had similar results to the present study. The reason may be that different populations have different rates of development in the earlier months.
2. Age groups differed significantly, infants at 6 and 9 months having the highest language scores. SA infants' language scores can therefore be expected to be above average in the first 2 - 10 months of life.
3. For language scores, we found a marginally statistically significant difference between male and female scores overall, with females having higher scores than males. This was particularly evident at 6 months and at 9 months. However, at 12 months girls were found to perform much the same as boys on language scales. Overall girls perform better than boys on the language subtest, which may reflect different rates of development in language skills between boys and girls in the first year. However, again the sample size being compared in each subgroup is small. Larger numbers need to be assessed to increase the statistical power of these results. Anatomical differences in the brain, genetic and hormonal differences and the role of the X chromosome have been proposed to explain gender differences in language and cognition.[24,25] Girls are at a slight advantage compared with boys when it comes to early language acquisition, but these differences disappear as children get older.[25]
Subtest scores: Motor composite scores
1. SA infants achieved significantly higher mean motor scores than the US norms. This is similar to Richter and Griesel's finding that infants aged 2 - 10 months scored significantly higher than the US norms.[16] In the present study it was found that scores were significantly higher than the US norms between 2 and 7 months. However, infants in the present study achieved slightly lower motor scores than the US norms at 9 months. Motor scores for the infants in Aina and Morakinyo's study were higher than US norms at all ages except 10 and 30 months.[17] This differs from the present study, where motor scores were higher at all ages except 9 and 12 months. It must be remembered that the abovementioned studies were done using the Bayley-I, while the present study used the Bayley-III. These tests are different, so care must be taken when comparing them. However, the above findings are similar to those of the present study. To conclude, motor scores in all three studies were higher than the US norms. They therefore support the theory of precocity of motor development in black infants. Development follows a sequence, but the timing of this sequence can be influenced by ethnic or cultural factors. Black African babies are said to be more advanced than US and European babies in sitting, walking and running. For example, Ugandan babies walk at an average of 10 months, US babies at 12 months and French babies at 15 months. Some cultures encourage early development and others do not.[23]
2. Of all the age groups, the 3-month-old group had the highest scores for motor development (Fig. 1). This correlates with Aina and Morakinyo's[17] and Richter et al'.s[6] studies, both of which found that the younger age groups did better than the older groups. Richter et al. found that SA infants did better on the motor scale from 2 to 10 months, and that thereafter until 30 months the scores were very similar to the US norms.[6] Aina and Morakinyo found that their Nigerian subjects scored above the norms, particularly in the lower age groups from 2 to 8 months.[17] The fact that motor scores were high at 3 months may be due to a lack of sensitivity of the test at the younger ages or to differences in rates of development across populations, with SA urban black infants having advanced motor skills.
3. At 12 months males had significantly higher scores than females, while at 6 months females had significantly higher scores than males. This may be due to different rates of development in males and females. However, it must be noted again that the sample size being compared in each subgroup is small in number. Larger numbers need to be assessed to increase the statistical power of these results. In contrast, Richter et al. found no significant differences between male and female scores on the mental and motor scales of the Bayley-I. In their formulation of norms they therefore did not create separate norms for males and females.[6] In their study of the Bayley-I, Lima et al. found no effect of infant gender on motor scores.[13] As yet there are no studies comparing male and female performance on the Bayley-III.
The above results show that in our sample differences on the Bayley-III exist in subtest scores, between age groups, and in gender performance. Language and motor scores were the most different from the US norms and could reflect different rates of development. Anthropometric indicators such as height, weight and head circumference had no significant association with scores on the test, indicating that growth had no effect on development in this population. This may be because the sample was a healthy one, and stronger correlations may be found in samples where children are stunted or underweight.
Conclusion
Black African infants in the present study sample performed better on the Bayley-III than US norms. Although statistically the SA sample scored significantly higher than the US norms, clinically the difference is small when one considers the variability of development. The Bayley-III is therefore a valid test to use on black urban infants aged 2 - 13 months in Gauteng, SA. Further research on the Bayley-III is needed to assess a larger, more diverse group (e.g. a stratified sample), including all age groups for which the Bayley-III caters (0 - 42 months), as well as all population groups in SA. Gender differences in scores for specific subtests were found, but were small and require further research. Height, weight and head circumference had no effect on Bayley-III scores in the study sample.
Acknowledgement. Professor P Becker (statistician).
References
1. Harris SR, Megens AM, Backman CL, Hayes VE. Stability of the Bayley II Scales of Infant Development in a sample of low-riHsk and high-risk infants. Dev Med Child Neurol 2005;47(12):820-823. [http://dx.doi.org/10.1017%2 FS0012162205001738] [ Links ]
2. Johnson S, Marlow N. Developmental screen or developmental testing? Early Hum Dev 2006;82(3):173-183. [http://dx.doi.org/10.1016%2Fj.earlhumdev.2006.01.008] [ Links ]
3. Saloojee H, Pettifor JM. International child health: 10 years of democracy in South Africa, the challenges facing children today. Current Paediatrics 2005;15(5):429-436. [http://dx.doi.org/10.1016%2Fj.cupe.2005.06.012] [ Links ]
4. Chopra M, Lawn JE, Sanders D, et al. Achieving the health Millennium Development Goals for South Africa: Challenges and priorities. Lancet 2009;374(9694):1023-1031. [http://dx.doi.org/10.1016%2FS0140-6736%2809%2961122-3] [ Links ]
5. Pivik RT, Dykman RA, Jing H, Gilchrist JM, Badger TM. The influence of infant diet on early developmental changes in processing human voice speech stimuli: ERP variations in breast and milk formula-fed infants at 3 and 6 months after birth. Dev Neuropsychol 2007;31(3):279-335. [http://dx.doi.org/10.1080%2F87565640701228880] [ Links ]
6. Richter LM, Griesel RD, Rose C. The Bayley Scales of Infant Development - a South African standardization. South African Journal of Occupational Therapy 1992;May:14-25. [ Links ]
7. WHO Multicentre Growth Reference Study Group. Assessment of sex differences and heterogeneity in motor milestone attainment among populations in the WHO Multicentre Growth Reference Study. Acta Paediatr Suppl 2006;95,suppl 450:66-75. [http://dx.doi.org/10.1111/j.1651-2227.2006.tb02377.x] [ Links ]
8. Grantham-McGregor S, Cheung YB, Cueto S, et al., and the International Child Development Steering Group. Child development in developing countries 1. Developmental potential in the first 5 years for children in developing countries. Lancet 2007;369(9555):60-70. [http://dx.doi.org/10.1016%2FS0140-6736%2807%2960032-4] [ Links ]
9. Walker SP, Wachs TD, Meeks Gardner J, et al., and the International Child Development Steering Group. Child development in developing countries 2. Child development: Risk factors for adverse outcomes in developing countries. Lancet 2007;369(9556):145-157. [http://dx.doi.org/10.1016%2FS0140-6736%2807%2960076-2] [ Links ]
10. Gale CR, O'Callaghan FJ, Godfrey KM, Law CM, Martyn CN. Critical periods of brain growth and cognitive function in children. Brain 2004;127(2):321-329. [http://dx.doi.org/10.1093%2Fbrain%2Fawh034] [ Links ]
11. Ivanovic DM, Leiva BP, Perez HT, et al. Head size and intelligence, learning, nutritional status and brain development. Neuropsychologia 2004;42(8):1118-1131. [http://dx.doi.org/10.1016/j.neuropsychologia.2003.11.022] [ Links ]
12. Kuklina EV, Ramakrishnan U, Stein AD, Barnhart HH, Martorell R. Growth and diet quality are associated with the attainment of walking in rural Guatemalan infants. J Nutr 2004;134(12):3296-3300. [ Links ]
13. Lima MC, Eickmann SH, Lima ACV, et al. Determinants of mental and motor development at 12 months in a low income population: A cohort study in northeast Brazil. Acta Paediatr 2004;93(7):969-975. [http://dx.doi.org/10.1111%2Fj.1651-2227.2004.tb18257.x] [ Links ]
14. Sacker A, Quigley MA, Kelly YJ. Breastfeeding and developmental delay: Findings from the Millennium Cohort Study. Pediatrics 2006;118(3):e628-e689. [http://dx.doi.org/10.1542%2Fpeds.2005-3141] [ Links ]
15. WHO Multicentre Growth Reference Study Group. Relationship between physical growth and motor development in the WHO Child Growth Standards. Acta Paediatr 2006;95,suppl 450:96-101. [http://dx.doi.org/10.1111%2Fj.1651-2227.2006.tb02380.x] [ Links ]
16. Richter LM, Griesel RD. Bayley Scales of Infant Development - norms for interpreting the performance of black South African infants. Pretoria: University of South Africa, 1988. [ Links ]
17. Aina OF, Morakinyo O. Normative data on mental and motor development in Nigerian children. West Afr J Med 2005;24(2):151-156. [http://dx.doi.org/10.4314%2Fwajm.v24i2.28187] [ Links ]
18. Westera JJ, Houtzager BA, Overdiek B, van Wassenaer AG. Applying Dutch and US versions of the BSID-II in Dutch children born preterm leads to different outcomes. Dev Med Child Neurol 2008;50(6):445-449. [http://dx.doi.org/10.1111%2Fj.1469-8749.2008.02067.x] [ Links ]
19. Gauthier SM, Bauer CR, Messinger DS, Closius J. The Bayley Scales of Infant Development II: Where to start? Developmental and Behavioural Pediatrics 1999;20(2):75-79. [http://dx.doi.org/10.1097%2F00004703-199904000-00001] [ Links ]
20. Campos D, Santos D, Goncalves V, et al. Agreement between scales for screening and diagnosis of motor development at 6 months. J Pediatr (Rio J) 2006;82(6):470-474. [http://dx.doi.org/10.2223%2FJPED.1567] [ Links ]
21. Harcourt Assessment 2007. Bayley-III Technical Report 2. Factors contributing to differences between Bayley-III and BSID-II scores. http://www.pearsonassessments.com/NR/rdonlyres/85553691-1039-4964-8C1C-6F1E9506BE31/0/BayleyIII_TechReport2.pdf (accessed 5 May 2013). [ Links ]
22. Bayley N. Technical Manual for the Bayley Scales of Infant Development. 3rd ed. San Antonio, TX: Psychological Corporation, 2006. [ Links ]
23. Papalia D, Feldman R, Olds S. A Child's World: Infancy through Adolescence. 11th ed. New York: McGraw-Hill, 2009:145-206. [ Links ]
24. Galsworthy MJ, Dionne G, Dale PS, Plomin R. Sex differences in early verbal and non-verbal cognitive development. Dev Sci 2000;3(2):206-215. [http://dx.doi.org/10.1111%2F1467-7687.00114] [ Links ]
25. Wallentin M. Putative sex differences in verbal abilities and language cortex: A critical review. Brain Lang 2009;108(3):175-183. [http://dx.doi.org/10.1016/j.bandl.2008.07.001] [ Links ]
 Corresponding author: V Rademeyer (rademeyerv@gmail.com)

