


Services on Demand
Article
 English (pdf)
 Article in xml format
 Article references
Indicators

Related links
-
 Cited by Google
 -
 Similars in Google
Share

 Permalink
Jàmbá: Journal of Disaster Risk Studies
On-line version ISSN 1996-1421
Print version ISSN 2072-845X
Jàmbá vol.13 n.1 Cape Town 2021
http://dx.doi.org/10.4102/jamba.v13i1.860
ORIGINAL RESEARCH
Tool development to measure the resilience of water supply systems in Tanzania: Economic dimension
Lukuba N. SweyaI; Suzanne WilkinsonII
IDepartment of Civil and Environmental Engineering, Faculty of Engineering, The University of Auckland, Auckland, New Zealand
IISchool of Built Environment, Massey University, Albany Campus, Auckland, New Zealand
ABSTRACT
The world has experienced devastating disasters causing severe human life and economic losses, which is estimated to be 68.5% of the global economic losses between 2005 and 2017. Natural disasters are of great concern - they caused total damage of approximately $3.5 trillion during the past century - which is more than the global infrastructure development investment in 2014. Floods - exacerbated by climate change - are expected to cause more damages, and water supply infrastructures will continue to suffer if resilience is not improved. Measuring the economic changes affecting resilience would assist in developing risk reduction initiatives to minimise disaster losses. Such a measure is lacking for Tanzania water supply systems (WSSs). The current article applied three-stage processes - literature review, pre-assessment and Delphi technique - to develop a resilience tool to measure economic resilience for urban WSSs in Tanzania. Thematic and standard descriptive analyses were carried out during the study. Dynamism principle and three indicators - system investment proportionality, public-private partnership and cost recovery - emerged as principal components for the tool. The tool is expected to be useful during water authorities' planning processes and budgeting in order to improve the overall WSSs resilience.
Keywords: resilience; floods; water supply systems; Delphi techniques; economic dimension.
Introduction
Human civilisation has become a superorganism, changing the environment from which it evolved inducing new hazards with no analogue - with increasing complexity and interaction of human, economic and political systems within ecological systems, the risk becomes increasingly systemic (UNDRR 2019). The civilisation's contribution to the already changing environment is expected to yield more frightening impacts on the economy and human lives if no serious interventions are taken. The ability to exacerbate the impacts of environmental-related disasters is particularly a concern - from the 1960s, to date, there have been an exponential increase in natural disasters' frequency, magnitude and impacts in terms of human life and economic losses (EM-DAT 2019). Globally, there are already significant losses - approximately $3.5 trillion - caused by natural disasters since 1900 (EM-DAT 2019), which is estimated to be more than the global infrastructure development investment in 2014 - approximately $3.4 tn (Bhattacharya et al. 2016). US$5.2 billion and approximately $136.8bn were spent on disasters risk reduction and response between 2005 and 2017 (UNDRR 2019). About 68.5% of all global economic losses from 2005 to 2017 were attributed to extensive risk events and heavily absorbed by the low-income households and communities, particularly in the low- and middle-income countries in Asia, Pacific and Africa (UNDRR 2019). Also, disasters' reporting data are imperfect - particularly in developing countries - thus, disaster losses remain significantly unreported compromising accurate calculations of impacts and affecting the preparedness and mitigation plans for future events (UNDRR 2019).
In the case of Tanzania, only 5.7% of the internationally reported disasters had information, which represented the total damage for the past century (EM-DAT 2019). The country was the first in the top 10 countries for disaster damages in 2016 in terms of the percentage Gross Domestic Product (Guha-Sapir et al. 2017). Also, the country loses approximately $2bn annually because of flooding hazard - two times the state budget for the ministry of health, education, home affairs and environment combined for the financial year 2017-2018 (https://www.dailynews.co.tz/news/floods-cost-tanzania-us-2billion-annually.aspx). During the disasters, infrastructures are not immune; the risk of coastal flooding is projected to have more significant damage than that of riverine floods, and thus, damages to infrastructure and assets are increasing (UNDRR 2019), needing investment in resilience building to
-
avoid losses when disasters strike,
-
stimulate economic activities from reduced risks, and
-
develop co-benefit or uses of a specific disaster risk management investment (UNDP 2019).
Water supply systems (WSSs) encompass catchments/water sources, water treatment facilities, distribution networks, raw water and clean water transmission pipes, electronic facilities and cyber systems (Van Leuven 2011). The Tanzania urban WSSs encompass 26 Regional Water Supply and Sanitation Authorities (R-WSSAs) and eight National Project Water Supply and Sanitation Authorities (NP-WSSAs) in the Mainland-Tanzania. These authorities are the principle water service providers, contributing to an average of 74.2% and 55%, respectively, of the population in their regions (URT 2018). National Project Water Supply and Sanitation Authorities, such as Kahama Shinyanga Water Supply and Sewerage Authority (KASHUWASA), are also bulk water suppliers to other WSSAs. Others are privately owned infrastructures, community-based organisation facilities, individual boreholes and direct fetching of water from streams, rivers, lakes and locally dug wells. The WSSAs are the lawful organisations providing public water services in the urban areas (Water Supply and Sanitation Act 2019). Such organisations - in collaboration with the Ministry of Water - are responsible for developing and implementing mitigation measures to minimise disaster impacts on WSSs (Disaster Management Act 2015). The WSSAs' main source of income is through billing; however, the majority operate under license III - still get financial, managerial and technical support from the government and partially cover their operational costs (URT 2020) - thus, are unable to collect enough funds that can enhance contingency planning to prepare for disaster impacts.
The possibility to measure the economic changes triggered by disasters is a crucial step towards disaster risk reduction (Renschler et al. 2010). The economic dimension includes economic factors driving the restoration process of urban infrastructures and recovery processes - before, during and after natural disasters - needing to be determined to select optimal resources allocation and preparedness measures right after an extreme event (Martinelli et al. 2014). Researchers have shown the importance of economic factors and their measurements for the performance of infrastructures worldwide (Balaei et al. 2018; Bhattacharya et al. 2016; Bruneau et al. 2003; De Bruijn et al. 2017; Vugrin et al. 2010) during disasters. However, the current global resilience gap is lacking the universal measurement tool for all systems, more so for economic patterns and their consequences differing in various systems. As such, there is a quest for localised approaches that would precisely measure the economic factors enhancing the resilience of WSSs - which has not been performed for Tanzania. Therefore, the current study applied Delphi techniques to develop a resilience tool to floods encompassing economic components that are useful in the urban WSSAs' planning processes and budgeting in order to improve the resilience.
Economic resilience
Resilience is a multidimensional concept that is being applied in various fields, such as ecology, social sciences, engineering and economics, to describe how the systems are better prepared to withstand, respond, recover and adapt to disaster impacts. Originally, according to Holling (1973), several studies have tried to define the concept without consensus on a universal definition (Vugrin et al. 2010). Some researchers develop generalised definitions, whereas others develop context-specific definitions focusing on specific dimensions, such as social dimension, economic dimension and organisational dimension. In all cases, the resilience concept is defined based on some or all four phases of disaster management - mitigation, preparedness, response and recovery. A meta-definition of resilience is given by Stevenson et al. (2015):
[T]he ability to absorb the effects of a disruptive event, minimize adverse impacts, respond effectively post-event, maintain or recover functionality, and adapt in a way that allows for learning and thriving, while mitigating the adverse impacts of future events. (p. 7)
The definition was developed by drawing together common attributes from 120 literature-based definitions. This definition provides a good platform for understanding the general concept of resilience, as applied in the current study.
Economic resilience is a more complex concept because the long-term investment in rehabilitation is complicated and unique post-disaster task (Bastaminia, Rezaei & Dastoorpoor 2017). The review of few definitions shows some discrepancies on how economic resilience is defined:
-
The analysis of economic success with respect to the processes involved in disaster management (Christopherson, Michie & Tyler 2010),
-
The capacity of an institution or a system to maintain its functions during crises (Rose 2004),
-
Reconfiguration of economy, adaptability and infrastructure, and sustain acceptable growth in production, employment and welfare in the long term (Martin 2011),
-
The ability of an economy or a local community to absorb and adapt to the negative effects of economic shock and move towards pre-disaster equilibrium or stability (Bastaminia et al. 2017) and
-
The inherent ability and adaptive response that enables individual business firms and entire regions to avoid maximum potential loss (Rose & Liao 2005).
To suit the current study, common attributes apply encompassing factors affecting the functionality and recovery process aftermath, and determining options for households, communities, firms, water supply authorities at the time of flooding and potentially related disasters.
Likewise, measuring resilience is complex as there is no universal approach (Willis & Loa 2015) - various methodologies have been developed to operationalise and reduce concept's ambiguity (Sharifi 2016). As such, studies have examined economic resilience empirically or with the use of simulation studies (Cutter 2016; Rose & Krausmann 2013) undergoing evolutions from Tierney (1997) to Rose and Liao (2005) who applied a computable general equilibrium (CGE). Also, using evidence-based such as the Federal Emergency Management Agency (FEMA's) estimation tool, and survey (Kajitani & Tatano 2009). Other studies have treated economic aspects as a dimension/component to community resilience (Cimellaro et al. 2016; Mayunga 2007) and infrastructure resilience (Balaei et al. 2018; Bruneau et al. 2003; Vugrin et al. 2010) where several indicators apply to examine the resilience.
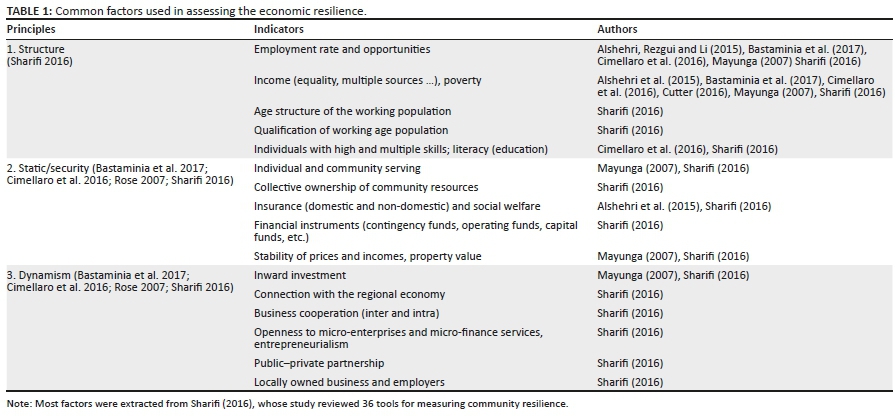
In all cases, Rose (2007) indicated that economic resilience is divided into static resilience and dynamic resilience - the former refers to the efficient use of resources at a particular point and time, whilst the latter implies to the repair and reconstruction affecting the time path of the economy. In each case, resilience emanates from both internal motivation (internal resilience) and the stimulation of private or public policy decisions (adaptive resilience). Moreover, economic resilience takes place at three levels - individual household or firm (microeconomic level), sectors (mesoeconomic level) and general economy (macroeconomic level) (Rose 2007, 2017; Rose & Krausmann 2013). Besides, the dominant economic factors include the economic structure, efficient use of resources to prepare and mitigate disasters, and repair and reconstruction aftermath (Rose 2007, 2016; Sharifi 2016). The current study evaluates economic factors at the society and water organisation levels, thereby analysing their internal economic capacity and the interaction with external stakeholders. As such, the resilience for Tanzania urban WSSs to flood hazards relate directly to micro-economy and mesoeconomy, with common factors that could affect the economic resilience presented in Table 1. Such factors were fundamental during the development of the current tool.
Methodology
The current study was conducted to identify potential elements of the tool that can be applied to assess the economic resilience against floods for Tanzania urban WSSs. The tool refers to a framework of potential principles and indicators suitable for measuring the economic resilience for the country's WSSs. The development of the tool relied on an initial review of the literature, a pre-assessment exercise, and a three-round Delphi process. The experts took part voluntarily based on their understanding of the objectives of this research.
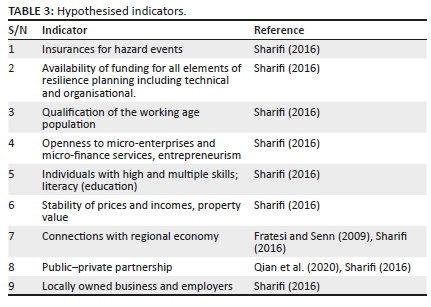
The processes applied for developing the tool are presented in Figure 1. A literature review was conducted to identify key factors/indicators that had potential and could help inform the economic resilience for WSSs. The review was also reinforced with the water-related publications for Tanzania and international WSSs. The indicators selection relied on their adherence to one of the phases of disaster management - mitigation, preparedness, response and recovery. Also, the selection depended on the characteristics of resilience aligning with the water service-provision goals for the WSSs. Thus, a tool with nine indicators was proposed.
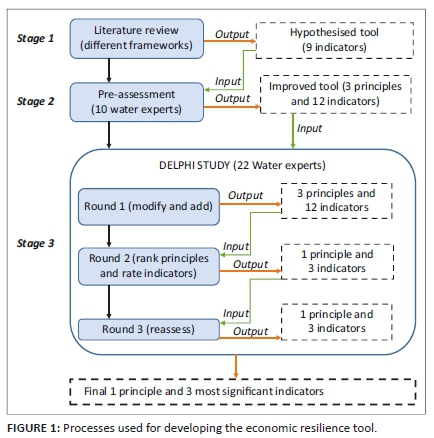
The proposed tool was made appropriate to assess resilience for Tanzania urban WSSs through a pre-assessment exercise taking place between September and October 2017, followed by a three-round Delphi survey from October 2018 to January 2019. A questionnaire was developed based on the hypothesised indicators and later used in the pre-assessment exercise. The pre-assessment involved 10 water supply experts from the public, private and research institutions. The experts had a working experience or research background of at least 5 years in the water supply industry. Experts were requested to comment, modify and add more indicators and rate their importance. The experts' opinions improved the tool to three principles and 12 indicators.
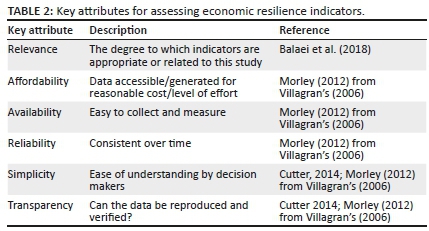
A three-round Delphi study was introduced to further improve the tool and make it appropriate to Tanzania urban WSSs. The exercise included the 10 experts who had participated in the pre-assessment. Besides, 12 new experts were invited, making an overall panel of 22 experts. At the beginning of each round, all experts were physically contacted by the researcher and asked to develop consensus and prioritise the components of the tool. In the first round, participants were asked to comment on the principles and indicators, and add more indicators, whereas during the second and third rounds they were asked to rank the principles and rate the importance of the indicators. The ranking was determined based on the order of one for the most important principle to three for the least important principle. Rating relied on six key attributes - relevance, affordability, availability, reliability, simplicity and transparency (see Table 2) - as useful guidance for determining the indicators' importance and potential for inclusion in the study.
Each attribute was rated based on a five-point Likert scale: strongly disagree (1), disagree (2), neither agree nor disagree (3), agree (4) and strongly agree (5). The agreement was reached when at least 70% of experts, on average, had rated the indicators between 4 and 5 (Wakai et al. 2013), and the standard deviation of the ratings is between 0.3 and 0.998 (Zhong et al. 2015).
Thematic analysis was carried out manually for the comments obtained from the pre-assessment exercise and first-round Delphi survey. Standard descriptive statistical analysis was applied for second- and third-round data using Statistical Package for Social Sciences, IBM SPSS Statistics 25. The mean scores and median were used to establish the ranking order of the components of the tool, whereas mean scores and standard deviations were used to describe the group opinion and the convergence of the range of importance ratings of the indicators, respectively. Depending on whether the data were normally distributed and using p < 0.05 as the level of statistical significance, t-test or non-parametric Mann-Whitney test results were analysed to compare whether there was a significant difference between the second and the third round. Furthermore, Kappa statistics were calculated to show the percentage agreement between the two rounds.
Ethical consideration
Ethical approval was obtained from the Ethics Committee of the University of Auckland, New Zealand (approval number 019619), and participant information sheets (PIS) were provided to experts and consent forms (CFs) signed by the participants.
Results
The study was conducted to develop a tool that has components suitable for assessing the economic resilience for Tanzania WSSs. A three-stage approach was employed: literature review, pre-assessment and a three-round Delphi survey. A review of literature established key features leading to a hypothesised tool with nine indicators that are relevant in assessing the economic resilience for WSSs (see Table 3).
Pre-assessment
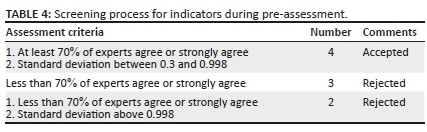
The proposed tool underwent a pre-assessment exercise involving 10 water experts - 50% possessed PhD qualifications, had more than 10-year experience in the water-related fields and were ranked as senior professionals at their workplaces. Others were senior associate professionals with experience ranging from 5 to 10 years. About 80% of all experts had experience in disaster management and possessed better research background. Results show that four indicators - 'availability of funding for all elements of resilience', 'qualification of the working age population', 'individuals with high and multiple skills' and 'public, private partnership (PPP)' - were accepted. Other indicators were rejected as shown in Table 4.
Two indicators - 'insurances for hazard events', and 'stability of prices and incomes' were restored by researchers because the first influences the security of the affected population, infrastructures and organisations, whereas the second affects the ability of the people to obtain water services from alternative sources. Along with insurances, there was a need for assessing the savings behaviour of the people and the organisations' cost recovery through billing, helping during crises. Thus, indicators such as 'individual and community savings' and 'cost recovery' were added. In addition to PPP, 'business cooperation (intra and inter)' indicator was added to assess the business-oriented interaction within and outside the organisations running the WSSs.
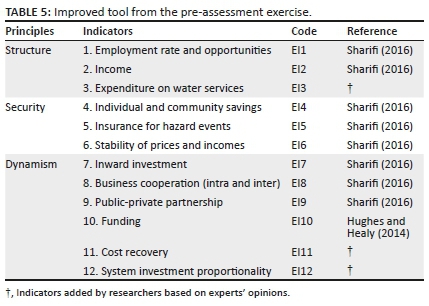
It is not uncommon to see high investment in parts of the WSSs than in others - especially in developing countries such as Tanzania. For instance, by 2015, the production part of the Dar es Salaam water supply had expanded twice the previous capacity, whilst the distribution part remained the same. This situation has resulted in pipe bursting and high levels of Non-Revenue Water (NRW) as the distribution system is unable to handle the water pressure. As such, researchers proposed an additional indicator - system investment proportionality. Moreover, through understanding the economic implications to the community, researchers proposed another indicator - expenditure on water services - to assess the water services expenses before and during flooding. Also, an 'inward investment' indicator was added to assess the stakeholders' interests to invest in the water supply industry. The improved tool comprised 12 indicators - all indicators were grouped into the most dominant principles for assessing economic resilience: structure, security and dynamism (see Table 5).
Three-round Delphi survey
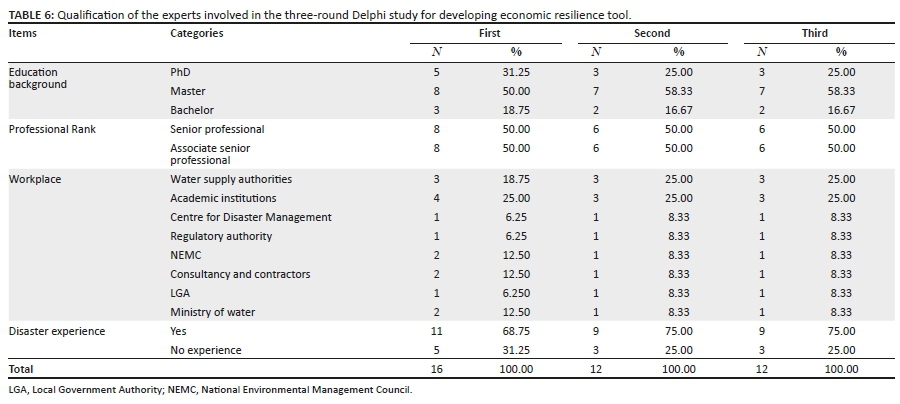
Amongst 22 experts who were initially contacted to participate in the exercise, 16 completed the first round, amongst those, 12 completed the second round and the third round. The response rates in the three rounds were 72.7%, 75% and 100%, respectively. No new expert was invited to participate after the exercise had commenced. The qualifications of the experts are presented in Table 6.
First-round assessment
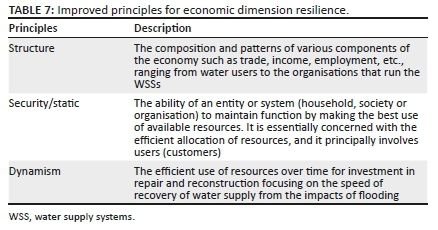
Of the 16 respondents in this round, eight participated for the first time. Results show that 75% of the experts provided comments strongly reflecting on the tool in the current study. Experts' opinions that emerged from this round were analysed and summarised as for latter addition, revision or integration in the study. Economic dimension was defined as the ability of economic entities, such as individuals, households, societies, water supply authorities and firms, to use their economic resources to quickly recover or adjust to the loss of WSSs because of flooding impacts. The dimension encompassed three principles (see Table 7). There were no significant changes concerning the indicators - a few specific comments entailed minor changes or improvement to the descriptions. For instance, 'system investment proportionality' description changed - the word equality was replaced by proportionality; thus, the description was improved to the proportionality of investment from the system production and transmission to system distribution such as to ensure uniformity in services and reduce losses.
Second-round assessment
The tool improved from first-round assessment comprised three principles and 12 indicators. In the second round, experts ranked the dimensions and principles and rated the indicators based on their importance. Dynamism was ranked the most important principle with higher frequency (five times) than any other principle. It was also associated with the lowest mean (1.75) and median (2.00) than others. Other principles had relatively high mean and median; besides, the structure principle had a higher mean (2.25) and median (2.50) than security/static (2.08 and 2.00) for mean and median, respectively. As such, the ranking order of the importance of principles started with 1 for dynamism, 2 for security and 3 for structure.
Rating of indicators: The six attributes applied as useful guidance in rating the importance of the indicators and their potential for inclusion in the study. Despite all indicators passing the relevance attribute, none of the indicators passed all six attributes. The majority (75%) were lowly rated for at least three out of the six attributes. 'Stability of prices and incomes', and 'Business cooperation (intra and inter)' were the lowest rated indicators - they underrated five out of the six attributes. Only 'public-private-partnership', 'system investment proportionality' and 'cost recovery' indicators were affected by one of the six attributes. Of all attributes, data availability was the major concern affecting most - 83.3% - indicators.
Results indicate that nine indicators equivalent to 75% were excluded from the study, prompting for the exclusion of two principles - structure and security. Excluded indicators also encompassed relatively low mean ratings and higher standard deviations than others. Such results suggest that the group opinions for their inclusion were low and the importance rating had low convergence compared with others. The lowest rated indicators include 'business cooperation (intra and inter)', 'individual and community savings' and 'stability of prices and incomes', as less than 50% of the experts thought they were important.
Only three indicators were included in this study at this stage - 'public-private-partnership', 'cost recovery' and 'system investment proportionality'. The importance of all three indicators was supported by 75% of the experts. Besides, 'system investment proportionality' was regarded the most important indicator because of higher mean rating (3.7500) and lower standard deviation than others. The second important was 'public-private-partnership', whereas 'cost recovery' was the least important indicator.
Third-round assessment
The improved tool included one principle and three indicators. During the third round, the majority (83.3%) of the experts did not revise their opinions because they were satisfied with the components of the tool, which had emerged from the second round. Some experts provided the following responses - 'I have gone through the indicators, and I find at the stage you have reached all suffice the assessment; that said I have no any additional input to it', 'very sorry for the late response; yes please, kindly proceed with further steps, I don't have different opinions' and 'I think there are no changes, you can proceed'.
On the contrary, 16.7% of the experts reconsidered their voting for re-ranking the principles and rerating the indicators. Statistical results comparing the second-round and third-round principles' ratings show a p-value of 0.4875, suggesting that there was no significant difference between the rounds. Similarly, statistical analysis comparing the importance rating of the indicators between the second round and the third round shows p-values ranging from 0.3949 to 0.4862, indicating no significant difference between the rounds. The results suggest that there was enough consensus, and experts were satisfied with the indicators - thus, all three sufficed for inclusion in this study. The mean value ranged from 3.667 to 3.750 and standard deviations from 0.754 to 0.888 - the overall convergence of the importance ratings can be considered acceptable. The Kappa values for the components of the tool ranged from 0.852 to 1.000 (mean = 0.9507, median 1.000). These values suggest that there was a substantial agreement between the two rounds - the final tool is presented in Table 8.
Discussion
The study adopted a three-stage approach - literature review, pre-assessment and Delphi survey - to develop a tool suitable for assessing the economic dimension resilience for WSSs in Tanzania. A tool comprising of nine indicators was proposed from the literature. The tool first derived from the literature included features that could assess the internal and external economic resilience of the WSSs at the microeconomic and mesoeconomic level. The tool, later, passed through a pre-assessment exercise that involved 10 water supply experts. Expert's opinions were analysed, and the results were used to improve the tool. The improved tool comprising of three principles - structure, static and dynamism - and 12 indicators was further subjected to a three-round Delphi exercise. The experts who provided feedback were between 12 and 16, which are considered minimally sufficient participants (Hsu & Sandford 2007) for a successful Delphi exercise. The rate of response increased from 72.7% in the first round to 100% in the final round, which is in line with Gargon et al. (2019) who suggest that small size panels are likely to have significantly better response rates. The rates were enhanced by participants' contact at the beginning of each round and regular reminders to provide feedback.
Results show that there was no substantial changes or modifications that emerged from the first round - the only comments were associated with two indicators, 'expenditure on water services' and 'system investment proportionality'. Experts suggested that the description of the expenditure on water services should consider other unpaid resources, such as volunteering works. For the systems investment proportionality, they suggested changes in the description from equal investment to proportional investment. Most of the indicators that were excluded during the second round were associated with data availability, affordability and reliability. Indicators that were under-rated for those three attributes could not qualify for inclusion in this study, and the majority were excluded. The three attributes express concerns in the country as in most other developing countries. For instance, Nobert (2016), UN-WATER (2013), URT (2008) and World Bank (2018), concurred with the current findings that the lack of consistent and accurate data is a typical limitation in the country. The findings suggest that the three attributes are principle factors when choosing indicators in the country and other developing countries.
Most experts were satisfied with the tool that involved one principle and three indicators after the second round, such that they did not revise their voting in the subsequent round. Consensus building in two iterations is no strange as other studies, such as Suwaratchai et al. (2011), were able to obtain consensus during the second round. Some experts reconsidered their voting during the third round - statistical results indicated that the importance ratings for indicators between the second and third rounds had no significant difference. The mean scores and standard deviation values suggest that there were better group opinions and that the overall convergence of the importance ratings can be considered acceptable. Moreover, Kappa statistic values for all components of the tool ranged from 0.852 to 1.000 - thus, according to Zhong et al. (2015), the values suggest that there was a substantial agreement between the two rounds and that the consensus had been reached.
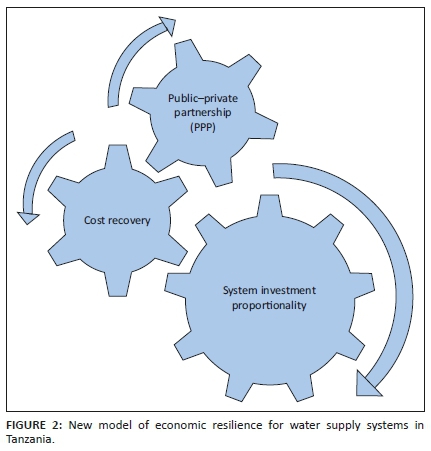
The tool underwent significant changes at the end of the Delphi exercise, excluded indicators (75%) prompted for the automatic omission of two principles - structure and security. That said, dynamism principle, which is associated with how fast the system could recover from flood hazards and return to its normal condition, was in favour of the experts and remained the only principle for the tool. Besides, only three indicators - system investment proportionality, cost recovery and PPP - were included in the dynamism principle of the tool. The first two indicators assess the internal economic resilience - for instance, cost recovery indicates the capacity of the organisations to generate own financial resource through billing leading to availability of contingency funds, which could facilitate rapid recovery of services aftermath. The system investment proportionality depicts the efficient use of the financial resources in such a proportion that could not affect the system functionality. The last indicator - public-private partnership assesses the external economic resilience, it describes the adaptive capacity that could be enhanced by assistances from other partners during flooding. In all cases, system investment proportionality is the most important indicator followed by both public-private partnership and cost recovery indicators. The findings suggest that the economic function of the water supply at the organisations level is vital for building WSSs' economic resilience against flood hazards. The new model of economic resilience for WSSs in Tanzania is presented in Figure 2.
The current study was conducted through a review of various international economic resilience attributes from different frameworks and made relevant to Tanzania through experts' involvement. Thus, the study entails a more needed beginning for broad agreement about the components of WSSs' economic resilience against flood hazards in Tanzania. To date, studies on the water supply field in Tanzania have been focused on water management, climate change studies and floods risk analysis with limited focus on economic resilience. Thus, the current tool is useful in evaluating the economic dimension resilience for WSSs in the country. The tool is supported by a management approach of enabling water supply organisations to provide water supply services sustainably when faced with flood hazards.
The tool can be used by water supply professionals and managers to assess the economic resilience for WSSs using their internal data. The tool can also be used to identify priority activities that can assist in enhancing resilience and consequently address future flood hazards. Finally, the tools can be applied in other developing countries, as the agreed measures were devised from general concepts of the economic resilience from the literature.
Conclusion
The study developed a tool with a principle and key indicators of the economic dimension resilience for WSSs in Tanzania. It provides a potential beginning for broad agreement regarding the key components of the economic resilience for WSSs in Tanzania. The economic components are the principle requirements enabling WSSAs to have economic capacity and collaboration in enhancing technical, environmental, organisational and social resilience for the WSSs. For instance, cost recovery ensures availability of contingency funding that can support the resilience building activities. The tool can be used for evaluating and informing the priority practices that can assist water supply organisations in Tanzania and other developing countries to address future impacts of flood hazards. Like other qualitative tools, the assessment process can be affected by subjectivity, but this can be reduced using a group of experts during the assessment process. Data availability and quality would be another limitation; however, with proper data management systems, WSSAs can ensure a smooth assessment process.
Acknowledgements
The authors appreciate the participation of Tanzania water experts who spent their precious time to review, rate and rank the variables forming the current economic resilience tool.
Competing interests
The authors have declared that no competing interests exist.
Authors' contributions
L.S. was responsible for conceptualisation, methodology, formal analysis, writing-original draft, investigation. S.W. was responsible for review and editing, supervision.
Funding information
This research received no specific grant from any funding agency in the public, commercial or not-for-profit sectors.
Data availability statement
All data, models and code generated or used during the study appear in the submitted article.
Disclaimer
The views and opinions expressed in this article are those of the authors and do not necessarily reflect the official policy or position of any affiliated agency of the authors.
References
Alshehri, S.A., Rezgui, Y. & Li, H., 2015, 'Disaster community resilience assessment method: A consensus-based Delphi and AHP approach', Natural Hazards 78(1), 395-416. https://doi.org/10.1007/s11069-015-1719-5 [ Links ]
Balaei, B., Wilkinson, S., Potangaroa, R., Hassani, N. & Alavi-Shoshtari, M., 2018, 'Developing a framework for measuring water supply resilience', Natural Hazards Review 19(4), 04018013. [ Links ]
Bastaminia, A., Rezaei, M.R. & Dastoorpoor, M., 2017, 'Identification and evaluation of the components and factors affecting social and economic resilience in the city of Rudbar, Iran', International Journal of Disaster Risk Reduction 22(1), 269-280. https://doi.org/10.1016/j.ijdrr.2017.01.020 [ Links ]
Bhattacharya, A., Meltzer, J.P., Oppenheim, J., Qureshi, Z. & Stern, N., 2016, Delivering on sustainable infrastructure for better development and a better climate, Brookings Institution, Washington, DC.
Bruneau, M., Chang, S.E., Eguchi, R.T., Lee, G.C., O'Rourke, T.D., Reinhorn, A.M. et al., 2003, 'A framework to quantitatively assess and enhance the seismic resilience of communities', Earthquake Spectra 19(4), 733-752. https://doi.org/10.1193/1.1623497 [ Links ]
Christopherson, S., Michie, J. & Tyler, P., 2010, 'Regional resilience: Theoretical and empirical perspectives', Cambridge Journal of Regions, Economy, and Society 3(1), 3-10. https://doi.org/10.1093/cjres/rsq004 [ Links ]
Cimellaro, G.P., Renschler, C., Reinhorn, A.M. & Arendt, L., 2016, 'PEOPLES: A framework for evaluating resilience', Journal of Structural Engineering 142(10), 04016063. [ Links ]
Cutter, S.L., 2014, 'The Landscape of Resilience Measures' in Resilient America Roundtable, Workshop on Measures of Community Resilience, 05 September, 2014, University of South Carolina, Columbia, South Carolina.
Cutter, S.L., 2016, 'The landscape of disaster resilience indicators in the USA', Natural Hazards 80(2), 741-758. https://doi.org/10.1007/s11069-015-1993-2 [ Links ]
De Bruijn, K., Buurman, J., Mens, M., Dahm, R. & Klijn, F., 2017, 'Resilience in practice: Five principles to enable societies to cope with extreme weather events', Environmental Science & Policy 70(1), 21-30. https://doi.org/10.1016/j.envsci.2017.02.001 [ Links ]
EM-DAT, 2019, The emergency events database, in D. Guha-Sapir (ed.), Universite Catholique de Louvain (UCL) - CRED, Brussels, viewed May 2019, from www.emdat.be
Fratesi, U. & Senn, L., 2009, 'Regional growth, connections and economic modelling: An introduction', in U. Fratesi & L. Senn (eds.), Growth and innovation of competitive regions, pp. 3-27, Springer, Berlin.
Gargon, E., Crew, R., Burnside, G. & Williamson, P.R., 2019, 'Higher number of items associated with significantly lower response rates in COS Delphi surveys', Journal of Clinical Epidemiology 108(1), 110-120. https://doi.org/10.1016/j.jclinepi.2018.12.010 [ Links ]
Guha-Sapir, D., Hoyois, P., Wallemacq, P. & Below, R., 2016, Annual disaster statistical review 2016: The numbers and trends, Université Catholique De Louvain, CRED, Brussels.
Holling, C.S., 1973, 'Resilience and stability of ecological systems', Annual Review of Ecology and Systematics 4(1), 1-23. https://doi.org/10.1146/annurev.es.04.110173.000245 [ Links ]
Hsu, C.C. & Sandford, B.A., 2007, 'The Delphi technique: Making sense of consensus, practical assessment', Research & Evaluation 12(10), 1-8. https://doi.org/10.7275/pdz9-th90 [ Links ]
Hughes, J.F. & Healy, K., 2014, Measuring the resilience of transport infrastructure, NZ Transport Agency, Wellington, New Zealand.
Kajitani, Y. & Tatano, H., 2009, 'Estimation of lifeline resilience factors based on surveys of Japanese industries', Earthquake Spectra 25(4), 755-776. https://doi.org/10.1193/1.3240354 [ Links ]
Martin, R., 2011, 'Regional economic resilience, hysteresis, and recessionary shocks', Journal of Economic Geography 12(1), 1-32. https://doi.org/10.1093/jeg/lbr019 [ Links ]
Martinelli, D., Cimellaro, G.P., Terzic, V. & Mahin, S., 2014, 'Analysis of economic resiliency of communities affected by natural disasters: The bay area case study', Procedia Economics and Finance 18(1), 959-968. https://doi.org/10.1016/S2212-5671(14)01023-5 [ Links ]
Mayunga, J.S., 2007, 'Understanding and applying the concept of community disaster resilience: A capital-based approach', Summer Academy for Social Vulnerability and Resilience Building 1(1), 1-16. [ Links ]
Morley, K.M., 2012, 'Evaluating resilience in the water sector: Application of the utility resilience index (URI)', Doctoral dissertation, George Mason University, Virginia. [ Links ]
Nobert, J., 2016, Meeting future demand for drinking water supply in Dar es Salaam: Hydrological modelling of the Ruvu River and assessment of flows, International Institute for Environment and Development (IIED), London, UK.
Qian, N., House, S., Wu, A.M. & Wu, X., 2020, 'Public-private partnerships in the water sector in China: A comparative analysis', International Journal of Water Resources Development 36(4), 631-650. https://doi.org/10.1080/07900627.2019.1685951 [ Links ]
Renschler, C., Frazier, A., Arendt, L., Cimellaro, G.P., Reinhorn, A.M., Bruneau, M., 2010, Framework for defining and measuring resilience at the community scale: The PEOPLES resilience framework, MCEER Technical Report MCEER-10-006, University at Buffalo, New York, NY.
Rose, A., 2004, 'Defining and measuring economic resilience to disasters', Disaster Prevention and Management: An International Journal 13(4), 307-314. https://doi.org/10.1108/09653560410556528 [ Links ]
Rose, A., 2007, 'Economic resilience to natural and man-made disasters: Multidisciplinary origins and contextual dimensions', Environmental Hazards 7(4), 383-398. https://doi.org/10.1016/j.envhaz.2007.10.001 [ Links ]
Rose, A., 2017, Defining and measuring economic resilience from a societal, environmental and security perspective, Springer Nature Singapore Pte Ltd, Singapore.
Rose, A. & Krausmann, E., 2013, 'An economic framework for the development of a resilience index for business recovery', International Journal of Disaster Risk Reduction 5(1), 73-83. https://doi.org/10.1016/j.ijdrr.2013.08.003 [ Links ]
Rose, A. & Liao, S.Y., 2005, 'Modeling regional economic resilience to disasters: A computable general equilibrium analysis of water service disruptions', Journal of Regional Science 45(1), 75-112. https://doi.org/10.1111/j.0022-4146.2005.00365.x [ Links ]
Sharifi, A., 2016, 'A critical review of selected tools for assessing community resilience', Ecological Indicators 69(1), 629-647. https://doi.org/10.1016/j.ecolind.2016.05.023 [ Links ]
Stevenson, S.R., Vargo, J., Ivory, V., Bowie, C. & Wilkinson, S., 2015, Resilience benchmarking and monitoring review, Working paper, deliverable 1, Wellington, New Zealand, National Science Challenges, viewed 21 May 2020, from https://www.resorgs.org.nz/wp-content/uploads/2017/07/nsc_rnc_full_report_july_2015_c.pdf [ Links ]
Suwaratchai, P., Sithisarankul, P., Sriratanban, J., Chenvidhya, D. & Phonburee, W., 2011, 'Utilize the modified Delphi technique to develop trauma care indicators', Journal of The Medical Association of Thailand 91(1), 99. [ Links ]
Tierney, K.J., 1997, 'Business impacts of the Northridge earthquake', Journal of Contingencies and Crisis Management 5(2), 87-97. https://doi.org/10.1111/1468-5973.00040 [ Links ]
UNDRR, 2019, Global assessment report on disaster risk reduction, United Nations Office for Disaster Risk Reduction (UNDRR), Geneva.
United Nations Development Programme (UNDP), 2019, Nasolo Village, Fiji Country case study on enhanced income security through a risk informed farm road, for GAR19, United Nations Development Programme, United Nations Office for Disaster Risk Reduction (UNDRR), Geneva, Switzerland.
The United Republic of Tanzania, 2015, The Disaster Management Amendment Act 16, Government Gazette, Tanzania.
United Republic of Tanzania (URT), 2018, Water utilities performance review report for the financial year 2017/2018, Energy and Water Utilities Regulatory Authority (EWURA), Dar es Salaam, Tanzania.
The United Republic of Tanzania, 2019, The Water Supply and Sanitation Act, United Republic of Tanzania, Government Printer, Dodoma by Order of Government.
United Republic of Tanzania, 2020, Water util ities performance review report for the financial year 2018/2019, Energy and Water Utilities Regulatory Authority (EWURA), Dar es Salaam, Tanzania.
United Nations-Water (UN-WATER), 2013, United Republic of Tanzania UN-Water country brief, UN-WATER, United Nations, New York, USA.
Van Leuven, L.J., 2011, 'Water/wastewater infrastructure security: Threats and vulnerabilities', Handbook of water and wastewater systems protection, pp. 27-46, Springer, New York City.
Villagrán, J.C., 2006, Vulnerability assessment in the context of disaster-risk, a conceptual and methodological review. SOURCE, No. 4/2006, Bonn: United Nations University, Institute for Environment and Human Security.
Vugrin, E.D., Warren, D.E., Ehlen, M.A. & Camphouse, R.C., 2010, 'A framework for assessing the resilience of infrastructure and economic systems', in K. Gopalakrishnan & S. Peeta (eds.), Sustainable and resilient critical infrastructure systems, pp. 77-116, Springer.
Wakai, A., O'Sullivan, R., Staunton, P., Walsh, C., Hickey, F. & Plunkett, P.K., 2013, 'Development of key performance indicators for emergency departments in Ireland using an electronic modified-Delphi consensus approach', European Journal of Emergency Medicine 20(2), 109-114. https://doi.org/10.1097/MEJ.0b013e328351e5d8 [ Links ]
Willis, H.H. & Loa, K., 2015, Measuring the resilience of energy distribution systems, RAND Corporation, Santa Monica, CA.
World Bank, 2018, Reaching for the SDGs: The untapped potential of Tanzania's water supply, sanitation, and hygiene sector, WASH Poverty Diagnostic, World Bank, Washington, DC.
Zhong, S., Clark, M., Hou, X.Y., Zang, Y. & FitzGerald, G., 2015, 'Development of key indicators of hospital resilience: A modified Delphi study', Journal of Health Services Research & Policy 20(2), 74-82. https://doi.org/10.1177/1355819614561537 [ Links ]
 Correspondence:
Lukuba Sweya
lswe528@aucklanduni.ac.nz
Received: 30 June 2019
Accepted: 28 Sept. 2020
Published: 11 Jan. 2021

