


Services on Demand
Article
 English (pdf)
 Article in xml format
 Article references
Indicators

Related links
-
 Cited by Google
 -
 Similars in Google
Share

 Permalink
SA Crime Quarterly
On-line version ISSN 2413-3108
Print version ISSN 1991-3877
SA crime q. n.63 Pretoria Mar. 2018
http://dx.doi.org/10.17159/2413-3108/2018/v0n63a3057
RESEARCH ARTICLES
Frequency and turmoil: South Africa's community protests 2005-2017
Peter AlexanderI; Carin RuncimanII; Trevor NgwaneIII; Boikanyo MolotoIV; Kgothatso MokgeleV; Nicole van StadenVI
IDirector of the Centre for Social Change (CSC) at the University of Johannesburg. palexander@uj.ac.za
IISenior researchers with the CSC. crunciman@uj.ac.za
IIISenior researchers with the CSC. tngwane@uj.ac.za
IVResearch assistants with the CSC .b.r.moloto@gmail.com
VResearch assistants with the CSC. kgothatsom@uj.ac.za
VIResearch assistants with the CSC.201473014@student.uj.ac.za
ABSTRACT
This article reports on the frequency and turmoil of South Africa's community protests from 2005 to 2017, which, taken together, have been called a 'rebellion'. It defines 'community protest' as protests in which collective demands are raised by a geographically defined and identified 'community' that frames its demands in support/and or defence of that community. It distinguishes between 'violence' and 'disorder', which has produced a novel three-way categorisation of turmoil, namely 'orderly', 'disruptive' and 'violent' protests. Drawing on the Centre for Social Change's archive of media reports, the largest database of its kind, and by comparing its data with details gleaned from the police's Incident Registration Information System (an unrivalled source of protest statistics), the article reveals a rising trend in frequency of community protests and a tendency towards those protests being disorderly, that is, disruptive and/or violent. In the process of advancing this position, the authors offer a critique of other attempts to measure the number and turmoil of community protests.
Early discussions about South Africa's high level of popular unrest focused on 'service delivery protests', but in recent years the broader conception of 'community protest' has gained currency, and we use it here.1 Whether one's main interest in the phenomenon is with social dynamics or with policy, a common starting point must be assessment of scale. We present evidence for two measures: total 'frequency' of protests, and what may be called 'turmoil'. Turmoil is a loose term introduced to encourage discussion between analysts who utilise a range of concepts with different definitions (such as riots, unrest incidents and violent protests). When calculating turmoil, we distinguish between orderly, disruptive and violent protests, and our conclusion is that community protests have occurred with growing frequency and more disruption and violence (or 'disorder' for short). We nuance this view, though, by proposing that from a high point in 2012, the total number of these protests and the number that was disorderly has flattened off somewhat.
Our assessment is based mainly on media reports of protests archived by the University of Johannesburg's (UJ) Centre for Social Change (CSC).2 We refer to these as media-reported community protests (MRCPs). Robustness of our calculations can be gauged through contrast with other accounts, of which there are two kinds. First, we look at estimates based on South African Police Service (SAPS) data, captured by its Incident Registration Information System (IRIS). We provided a review of IRIS and its statistics in South African Crime Quarterly 58 (2016), and that article should be regarded as a companion to the present piece.3 Second, there are evaluations provided by three other monitors utilising media data. These are the Armed Conflict Location and Event Data Project (ACLED), the Civic Protests Barometer (CPB), which is based at the University of the Western Cape, and Municipal IQ (MunIQ). Our engagement with these other organisations' appraisals necessarily involves a critique and clarification of their concepts and methodologies. This contributes a further dimension to the article.
We begin with concepts, then deliberate on methodologies, and, finally, consider estimates of protest frequency and extent of turmoil.
Community protests: conceptualisation
Our research, a form of protest event analysis (PEA), is quantitative, and requires definitions that can be operationalised in a consistent fashion. The first key concept is 'protest'. Drawing on international and local literature and our own experiences and objectives, we defined this as 'a popular mobilisation in support of a collective grievance'.4 'Grievance' conveys a sense of being wronged, without this necessarily being clearly specified. 'Popular' means 'of the people' rather than 'well supported', and implies action by people who are relatively marginal. Our theorisation consciously excluded battles between taxi associations, gangs, and the like; that is, between forces with similar status.5
We use the term 'community' in reference to protests related to a geographically identified area.6 This should not be taken to imply that 'communities' are homogeneous, and we are acutely aware that sometimes only a certain section of a community participates in a protest (often the unemployed). A 'community protest' is defined as a protest in which collective demands are raised by a geographically defined and identified 'community' that frames its demands in support and/or defence of that community. Community protests are distinguished from those with other foci, which we have termed 'labour-related', 'crime-related' and so forth. The notion of 'community protest' is broader than 'service delivery protest'. The latter term, frequently used by journalists in South Africa, tends to conceal the complexity of issues that communities raise, which often include criticisms of South Africa's democracy. Furthermore, the SAPS, the Department of Cooperative Governance and the South African Local Government Association (SALGA) are now using the term 'community protest'.7
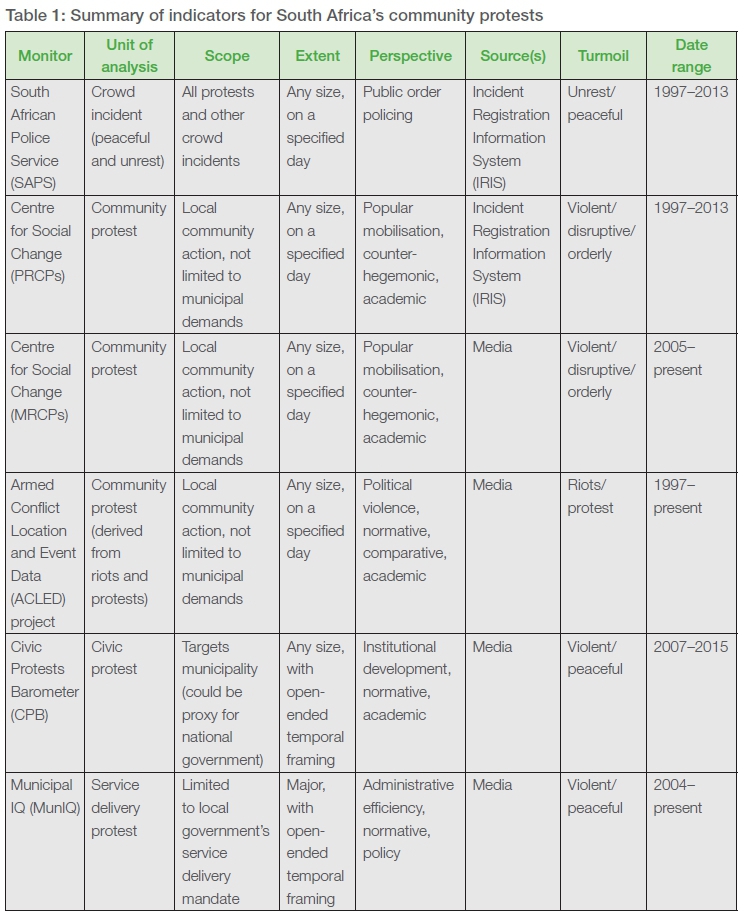
Our approach differs to that of other databases. Table 1 encapsulates aspects of various measurements of community protests.8It contrasts our database of MRCPs with (a) IRIS, (b) our IRIS-derived police-recorded community protests (PRCPs), (c) ACLED, (d) CPB and (e) MunIQ. It summarises methodological as well as conceptual differences, both of which have a significant impact on frequencies. The variation evident in the table is not accidental but is underpinned by divergent reasons for counting protests; that is, different perspectives (and, implicitly, different theories of protest).
The SAPS's IRIS is an aid to public order policing (POP), and POP capture and input of the data. It records 'crowd incidents' - including social and sporting occasions - rather than protests.9 The CSC was fortunate in gaining access to information about 156 230 incidents recorded by IRIS for the years 1997 to 2013. IRIS has a number of fields for data capture, but for protest analysis the most important are open-ended notes provided for each incident (which vary in length from a few words to more than a thousand). Analysis of a large random sample of these notes revealed that, using our definitions (above), about 43% of all crowd incidents were 'protests', and that of these, about 22% were 'community protests'.10 We call the latter PRCPs (as distinct from MRCPs). PRCPs are a far more comprehensive record of community protests than MRCPs (see below). However, our MRCPs are valuable for three reasons. First, they provide data that extends beyond 2013. Second, they act as a check on IRIS, which has blind spots, notably the years 2007-2009 when reliability was severely impaired by a marked reduction in the number of public order police. Third, though not considered further in this article, MRCPs are derived from the CSC's database, which includes a different range of information about protests than included on IRIS.
In contrast to the SAPS perspective, we have collected media data and interpreted police data with a view to understanding the social dynamics of protest. Ultimately, we want answers to questions like: Why do people protest? What is the impact of protest on political change? By way of further contrast, the other media monitors have normative concerns; they see protests as evidence of something wrong and are asking questions about what needs to be fixed. They are not necessarily hostile to protesters. The CPB is concerned with institutional development and MunIQ with administrative efficiency. ACLED's attention to protests is secondary to its primary interest in armed conflict and political crisis, which provides a context for considering interventions of various kinds. The significance of these distinctions will be more apparent when we turn to 'turmoil'. For now, two points are relevant. First, overlapping perspectives and similar sources make it possible to compare frequencies. Second, assessing concepts and judging outcomes requires a sympathetic understanding of perspectives, none of which is, a priori, better than others.
ACLED divides conflict events into 'event types'. Two of these interest us, 'riots' and 'protests', and ACLED combines these into a single category of 'riots/protests'. According to its definition, these are 'demonstrations against a (typically) political entity, such as a government institution, although this may also include some demonstrations against businesses or other private institutions.' It adds: 'The event is coded as involving protesters when it is non-violent; and as involving rioters if the demonstrators employ violence.'11 ACLED captures data in 'real time' and its files are regularly updated and publicly available. Event records are accompanied by open-ended notes, which, although less detailed than those provided by the SAPS, assist our research in two significant ways.12 First, read alongside definitions for other 'event types', one can see that ACLED's 'riots/ protests' approximate to the CSC definition of 'protests'. Second, they provide sufficient information for us to distinguish which 'riots/ protests' qualify as 'community protests'. So, as with SAPS data, ACLED data can be compared directly with our own, and differences are reduced to sources and methodology.
CPB and MunIQ, however, do not detail the protests they record (nor do we at this stage), so we must work with their own units of analysis, both of which centre on local government. The CPB is interested in 'civic protest', which, it says, refers to 'conflict which is public and commonly oriented towards local government or, through local government, towards the state as a whole'. It adds: 'Our definition excludes forms of protest linked to private interests, such as wage disputes and contractual failures, or protests that form part of wider civil disobedience movements.'13 In practice, its 'civic protests' are similar to our 'community protests', and sometimes it uses 'community protest' as an alternative to 'civic protest', clarifying that it includes 'any complaint or issue cited by protesters'.14 MunlQ, however, has a much narrower orientation, one limited to protests 'staged against municipalities' and solely in relation to their 'service delivery mandate'.15 This tallies with MunlQ's own remit as a local government intelligence specialist.
For CPB and MunlQ, a protest could last many days and it would still be counted as one protest. The SAPS, ACLED and we follow standard practice in protest event analysis and treat a protest as a daily event.16 So, for us, a protest that lasts three days is recorded as three events (assuming it is reported on each of those days). With most of our media sources appearing daily and details of action sometimes changing (e.g. size, location, level of disorder, demands, etc.) this makes practical sense. Daily counting is also logical for police who must report an incident at the end of a shift (at the latest). MunlQ only includes 'major' protests, which it defines as constituting more than 100 people.17 Along with ACLED and CPB, we refrain from imposing a limit, which, in our view, is problematic, because few media reports specify numbers. ACLED's data goes back to 1997, MunlQ's to 2003, ours to 2005 (though we have some reports for 2004), and CPB's to 2007.
Turmoil in community protests: conceptualisation
Broadly speaking, there are two ways of conceptualising turmoil in community protests (and, indeed, protests in general). The first is to merely differentiate between 'peaceful' and 'violent'. We reject this simple dichotomy, and in 2014 adopted an approach that separates 'order' from 'disorder' as well as 'peaceful' from 'violent'. All violent protests are disorderly, but not all disorderly protests are violent; some are disruptive but peaceful. This leaves us with a three-way categorisation of protests: orderly, disruptive, and violent.18 By implication, our definitions of 'peaceful' and 'violent' are different from those deployed by others. For us, violent protests are those with evidence of damage to property of others and/or injury to persons. Orderly protests are tolerated by the authorities and often negotiated in advance. They include pickets, marches and public meetings. Disruptive protests are identified by tactics such as blocking a road, commonly achieved by placing rocks and/or burning tyres. ln recent years, our conceptualisation has gained traction among other researchers.19
Concern to introduce 'order' into an understanding of protest turmoil relates to our social dynamics perspective, and is underpinned by historical considerations. Disruption - also known as civil disobedience - has been an integral part of movements associated with progressive social change, including the British suffragettes, Mahatma Gandhi's participation in the struggle for lndian independence, the United States' Civil Rights Movement, and the African National Congress's Defiance Campaign. lt often crosses a legal boundary, but does so without contravening widely held moral sensibilities opposed to harm and destruction. A disruptive protest challenges the established order, but does so without transgressing the South African Constitution.20 Treating barricades as 'violent' delegitimises the intentions of the protesters and misconstrues the dynamics of protest. A single peaceful/violent binary also has the danger of reinforcing moralism. As Bohler-Muller et al. put it: '[S]uch subdivisions are reductive, biasing audiences against certain social movements, and presenting a false dichotomy between "good" and "bad" protestors.'21
Arguably, the law, though ambiguous, includes its own distinction between violence and order.
Lt. Col. Vernon Day of the SAPS POP's policy, standards and research department explained: 'Failure to give notice [of a protest], resulting in a spontaneous incident, would not [necessarily require intervention] even if in contravention of [the Regulation of Gatherings Act (RGA)] 205 of 1993.'22 Here he echoes injunctions contained in the SAPS National Instruction on Public Order Policing (2014).23 These instructions were an attempt to reconcile the 1996 Constitution, which includes a right to 'unarmed and peaceful assembly', with the pre-Constitution RGA, which makes provision for police intervention in protests that are neither violent nor threaten injury or destruction of property, but involve disruption of vehicular or pedestrian traffic. That is, there is a distinction between 'disruption' (a word used in the Act) and violence.24
Our own division is essentially sociological and pragmatic, rather than legal, and we regard disruptive protest as peaceful unless there is evidence of actual violence. In our view, social scientists' primary responsibility is to understand phenomena rather than allow a priori judgments to cloud conceptualisations and methodologies. Disruption may be frustrating for non-participants and it might be a precursor to violent conflict, but, on its own, it does not result in injuries or damage the property of others. Our approach might be regarded as 'bottom-up', and it has been conditioned by our qualitative research, which includes interviews and interactions with police as well as protesters.25In a quantitative study using a large national sample, Bohler-Muller et al. found that people had little difficulty comprehending a three-way distinction similar to our own.26
Regarding other datasets, IRIS distinguishes between crowd (unrest) and crowd (peaceful) incidents. In addition to the common error of assuming a 'crowd' is a protest (see discussion above), there is often a second error (made, notably, by the SAPS itself), one of assuming that 'unrest' equates to violence by protesters.
In fact, for IRIS and public order police, 'unrest' is defined as 'police intervention', which could include arrests as well as, for instance, use of tear gas.27 This is logical and relatively easy to operationalise. The definition does not indicate violence by protesters (even if the police are responding to violence or threat of violence), and, indeed, the incident may not involve any 'violence' in the sense we have used it. As the name implies, public order police are primarily concerned with preserving order (as they see it), rather than responding to actual violence. For consistency, in analysing IRIS data, we applied our definition of violence to what we read in its 'notes'.
ACLED provides little detail and no justification in distinguishing between 'rioters' and 'protesters', simply stating: '[R]ioters are by definition violent, and may engage in a wide variety of violence, including in the form of property destruction ... or violence against unarmed individuals.'28 While we have problems with this particular use of the loaded term 'rioter', ACLED's definition of violence is close to our own, and, if applied literally, should include a disruptive demonstration as a 'protest' rather than a 'riot'.
The CPB's definition does the reverse; it treats disruptive protests (most of them anyway) as violent action. Asserting that violent protests are those 'where some or all of the participants have engaged in actions that create a clear and imminent threat of, or actually result in, harm to persons or damage to property', it clarifies that this includes cases 'where roads are barricaded and the passage of non-participants is impeded'.29 We have seen from large numbers of IRIS and media reports that describe disruption without mention of damage or injury, that it is wrong to assume that a barricade is a 'clear and imminent threat of harm'. The CPB's definition introduces an unnecessary element of subjectivity, making it less robust.30
Moreover, we know from qualitative research that police sometimes initiate violence, although not necessarily by intention.31 The CPB does in fact recognise this, commenting: '[L]abelling a protest as violent in nature fails to distinguish between those protests that were violent initially from those that became violent after aggressive responses by police.'32
Reinforcing concern about police interventions, MunIQ recently commented: '[P]olicing of protests appears to add another layer of violence, further destabilising the already vulnerable relationship between communities and authority figures.'33 Unfortunately, to the best of our knowledge, MunIQ has not published its definition of 'violence'.
Operationally, our 'violent protests' are those where there is any evidence of violence. In practice, media reports mostly provide insufficient detail to know whether it was protesters or the police who initiated violence. Many merely refer to a 'violent protest'. Also, from qualitative research, we know it is quite common for police to fire rubber bullets into a peaceful gathering and for protesters to respond by throwing stones and, perhaps later, by setting fire to a building. A reporter might be unaware of the initial police action or might not regard it as violent. Our approach has two implications. First, one should not make a moral judgment about protesters on grounds that their protest has been recorded as violent.34 Second, we are unlikely to undercount violent protests. Similarly, if there is any evidence of disorder we record the protest as either disruptive or violent, and, thus, are unlikely to exaggerate the number of orderly protests.35
Having clarified our conceptual approach, we now present an account of sources and methodology. Following that, we summarise findings on the frequency of, first, all community protests, and, then, 'disruptive' and 'violent' protests.
Community protests: sources and methods
We begin by discussing the CSC database in some detail. This is the first published account of our methodology. The CSC database draws from three sources. The first of these is the South African Broadcasting Corporation's (SABC) news research. Early on, this had the distinct advantage of including information from reporters and informants in the field, most of which was never aired, giving us protests not reported elsewhere, including in small towns. In recent years, many reports have been taken from other published sources.36
The second source, SA Media, is a news clipping service that archives South African newspapers -it includes nearly all dailies and some others too, and provides full reports rather than summaries. Started in 1978, it was originally hosted by the University of the Free State, but was closed in 2014 as an austerity measure, without alternative arrangements being made. Following a campaign, it was revived in modified form by Sabinet. Unfortunately, Sabinet has not recovered cuttings from the first five months of 2015.37In 2012, SA Media covered 49 newspapers;38under Sabinet it takes in 39.39 Discontinued newspapers were peripheral and made little difference to the number of protests reported. In actual fact, in 2016 and 2017 the proportion of our reports deriving from SA Media was slightly higher than in previous years. It is possible that improved technology and new protocols led to the selection of more articles, but we think the addition of New Age was more significant, because it carries a relatively high proportion of provincial news and hence more protests.40 In our calculation of frequencies for 2015 and the end of 2014, the period affected by disruption to SA Media, we have added extra protests, based on estimates, using experience of what SA Media contributes to the total. Fortunately, most protests are recorded in more than one source.
We chose SA Media articles using keywords, and we settled on the term 'protest' (having experimented with synonyms that failed to yield additional reports).41 One limitation of SA Media - indeed, of all our sources - is that it does not include African-language newspapers. Among these, the only daily paper is the isiZulu Isolezwe, which we checked for a month, only to discover it did not contain additional protests. Use of Lexis Nexis, another news clipping database, was trialled, but SA Media was more comprehensive.
Our third contributor is the South African Local Government Briefing (SALGB), an independent publication that monitors many aspects of local government, and is published a minimum of 12 times a year.42 It is especially valuable because it systematically gathers and précises online reports (as distinct from printed reports). SALGB's collection started in 2007, but a survey of online archives for protests before this date revealed very few extra protests.
Between 2005 and 2007 the SABC provided the majority of protest reports; from 2007 to 2015, SALGB contributed the most reports; and, since 2016, more reports have come from SA Media than from other sources. No one source dominates our data collection. Remember, too, that protests are usually reported by more than one source.
On receiving reports, our first task is to exclude anything that does not meet the criteria of a 'community protest'. This filter mainly affects SA Media sources, which include foreign protests and opinion pieces. Second, we archive reports, both physically and electronically. This includes the process of 'de-duplication', undertaken manually, which ensures that multiple reports of the same protest are included as only one event.43 We simultaneously collate the reports, thus maximising knowledge of each protest. Third, we capture data on Microsoft Access. Thirty fields are available but 'missing data' is common because reports often do not include required information. Fourth, data is copied into Microsoft Excel and, from there, to SPSS, which we use for analysis. Student assistants code reports, and everything is checked by Carin Runciman, one of our senior team members.44 In the early stages, the whole team discussed difficult cases to ensure consistency.
The media only report a minority of protests and one should give thought to possible biases. Fortunately, because we are able to compare our MRCPs with our PRCPs we have gained valuable insights in this regard. To the best of our knowledge (and that of other experts in the field) there has never been a release of police data anywhere in the world on the scale of the IRIS records we received, and what we offer here is probably a more precise account of media bias than found elsewhere. Even so, we should insert two cautionary notes. First, we are beginning to find MRCPs that do not appear in IRIS. Overall, they are a small minority, but we have not completed our search and are unable to be more specific at this stage.45 Second, because IRIS is dependent on input of data by POP, its record of protests is probably skewed by the location of POP units and the role of public order policing (though all police are supposed to report crowd incidents to locally-based IRIS controllers). This is likely to have two implications: under-reporting from small towns and rural areas distant from POP units (clearly a problem in 2007-2009), and underreporting of orderly protests that do not require POP intervention.
Notwithstanding these caveats, comparing our MRCPs with PRCPs for the period 2005-2013, it is possible to highlight four biases in media recording of protests. First, we estimate that the media has reported less than a quarter of the number of protests recorded by the police.46 It is therefore a mistake to take frequencies of MRCPs
- or frequencies of any media-reported protests
- as an accurate reflection of the total number of community protests. Second, a lower proportion of PRCPs than MRCPs is 'disorderly'. The media clearly give an exaggerated impression of the extent of violence and disruption associated with protests.47 We return to this below. Third, the size of protests, as reported in the media, tends to be greater than the size of protests as recorded in IRIS. That is, it is particularly smaller protests that go unreported in the media.48Fourth, a substantially higher proportion of MRCPs than PRCPs is recorded as occurring in the two provinces where most media offices are located, namely Gauteng and the Western Cape.49 If we are aware of these biases, we can make good use of media data to develop an approximation of trends in numbers of protests.
How does our recording of media-reported protests compare with that of others working in the same field? ACLED is an international operation, based at Sussex University, which monitors conflict across Africa and in many Asian countries. It is well funded with a large staff, operates rigorous checking, and utilises a wide range of sources, which include print and electronic news reports, government and civil society publications, and some direct reporting to ACLED staff.50 Its publicly available event records include mention of a specific source for each protest, which is a distinct advantage.51ACLED started 'real time' or 'active' coding in 2012, and then undertook 'back coding' for previous years. According to Clionadh Raleigh, ACLED's director: 'Active coding produces many more events.'52
The CPB has twice improved its methodology. From 2007 until 2011 it used Lexis Nexis and SALGB. From 2012 it shifted to use of social media and online 'news aggregators', such as the University of KwaZulu-Natal's social protest observatory. Since 2016 it has processed data in semi-automated fashion, and this 'allows for additional digital resources to be leveraged and ensure ever more comprehensive coverage'.53
The CPB searches using the keywords 'protest' and 'service delivery'. Frustratingly, MunIQ does not reveal its sources of information.
In evaluating these methodologies, the main evidence must be what they produce in practice. We turn now to findings on frequencies.
Community protests: frequency
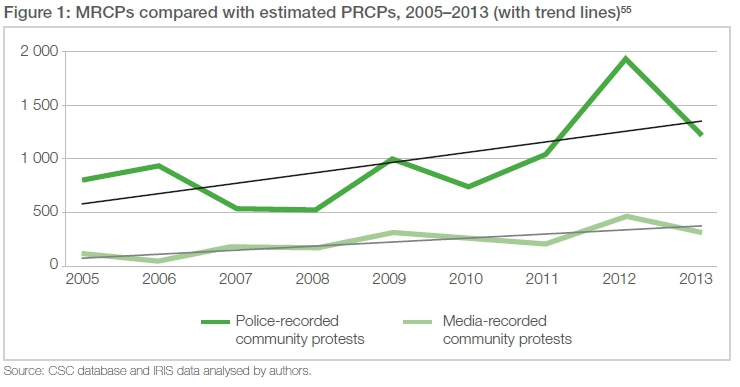
Figure 1 (on page 36) allows us to compare the CSC's MRCPs against its PRCPs, the closest approximation of all protests that occurred. Trends are similar: generally upwards across the period, with peaks in 2012. Without under-recording of PRCPs in 2007-2009, the shapes of the two lines would be even more alike (though the 2009 peak in PRCPs would be more distinct). Our estimated total number of recorded PRCPs for 2005-2013 is just under 8 700, and we have 2 054 MRCPs for the same period. That is, PRCPs outnumbered MRCPs by about 4.2 to 1 for the whole period, rising to 4.3 when the 20072009 years are excluded from the calculation.
Table 2 shows the total number of community protests (MRCPs), 2005-2017, on the CSC database.
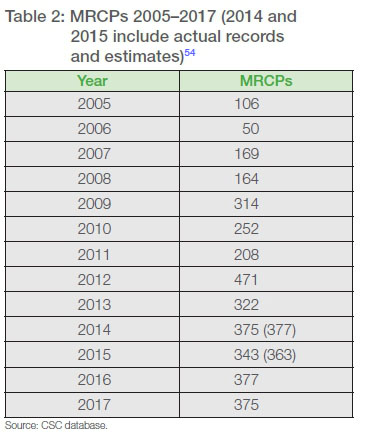
Figure 2 compares our MRCPs (the CSC line) with data from ACLED (our calculation of community protests), the CPB (civic protests) and MunIQ (major service delivery protests). MunIQ has recorded considerably fewer protests than the CSC, which is unsurprising, given its limited focus on service delivery, its exclusion of 'minor' protests and its method of counting all protests as a single event whatever their duration. However, the shape of the CSC and MunlQ lines is similar, which probably reflects that a high proportion of community protests include service delivery issues. lt may also indicate that MunlQ, like the CSC, has been consistent with sources.
Unlike the other three lines, the one that represents the CPB is rather flat, with almost no upward trend. The shapes of all graphs are similar until 2010, but it is noticeable that, whereas the others show a marked increase in the number of protests in 2012, the CPB records a decline. Given that the CPB changed its methodology in 2012, it is difficult to avoid the conclusion that its new sources were less generous than the old ones. This, in turn, reduces the value of the CPB graph as a gauge of the trend in frequency of community protests.
The profile of the ACLED graph is the complete opposite. It shows a sudden rise in the number of protests between 2011 and 2012 that is sharper than indicated by the CSC, MunIQ and, indeed, IRIS, and from 2013 onwards ACLED recorded more protests than the CSC. From 2005-2013 our methodology produced similar trends to those derived from IRIS, and our methodology and sources have been consistent, so we are content that our graph provides a reasonable guide to the pattern of protest frequency. Given that we have applied our own definition of 'community protest' to ACLED data, it is reasonable to assume that the sudden increase in numbers in 2012 is associated with commencement of 'active coding' as explained by Raleigh.57 However, ACLED is now using a wider range of sources than the CSC, and its figures currently come closer to the number of protests occurring (though, as seen from the police data, it is still a long way short of the actual frequency).
The CSC has two archives of information for South Africa's community protests: a large sample distilled from IRIS for 1997-2013, and a collection of media reports for 2005-2017. As a record of protests, the IRIS data is peerless. Comparing our MRCPs with the IRIS protests (referred to as PRCPs) it was found that, from 2005-2013, PRCPs exceeded MRCPs by more than 4 to 1, but the two indicators provided a similar pattern of rise and fall in frequency of events. The MRCPs were then compared with data from ACLED, CPB and MunIQ. Given the similarity in pattern between PRCPs and MRCPs and the CSC's source consistency, the CSC's MRCPs are probably a more reliable guide to the pattern of community protests from 2005 to 2017 than the other three databases. They show a peak in 2012, when 471 MRCPs were recorded, and then, from 2014, a levelling off with about 370 protests per year. We cannot explain the MunIQ and CPB peaks in 2014 or the ACLED peak in 2015, though these may have been related to definitions and sources. However, except for the CPB, we all show a much-increased level of protest across the period as a whole.
Turmoil in community protests: scale
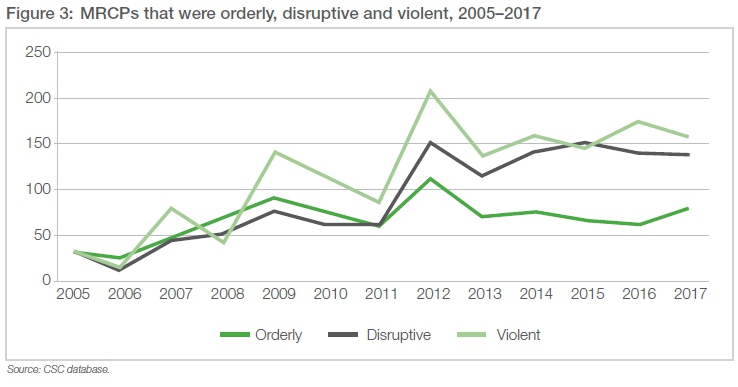
We now turn to the scale of turmoil. Figure 3 shows the number of our MRCPs that were, respectively, orderly, disruptive and violent. For the period as a whole, there has been a marked decline in the proportion that was orderly, with a peak of 50% in 2006 and nadir of 17% in 2016, but from 2012 the decline was slighter, and in 2017 there was a small increase in the number and proportion of MRCPs that was orderly. The upward trends of disruptive and violent protests were similar, but marginally steeper for violent protests. Once again, we remind the reader that a 'violent protest' was a protest that revealed some level of violence, whether initiated by the police or protesters.
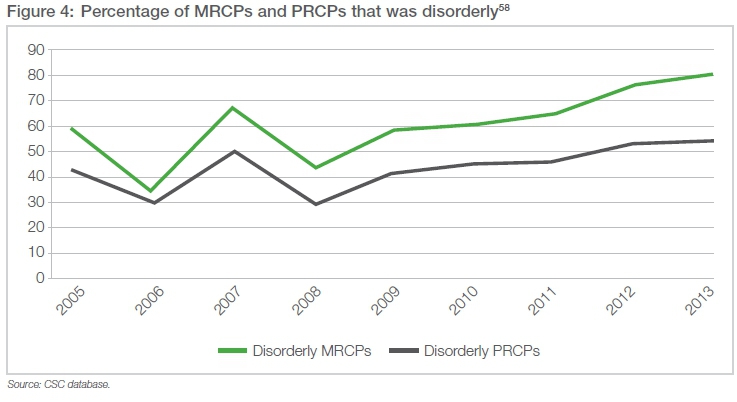
Figure 4, which includes PRCPs, gives credence to the picture obtained by analysis of MRCPs. It compares disorderly MRCPs with disorderly PRCPs for 2005-2013, and shows remarkable similarity in the shape of the two graphs.
We can now compare the protests we regard as 'violent' with ACLED's 'riots', which, by its definition, are regarded as violent. We have accomplished this in Figure 5. The ACLED data suggests that a higher proportion of all community protests was violent (riots) than indicated in the CSC (MRCP) data. However, the pattern is remarkably similar, with a levelling off in the proportion of all community protests that was violent from 2010. Differences can be accounted for in terms of definitions, selection of sources, and our reading of ACLED notes. The significance of these graphs is that while, in recent years, there has been an increase in the proportion of protests we regarded as disorderly (i.e. disruptive as well as violent), the proportion that was violent has remained approximately constant, at about 43% using CSR data and definitions.59
With the CPB and MunIQ the comparison must be a different one, because here we must contrast our figures for disorderly protests with theirs for violent ones (see discussion of concepts for explanation). CPB data shows that between 2013 and 2016, 90% of civic protests were violent and that in the first seven months of 2016 the figure reached 95%.60 With MunIQ the pattern was similar. They estimate that between 2004 and 2016, about 75% of service delivery protests were 'violent', with this ranging from a low of 67% in 2011 to a high of 86% in 2016.62Our figures for disorderly community protests as a proportion of all protests for these two years were, respectively, 69% and 82%.
So, our assessment is that, drawing on media data, while there has been an upwards trend in the number of disorderly community protests since 2006 (slighter from 2013) the proportion of all community protests that was actually violent has been relatively stable since 2010. Moreover, a similar conclusion can be reached if we base the interpretation on a careful reading of data from the other agencies.
Conclusion
This article has provided a critical review of the main sources of community protest data for South Africa, thus enabling comparisons between them. Description and discussion of the CSC's concepts, protocols and sources for enumerating MRCPs suggest it provides a strong guide for determining the pattern of community protests in the country. The quality of this data is underlined by comparison with SAPS data for 2005-2013 and by detailed consideration of concepts and sources used by ACLED, CPB and MunlQ for 2005-2017. We noted that MunlQ, while measuring only major service delivery protests, produced a similar shaped frequency graph to ourselves, perhaps because it was also consistent with its sources of information and because most community protests include demands about service delivery. However, we are concerned about MunlQ's lack of transparency. ACLED is now collecting more media reports of protests than we are and, if it is consistent with sources, could develop into a better indicator of the pattern of community protests in South Africa. Moreover, ACLED monitors a wider spectrum of events, giving it the potential to compare (a) community protests with other kinds of protest in South Africa, and (b) South African protest with protests in other countries.
ln considering turmoil associated with community protests, we introduced a distinction between violence and disorder, providing a three-way categorisation of protests as orderly or disruptive or violent. We argue that this way of understanding turmoil is more sympathetic to protesters and to the history of protest, better captures the changing dynamics of protests, and consistently applies a definition of 'violence'. Further, it is alive to the police's concern with both preventing disorder and policing violence.
Evidence revealed in the CSC's database showed there were about 3 550 MRCPs between 2005 and 2017. Assuming PRCPs outnumbered MRCPs by about 4 to 1, a ratio we explain, it would appear that more than 14 200 community protests took place between 2005 and 2017. In practice, IRIS did not manage to record all protests, thus the actual figure would have been higher, perhaps by about 25%. Moreover, MRCPs have occurred with increased frequency, rising from 50 in 2006 to a peak of 471 in 2012, then settling down to figures exceeding 320 for the next five years.
Further, whether one applies our three-way distinction, or the simple binary used by the SAPS, ACLED, CPB and MunIQ, there has been growing turmoil in community protests. Our own data shows a rise in community protests that were disorderly; from 50% in 2006 to 83% in 2016. However, we nuance this view using CSC and ACLED data to propose that the proportion of community protests that was actually violent has been relatively stable since 2010. Media reporting exaggerates the extent to which protests are disorderly, but the generally upward trend cannot be doubted and is confirmed by sources other than our own.
Since 2006, there has been considerable growth in the number and turmoil of South Africa's community protests. In 2010, Alexander described these protests as a 'rebellion', a term taken up by other writers.63 If it was right to draw attention to the scale of the revolt then, it is even more appropriate today.
Notes
1 Recent additions to the literature on South Africa's community protests include N Bohler-Muller et al., Minding the protest: attitudes towards different forms of protest action in contemporary South Africa, South African Crime Quarterly, 62, 2017; [ Links ] J Duncan, Protest nation: the right to protest in South Africa, Pietermaritzburg: University of KwaZulu-Natal Press, 2016; [ Links ] L Lancaster, At the heart of discontent: measuring public violence in South Africa, Institute for Security Studies (ISS), Paper 292, May 2016; T Lodge and S Mottiar, South Africa's 'unrest' or 'rebellion': a focus on Durban, in M Paret, C Runciman and L Sinwell (eds), Southern resistance in critical perspective, London and New York: Routledge, 2017; [ Links ] S Matebesi, Civil strife against local governance: dynamics of community protests in contemporary South Africa, Leverkusen: Barbara Budrich, 2016; [ Links ] M Paret, Violence and democracy in South Africa's community protests, Review of Political Economy, 42:143, 2015; [ Links ] BJ Roberts et al., Protest blues: public opinion on the policing of protest in South Africa, South African Crime Quarterly, 62, 2017; [ Links ] C Runciman, 'The ballot and the brick': protest, voting and non-voting in post-apartheid South Africa, Journal of Contemporary African Studies, 115, 2016; [ Links ] C Runciman, South African social movements in the neo-liberal age, in Paret, Runciman and Sinwell (eds), Southern resistance.
2 Data for the years to 2014 appeared in P Alexander, C Runciman and T Ngwane, Community protests 2004-2013: some research findings, Johannesburg: South African Research Chair in Social Change, 2014 (Media presentation, [ Links ] available on Centre for Social Change [CSC]), https://www.uj.ac.za/faculties/humanities/csc/Pages/Gallery-and-Video.aspx (accessed 20 March 2018).
3 P Alexander, C Runciman and B Maruping, The use and abuse of police data in protest analysis: South Africa's Incident Registration System (IRIS), South African Crime Quarterly, 58, 2016. [ Links ] See also P Alexander, C Runciman and B Maruping, South African Police Service (SAPS) data on crowd incidents: a preliminary analysis, Johannesburg: Social Change Research Unit, University of Johannesburg, 2015. [ Links ]
4 See discussion in C Runciman et al., Counting police recorded protests: based on South African Police Service data, Johannesburg: Social Change Research Unit, University of Johannesburg, 2016, 19. [ Links ]
5 Ibid., 19-20.
6 Ibid., 23-24.
7 For instance, see Human Sciences Research Council and University of Johannesburg, seminar on 'Rebellion of the poor: research, politics, policing and people', Pretoria, 30 June 2016; South African Local Government Association (SALGA), seminar on 'Developing innovative approaches to address community protests in local government', SALGA Head Office, Pretoria, 21 September 2016. The former is available on YouTube. We may have contributed to popularising the term 'community protest'; see C Paton, Protests not always about municipalities' 'service deliveries', Business Day, 17 March 2014, 3.
8 Assessments contained in this table and explained below are based on information present in organisations' publications and on their websites. Examples include Armed Conflict Location and Event Data (ACLED), https://www.acleddata.com (accessed 12 September 2017); TC Chigwata, M O'Donovan and DM Powell, Civic protests barometer 2007-2016, Cape Town: Dullah Omar Institute, University of the Western Cape, Civic protests and local government in South Africa Working Paper Series 2, 2017, 5-7; Municipal IQ, Press release, 24 October 2017. For the South African Police Service (SAPS), see Runciman et al., Counting police recorded protests.
9 A number of researchers have confused IRIS incidents with protests. This seems to arise from a monograph by B Omar, SAPS' costly restructuring: a review of public order policing capacity, Pretoria: ISS, 2007. The error has been repeated by various researchers, most recently J Omar, A legal analysis in context: the Regulation of Gatherings Act - a hindrance to the right to protest?, South African Crime Quarterly, 62, 2017, 22, [ Links ] and S Matebesi and L Botes, Party identification and service delivery protests in the Eastern Cape and Northern Cape, South Africa, African Sociological Review, 21:2, 2017, 82. [ Links ]
10 Runciman et al., Counting police recorded protests.
11 ACLED, Codebook, http://www.acleddata.com (accessed 14 December 2017).
12 ACLED, All Africa Files, http://www.acleddata.com (accessed 14 December 2017).
13 Chigwata, O'Donovan and Powell, Civic protests, 5.
14 Ibid., Technical Note, 4.
15 Municipal IQ, Press release.
16 See D Rucht, R Koopmans and F Neidhardt (eds), Acts of dissent: new developments in the study of protest, Oxford: Rowmand and Littlefield Publishers, 1999. [ Links ]
17 Personal communication with Ronesh Dhawraj, Research and Policy Analyst, SABC, 13 September 2015.
18 Although we have developed our thinking, the essence of the distinction can be found in C Runciman, A protest event analysis of community protests 2003-2013, South African Research Chair in Social Change, University of Johannesburg, 12 February 2014.
19 Bohler-Muller et al., Minding the protest; Duncan, Protest nation, 23; [ Links ] Lancaster, Heart of discontent.
20 In this sense it is similar to an unprotected strike.
21 Bohler-Muller et al., Minding the protest, 83.
22 Vernon Day to Peter Alexander, email, 21 May 2015, in Alexander, Runciman and Maruping, Use and abuse, 11.
23 SAPS, Operational Response Services, National Instruction 4 of 2014: Public Order Police: crowd management during public gatherings and demonstrations, issued by Consolidation Notice 7 of 2014.
24 South Africa, Regulation of Gatherings Act (RGA) (Act 205 of 1993), section 5(1). Our own definition of property is broader than that in the RGA, which uses qualifying terms such as 'extensive' and 'serious' that we found impossible to apply. In practice, municipalities, universities, magistrates and the police are often less tolerant than prescribed in the RGA, and during the student revolt (2015-16) interdicts were used to ban student protests (an intrusion that was challenged). So far, the Constitutional Court has not considered conflict between the Constitution and the implementation of the RGA, but a recent Western Cape High Court judgment ruled that section 12(1) of the act was unconstitutional because it limited and criminalised peaceful protests. See J Ndita, Judgment, Case A431/15, Socio-Economic Rights Institute of South Africa, 24 January 2017, par 93, 94, http://www.seri-sa.org/images/Mlungwana_High_Court_judgment.pdf (accessed 11 February 2018).
25 See L Sinwell et al., Service delivery protests:findings from quick response research in four 'hotspots' - Piet Retief, Thokoza and Diepsloot, Johanesburg: Centre for Sociological Research, University of Johannesburg, 2009; [ Links ] P Alexander and P Pfaffe, Social relationships to the means and ends of protest in South Africa's ongoing rebellion of the poor: the Balfour insurrections, Social Movement Studies, 13:2, 2014; [ Links ] P Alexander, C Runciman and T Ngwane, 'Growing civil unrest shows yearning for accountability', Business Day, 7 March 2014; C Runciman, Why changes to South Africa's labour laws are an assault on workers' rights', The Conversation, 12 December2017, https://theconversation.com/why-changes-to-south-africaslabour-laws-are-an-assault-on-workers-rights-88330 (accessed 22 March 2018).
26 Bohler-Muller et al., Minding the protest, 83.
27 Alexander, Runciman and Maruping, Use and abuse, 11.
28 ACLED, Definitions of political violence: agents and event types, https://www.acleddata.com/wp-content/uploads/2015/01/Definitions-of-Political-Violence_2015.pdf (accessed 17 December 2017).
29 Chigwata, O'Donovan and Powell, Civic protests, 13.
30 The Civic Protests Barometer (CPB) acknowledges that its 'methodology requires subjective assessments'. Ibid., Technical Note, 5.
31 See also M Rayner, L Baldwin-Ragaven and S Naidoo, A double harm: police misuse of force and barriers to necessary health care services, Johannesburg: Socio-Economic Rights Institute of South Africa (SERI), October 2017.
32 Ibid., 6.
33 Municipal IQ, Press release.
34 Further, given that poverty etc. entails suffering for those affected, and that the authorities frequently fail to respond to peaceful protest, we do not condemn all violence initiated by protesters.
35 Because protest event analysis is quantitative, and requires clearly bounded categories, there is no scope to distinguish different levels and kinds of violence. This is a limitation. See Paret, Violence and democracy.
36 Many thanks to Ronesh Dhawraj, who has kindly assisted us since 2010.
37 We are grateful to staff at Sabinet, who, on 4 November 2016, explained and demonstrated their procedures to Peter Alexander, Boitumelo Maruping and Eunice Khumalo.
38 'Koerante: SA Media 2012' included: Afrikaner, Beeld, Bloemnuus, Business Day Cape Argus, Cape Times, Citizen, Daily Dispatch, Daily News, DFA, Express, Mail & Guardian, Natal Witness, Newsweek, Ons Stad, Pretoria News, Sowetan, The Star, The Herald, The Times, Time, Volksblad, City Press, Independent on Saturday, Rapport, Saturday Argus, Saturday Star, Sunday Argus, Sunday Independent, Sunday Times, Sunday Tribune, Weekend Post, Africa Insight, African Armed Force, Farmers Weekly, Financial Mail, Finweek, Finweek Eng, Hervormer, Joernaal vir Eietydse Geskiedenis, Kerkblad, Kerkbode, Leadership, Landbouweek, Lig, Servamus, Taalgenoot, Teacher, Zuid-Afrikaan.
39 Sabinet's list included: Beeld, Burger, Business Day, Cape Argus, Cape Times, Citizen, Citizen Saturday, City Press, Daily Dispatch, Daily News, Daily Sun, Diamond Fields Advertiser, Ditsem Vrystaat, Financial Mail, Mail & Guardian, Pretoria News, Pretoria News Weekend, Rapport, Saturday Argus, Saturday Beeld, Saturday Dispatch, Saturday Independent, Saturday Star, Saturday Volksblad, Sowetan, The Star, Sunday Argus, Sunday Independent, Sunday Sun, Sunday Times and Time, Sunday Tribune, Sunday World, The EP Herald, The New Age, The Times, Volksblad, Weekend Post, Weekend Witness, Natal Witness. From Sabinet, SA media, http://cdn.sabinet.co.za/documents/SA_Media.pdf (accessed 29 August 2017).
40 See also R Pointer, From illegitimate disruption to failing state: how South African newspapers framed 'service delivery protests' in 2013, unpublished MA dissertation, University of Cape Town, 2015, 50.
41 Had we been interested in all protests, including strikes, we would have required a wider range of search terms.
42 Many thanks to Clive Keegan for supplying us with the South African Local Government Briefing (SALGB) for nearly 10 years. lt is an unparalleled source of information on local government, and it is a marvel that Keegan produces it single-handedly
43 Some very large conflict databases, notably the largest of them, the Global Database of Events, Language and Tone (GDELT), automate this process, but we believe that manual assessment is necessary, and this is also the view of ACLED and the CPB.
44 The student assistants who have undertaken coding work include Dee Cohen, David Scholtz, Boitumelo Maruping, Mahlatse Rampedi, Eunice Khumalo, Zinhle Mncube, Kgothatso Mokgele and Nicole van Staden. We thank all our student assistants, past and present.
45 The SAPS recognised that from 2007-2009, 20-40% of crowd incidents were unreported, but that by 2014 it was only missing about 5%. Alexander, Runciman and Maruping, Use and abuse, 14. We think the actual numbers are probably higher.
46 Runciman et al., Counting police recorded protests, 51.
47 lbid., 58-59. See also J Duncan, Below the radar, South Africa is limiting the right to protest, The Conversation, 15 June 2016.
48 Calculations by Boikanyo Moloto and Kgothatso Mokgele.
49 P Alexander (with C Runciman and T Ngwane), South Africa's rebellion of the poor: protests, triangulation and politics, presentation to Historical Materialism conference, 2015, slide 10. This is an issue that requires further investigation.
50 ACLED, Reporting sources, Working Paper 5, 2015, https://www.acleddata.com/wp-content/uploads/2015/04/ACLED_Reporting-Sources-Working-Paper-No.-5_2015.pdf (accessed 15 December 2017). Critiquing media reporting of protests, they note, like us, the problems of urban bias and exclusion of events deemed uninteresting for readers. Also, A Carboni and J Moody, interviewed by Peter Alexander, Sussex University, Brighton, 7 April 2017.
51 ACLED, All Africa Files, http://www.acleddata.com (accessed 15 December 2017).
52 Clionadh Raleigh to Peter Alexander, email, 6 September 2016.
53 Chigwata, O'Donovan and Powell, Civic protests, Technical Note, 3.
54 Figures in brackets include allowance for missing SA Media reports (see text).
55 This figure first appeared in Runciman et al., Counting police recorded protests, 51.
56 Sources: CSC database, ACLED, http://www.acleddata.com (accessed 12 September); Chigwata, O'Donovan and Powell, Civic protests, 8; Municipal lQ, Press release. Civic protests only specifies figures for 2009, 2014 and 2015, and other numbers are deduced from a graph. ACLED data is drawn from its variable EVENT_TYPE using 'protests and riots'. To allow for the absence of SA media reports from January-May 2015, we added two extra protests to the 375 CSC archived for 2014 and 20 to the 323 archived for 2015 (see text for explanation).
57 Clionadh Raleigh to Peter Alexander, email, 6 September 2016.
58 This figure first appeared in Runciman et al., Counting police recorded protests, 59.
59 Of course, bringing lRlS analysis data to the discussion, we would conclude that the actual proportion of community protests that is violent must be lower (see discussion above).
60 Chigwata, O'Donovan and Powell, Civic protests, 13-14. From 2012 to July 2016, about a third of their violent incidents involved 'intimidation', including the barricading of roads (what we regard as disruption), but the remainder involved attacks on individuals and destruction of property.
61 ACLED figures are for ACTOR1, which actually distinguish between 'protesters' and 'rioters'. For some years there is also a figure for 'police' (only a significant number in 2012 and, to a lesser extent, 2015) and we include these as 'rioters'. This gives totals that are the same as for EVENT_TYPE (i.e. the variable used above).
62 Municipal lQ, Press releases, 29 January 2014 and 1 February 2017.
63 P Alexander, Rebellion of the poor: South Africa's service delivery protests - a preliminary analysis, Review of African Political Economy, 37:123, 2010. [ Links ] See also Alexander and Pfaffe, Social relationships to the means and ends of protest in South Africa's ongoing rebellion of the poor.

