


Serviços Personalizados
Artigo
 Inglês (pdf)
 Artigo em XML
 Referências do artigo
Indicadores

Links relacionados
-
 Citado por Google
 -
 Similares em Google
Compartilhar

 Permalink
SA Crime Quarterly
versão On-line ISSN 2413-3108
versão impressa ISSN 1991-3877
SA crime q. no.53 Pretoria Set. 2015
http://dx.doi.org/10.4314/SACQ.V53I1.2
RESEARCH ARTICLES
'Unconscionable and irrational': SAPS human resource allocation
Jean RedpathI; Fairouz Nagia-LuddyII
IIs a researcher attached to the Dullah Omar Institute for Constitutional Law, Governance and Human Rights (formerly Community Law Centre) at the University of the Western Cape. redpath@iafrica.com
IIIs a researcher at Ndifuna Ukwazi, a non-governmental organisation. fairouz@nu.org.za
ABSTRACT
The Khayelitsha Commission revealed that areas that are predominantly populated by people who are poor and black are systematically allocated only a small fraction of the average per capita allocation of police personnel in the Western Cape. These areas also suffer among the highest rates of murder and serious violent crime in the province. The allocation of human resources to policing impinges on various constitutional rights. Given the inequity and irrationality apparent in the allocation of police personnel, the Khayelitsha Commission recommended that this method be urgently revised. This article reviews the evidence heard on the allocations and the method currently used to allocate police personnel, suggests an alternative method, and calls on the government to heed the recommendation of the Khayelitsha Commission that the state urgently revise its method of allocation of policing resources.
Inequities in the distribution of police human resources were highlighted1 by the Khayelitsha Commission of Inquiry,2 which called for an immediate 'review of the South African Police Service [SAPS] mechanism for determining human resource allocation'.3 Appointed in August 2012, the commission arose from complaints by a group of non-governmental organisations operating or based in Khayelitsha.4
Prior to the commission, many assumed that the SAPS allocated its available policing resources in a rational fashion, based on the relative burden of policing faced by different areas. This assumption came under question at the commission, when it emerged that on a per capita basis, areas such as Khayelitsha receive approximately one-third of the average per capita allocation. The issue of allocation by the state of human resources to policing is one that impinges on various constitutional rights, such as the right to safety and security of the person, dignity, life, and equality before the law, together with the right not to be unfairly discriminated against. Where the distribution of human resources in policing per capita is not only unequal from area to area, but areas comprising predominantly poor and black people are particularly under-resourced, indirect discrimination on protected constitutional grounds exists. Such unequal resourcing is automatically unfair unless the state can show that the allocations are fair.
At the commission, one of the authors gave evidence that reviewed the relative resourcing of police stations in the Western Cape as well as the method employed by the SAPS to determine relative resourcing. A rational method for determining relative resourcing was also proposed. This article recalls the evidence presented, with an adjusted proposed formula, and also analyses the evidence provided by various SAPS members pertinent to the allocation of resources. We conclude that an urgent review of the allocations is required.
How unequal allocations affect poor black areas
Khayelitsha, a Cape Flats township, is located approximately 30 km outside of Cape Town, covering three SAPS police stations: Khayelitsha (known as Site B), Lingelethu-West, and Harare. Khayelitsha the township was established in 1983 when certain black residents of KTC, Crossroads, Nyanga and Guguletu were forcibly relocated under apartheid legislation.5 Designed to accommodate 30 000 people,6 Khayelitsha has grown into a set of neighbourhoods with a population of about 400 000 people, approximately one-half of whom live in formal houses and one-half in shacks, mostly in informal settlements rather than backyards.7 The average yearly income of households in Khayelitsha is estimated at R20 000, compared to the Cape Town average of R40 000, with expert evidence suggesting that between 32% and 46% of all households in Khayelitsha are living in 'severe poverty'.8 Crime and violence is endemic to the area; murder and contact crime such as assault, aggravated robbery and rape are rife.9
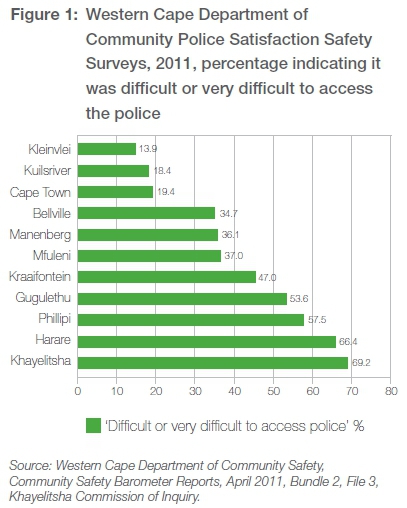
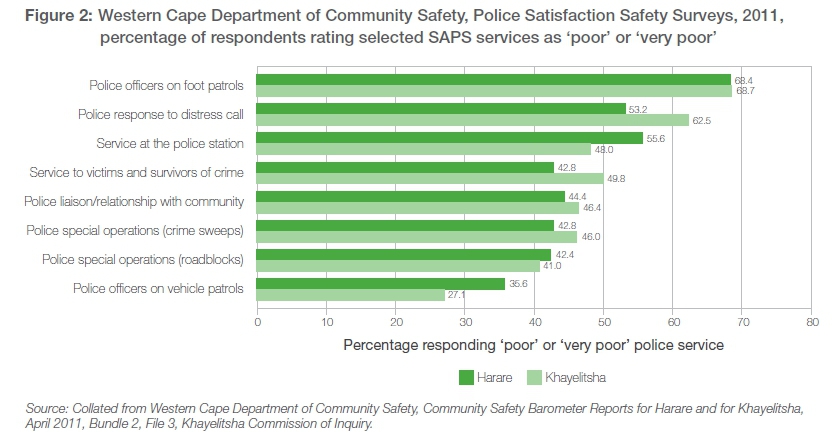
The commission heard a range of evidence on the breakdown in relationships, and found that members of the community have indeed lost faith in the police's ability to protect them.10 Figure 1 compares residents' rating of the difficulty accessing police in various areas, with Khayelitsha and Harare scoring the worst of the areas surveyed. The commission heard evidence that a lack of human resources was at least partly to blame for inadequate service delivery by the police. Indeed, senior SAPS members testified before the commission that there are not enough operational police persons to provide an efficient and effective service in Khayelitsha.11
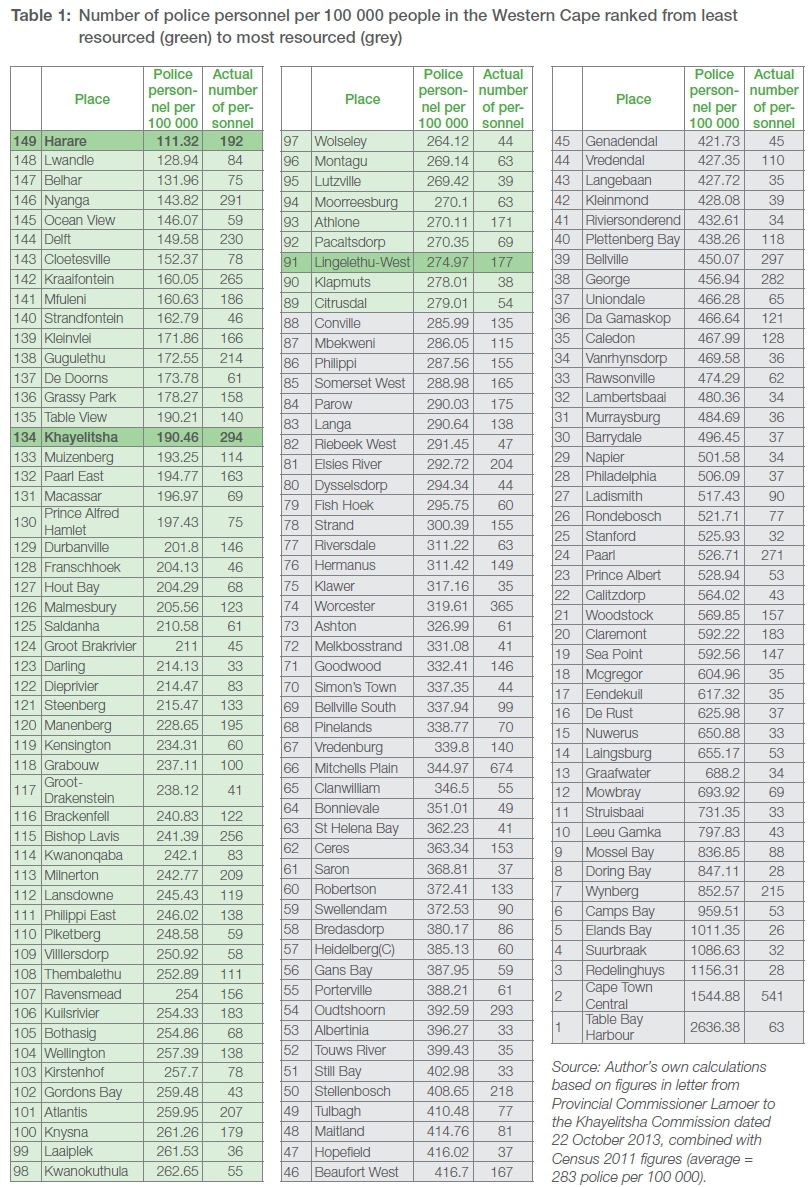
The commission wished to understand the extent to which this insufficiency occurred throughout the SAPS, or whether it was specific to the Khayelitsha areas. The actual allocation of operational human resources to the three Khayelitsha stations as well as all the other police stations in the Western Cape was therefore obtained from the SAPS by the commission.12 The commission requested one of the authors to analyse the figures. The numbers were simply compared to the respective populations of these policing areas to determine differences in allocation per capita (per 100 000 people), using population data from Census 2011 (see Table 1).
The calculations showed that Harare, which is among the poorest areas of the Western Cape and whose population is overwhelmingly black, had the lowest number of police personnel per 100 000 people of all police stations in the Western Cape (111 per 100 000 or 901 people for every police person). Indeed, Harare had almost 10 times fewer police per 100 000 than Camps Bay (959 per 100 000 or 104 persons for every police person). Besides Harare, similar areas such as Nyanga and Lwandle also had among the lowest per capita allocations of policing human resources in the Western Cape. Clearly, the evidence suggests that a lack of resources is particularly pronounced in these areas. How does such a situation come about?
How the SAPS determines the allocation of resources
The detail of the SAPS resource allocation process was described in evidence at the commission by Brigadier Leon Rabie, section head in the Performance Management Section of the SAPS Organisational Development division located in Pretoria. The SAPS allocation is based on a 'theoretical' requirement, calculated on the total time taken for all tasks done at a particular police station, as affected by a myriad factors. These factors, such as the presence of gangs or daily influx of commuters, are recorded on an 'Input Management Sheet'.13 The total time is converted into numbers of people and this number is called the Theoretical Human Resource Requirement (THRR). Summing the THRR for every police station gives the national requirement for police stations in terms of numbers and rank levels. This is the SAPS estimate of the ideal number of personnel required for the whole of South Africa. Unfortunately the THRR number is larger than the budget permits. The total fixed establishment that the SAPS budget is able to afford amounts to around 200 000 personnel for the SAPS in 2013/2014,14 which implies, Rabie testified, that on average only 68% of the calculated THRR is available for each police station.15
The SAPS's head office divisions (both national and provincial) receive a significant proportion (41%) of the total fixed establishment. The remaining 59%, which is the actual allocation available to be distributed among police stations, amounted to only 117 524 posts at the time of the commission.16 Thus, once the total budgeted numbers are approved, a distribution per police station is issued, containing the number of posts and the rank of those posts per police station, which, as indicated above, typically allocates around 68% of the calculated THRR to each police station. (This budgeted allocation was previously referred to as the Resource Allocation Guide [RAG].) Thus the 'fixed establishment' or RAG eventually arrived at is not the same as the THRR, as it only reflects the number of posts that could be established in terms of the SAPS budget and medium-term expenditure framework. The legislation does permit SAPS provincial commissioners to make adjustments within the provincial allocation, but it appears this is seldom done.
By only bringing budget constraints into consideration after determining the services to be offered by each police station and the ideal numbers of personnel needed for those services, the SAPS condemns the various services offered at police stations to be perennially understaffed in terms of its own theoretical calculations. The logic is something akin to planning to build many houses with many rooms and calculating the number of bricks needed, then, as a result of budget constraints, proceeding to build all the rooms in the houses with only three out of four walls due to the number of bricks available.
Flaws in the SAPS method
Apart from the problem of budget constraints resulting in the THRR's being unachievable, the SAPS THRR itself has a number of flaws. Some of these will be considered here, to demonstrate how an apparently rigorous method can result in absurdity.
The factors in the Input Management Sheet used to inform the THRR purport to relate to the burden of policing in one of the following ways:
• They affect the burden in terms of difficulty and extent of policing (e.g. number of square kilometres, presence of schools, daily influx of commuters, number of gangs), including the actual incidence of crime
• They affect the burden of police interaction with the courts and with prisons (e.g. proximity of courts and prisons)
• They affect the burden of internal police bureaucracy (e.g. accounting stations, services offered, etc.)
The first problem is that it is impossible to take note of all relevant factors impinging on the burden of policing. Furthermore, different factors may be counted twice, resulting in double-counting. For example, the presence of schools and influx of commuters are to some extent reflected in each other; taking account of both may lead to double-counting. Even assuming one could take account of all relevant factors without double-counting, the approach is highly dependent on accurate information being supplied. Incorrect estimates can result in large distortions. Indeed, the SAPS itself alluded to misrepresentations apparently designed to influence resource allocation in submitted evidence.
Finally, even assuming one could take into account all relevant factors without double-counting, the issue of the weight that should be ascribed to each factor comes into play. While the total formula was not provided in the evidence, some of the factors and their weightings were described. The hundreds of factors taken into account are combined together in a formula composed of these factors, with particular weights ascribed to them. These weights seem to have been arrived at in an arbitrary manner and without basis in any evidence.
For example, in relation to the factor of 'informal housing percentage', Rabie testified that if between 1% and 2.5% of the population lives in informal dwellings, the police station establishment is increased by 1%.17 If 10% or more of the population live in informal dwellings, the supplement is increased by 5%.18 This 5% is the maximum weighting, even if - as in the case of Khayelitsha - the THRR input sheet indicates 75% of the population living in informal dwellings.19
The weighting of 5% does not seem to be based on any empirical evidence. Colonel Nel (former station commander Harare) and Colonel Ralibola (station commander of Harare at the time) testified that vehicles cannot police informal areas, and foot patrols require between six and 10 members.20 This would suggest that the visible policing allocation for sector patrols would have to be inflated between three and Ave times (as normally two people would patrol in one vehicle) for the proportion of the population in informal areas - in other words, a 300% to 500% supplement to the visible policing component. Applied to the minimum of 17 police officials per sector, this would imply between 51 and 85 additional members necessary for patrolling, per sector.
Figure 2 shows Harare and Khayelitsha residents' dissatisfaction with various kinds of policing, with foot patrols unsurprisingly scoring very high levels of dissatisfaction.
Detective services also face challenges in informal settlements. Whereas a thorough investigation of a murder scene requires at least three hours, murders that have been committed (a) within a concentrated area of informal houses, and (b) without direct road access to the on-site investigation, pose unique and difficult challenges. The environment directly impacts on the investigation time, with the situation being worse at night, due to inadequate lighting. Management of the crime scene, in relation to basic tasks such as evacuating people from their shacks, cordoning off the area and locating forensic evidence such as bullets or spent cartridges is arduous or even impossible without additional personnel.21
Indeed, the expectation among SAPS commanders was that the factor 'informal housing percentage' would have more of an impact on human resource allocation: former Harare station commander Colonel Nel testified that he was so concerned about the shortage of personnel allocated to him in terms of the then RAG that he had 'spent many evenings poring over satellite maps of Harare, counting informal dwellings to try to increase the number of members Harare would be allocated'.22 Nel appears not to have been aware that however hard he tried, no more than a 5% weighting would apply.
The above briefly alludes to a few of the ways in which the THRR goes astray. Ultimately, however, the best test of the SAPS's method is common sense. Does the method accurately and fairly distribute resources on the basis of burden of policing?
The reality is that the allocations results in township areas, known for their difficulty of policing, almost all demonstrate massive downward adjustment from what would be suggested by the size of the population only. Indeed, not only is it the case that the adjustment is downward, but it is such that township areas are among the least resourced per capita, despite being among the most difficult to police.
Unless the SAPS wishes to argue that the burden of policing is indeed lowest in Harare, Lwandle, Belhar and Nyanga, and that the lowest resourcing per capita in these areas is therefore fair, these results alone demonstrate the flaw in the SAPS approach and suggest flaws in either one or all the factors considered, their weighting, or the input data.
Proposed method of allocating resources
The question then arises as to what would be a fair method of adjusting per capita figures to take into account the burden of policing. The first key change required with any method of determining a fair method of allocation of resources is to begin with the number of available human resources (in contrast to what is done at present) - in other words, the 117 524 posts available for allocation to police stations (leaving aside the issue of whether 41% of the close to 200 000 available posts should be allocated to divisions and provincial offices).
The starting point is the size of the population - areas with larger populations should have proportionally more resources. However, we know that policing burden is not determined only by population size. The question then arises as to what a fair method of adjusting per capita figures would be, taking into account differing burdens of policing for different components of policing.
The annual report of the SAPS typically distinguishes between the number of human resources allocated to Administration, Visible Policing, Detective Services, Crime Intelligence, Protection and Security.23 The Protection and Security Services component of policing appears not to be relevant to policing at station level, as it apparently serves only dignitaries. For the purposes of national figures and formula calculations, these are presumably then not included in the 117 524 available posts. (A separate issue for consideration is whether the amount spent on this component, and thus on dignitaries, is justified.)
Determining the burden of policing on detective services is relatively straightforward. This can be directly measured by the incidence of crime reported at the police station, as a detective's burden is directly determined by the amount of crime reported. Assuming that the detective services conduct only reactive investigations (and that crime intelligence is thus responsible for pro-active investigations), the incidence of reported crime, in particular serious reported crime, should be the primary determinant of relative resourcing in relation to detective services.
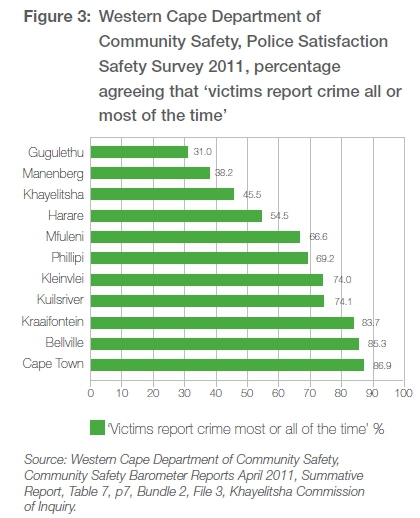
By contrast, the work of crime intelligence should be directly related to the number of crimes, particularly serious violent crime, actually occurring in the area (actual incidence of crime), rather than reported crime. Crime intelligence contributes to the neutralisation of crime by gathering, collating and analysing intelligence information that leads to actionable policing activity. But how do we know what the incidence of serious violent crime is, given that there is a high degree of under-reporting, particularly in places like Khayelitsha? Figure 3 shows the extent of under-reporting believed to occur by respondents in Western Cape Department of Community Safety surveys in selected policing areas.
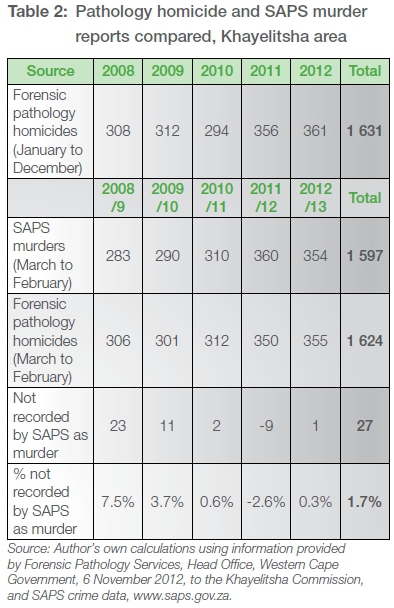
One reported crime indicator that is not susceptible to reporting trends is murder. This is particularly robust; checked against morgue data it does not appear to be suffering significant under-reporting: over Ave years the total variance is 1.7% for the Khayelitsha 'drainage area' (comprising all three policing areas). In areas where there are high reporting rates, murder tends to track serious violent crimes such as aggravated robbery, and can be considered to be a proxy for such crimes.24
In the absence of any other indicator, the incidence of serious violent crime, as indicated by proxy through the number of murders, should be the primary determinant of the relative resourcing of the crime intelligence component. Some areas, however, record no murders at all. In these areas, posts allocated to administration or management may need to take over this function.
Visible policing, however, should not only be about responding to crime, but about carrying out policing in a manner that prevents crime. Consequently it may be that visible policing functions carried out in current relatively crime-free areas will cease to be crime-free areas if such resourcing is removed. In other words, 'the incidence of crime' should not replace 'total population' as the determinant of allocation for visible policing, not least also because varying rates of reporting mean the actual incidence of crime is difficult to determine from area to area. For the same reason 'reported crime' should not determine visible policing allocations.
This is even more so because 'visible policing', in terms of SAPS functions, does not predominantly involve 'visible policing' as per a layperson's understanding. The organisational structure of visible policing at a category C1 or C2 police station is illustrated below (see Annexure A), showing a range of functions, many of which are to some degree office-based. Since demand for these additional functions is likely to be determined by population size, this further supports the argument that the population size of the policing area should be the main determinant of the number of personnel allocated. Within the number allocated to visible policing, however, there should be room for individual police stations to tailor the command structure to meet unique needs. This could mean, for example, more people allocated to sector teams in Khayelitsha at the expense perhaps of fewer people for 'general enquires'.
Consequently, in relation to visible policing, it is recommended that the total population (the per capita measure) should remain the primary indicator of relative resourcing. This is particularly important as visible policing is the largest component of the SAPS. There is an argument that this is too conservative and that in fact the incidence of violent crime should be the primary determinant of visible policing. The counter-argument is that much violent crime, in contrast with property crime, takes place in private spaces, which are not affected by visible policing.
The primary indicator of the administrative burden should thus be the population of the area served; alternatively, the total size of the policing allocation already made.
Proposed method for national figures
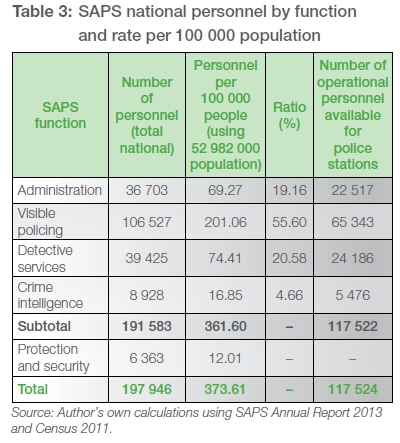
What does this method imply in practice regarding current figures? According to the SAPS Annual Report of 2013, the personnel available to the SAPS is as follows (noting that 21% of these personnel are Public Service Act employees as opposed to SAPS Act employees). The distribution of the 177 524 operational personnel is calculated using the ratios obtained from the annual reports.
As described above, the primary determinant of visible policing and administrative function resources should be population size. Thus, the available administrative and visible policing personnel must be divided equally among the population. To do this the total number of relevant personnel in South Africa is divided by the total population of South Africa, and multiplied by 100 000, to arrive at the number per 100 000.
On current personnel and population figures as indicated in Table 3, this implies that there should be 43 administrative personnel for every 100 000 population and 123 visible police personnel per 100 000 people. To calculate the number of visible policing personnel in a particular area, the population of that area must be divided by 100 000 and multiplied by 123, while for the number of administrative staff the population is divided by 100 000 and multiplied by 43.
The resourcing of the detective service component is by contrast primarily indicated by the number of crimes reported to the SAPS. The available detective resources must be divided equally among all reported serious crimes. The total number of detective personnel in South Africa is divided by total serious crimes in South Africa. To account for yearly anomalies, the average of the last four years' crime figures should be used. On current national personnel and crime figures this amounts to 2 101 417 crimes. This works out to 0.0115 detectives for every crime recorded, i.e. 115 detectives for every 10 000 crimes (or just over one detective for every 100 crimes).
The primary indicator of the relative resourcing of the crime intelligence component, as discussed above, is the average number of murders over the last four years, which amounts to 16 141. The available crime intelligence resources must be divided equally among all murders recorded. On current figures this would imply on average 0.339 crime intelligence personnel for every murder recorded in an area over the last four years.
Thus, a proposed 'national primary distribution formula', based on current available personnel, would look like this: (population * 43 / 100 000) + (population * 123 / 100 000) + (total serious crimes * 115/10 000) + (murders * 0.339).
Unlike the actual resource per capita figures, allocation on this basis does not result in township areas occupying the bottom of the resource list on a per capita basis. Instead, township areas occupy the middle band of resourcing. The reason townships do not occupy the 'most resourced' slot at the top of the list is because of the relatively low rate of reported crime (compared to actual crime). Most over-resourced are those areas with high daytime populations, such as Cape Town and Wynberg. High daytime populations drive up the reporting of crime, and reported crime is a significant factor in this formula. Nevertheless, their allocation would still need to reduce significantly in order to meet the proposed number, while Nyanga, for instance, would need an additional 237 people. (See Table 4 overleaf.)
Adjustments to the primary distribution allocations
Rational adjustments to the primary distribution formula might include those brought about when the formula results in a number of personnel too small to warrant a viable police station. This can be overcome by allocating to each station the minimum number of personnel necessary for a police station of that type (for example, a satellite station with limited opening hours requires at least four personnel).
Wherever the minimum number for the station type concerned is higher than the number suggested by the primary distribution formula as initially applied, the minimum number becomes the number allocated to that area. Whenever that substitution occurs, each such difference between the allocated number and the minimum number must be subtracted from the total number to be used in an amended formula. The primary distribution formula is then applied to the stations that have not had the minimum allocated, using the reduced totals.
For example, for the purposes of illustration assume that 12 is the minimum number of personnel for all police stations of all types. All police stations with primary distribution formula allocations below 12, of which there are say Ave, are allocated 12 personnel. From the total available personnel, 60 are removed from the total. For the formula calculations, the respective populations, crime numbers and murder numbers emanating from the already allocated areas must be subtracted from those totals in order to calculate the factors that must be applied to the remaining 144 stations.
Conclusion
In our view the pattern of unequal allocation of police resources between wealthy and poor suburbs in the Western Cape has not been adequately justified for rationality and fairness by the SAPS, and thus violates the equality clause (section 9) of the Constitution.25 In addition, whatever method used to allocate human resources must be open and transparent, and subject to public comment and scrutiny.26 Any anomalous per capita allocations must be rationally explainable. The findings and recommendations of the commission highlight the pressing need to review the resource allocation process. Indeed, data obtained by the Natal Witness showed that the same patterns of inequity apply in KwaZulu-Natal.
Special emphasis should be placed on the equitable distribution of experienced personnel with specialist skills in the investigation of serious contact crimes. Subsequent to the commission, a cohort of new, inexperienced recruits was allocated to Khayelitsha.27 This does little to rectify the situation, as new recruits require careful mentoring - thus placing an additional burden on experienced personnel. Furthermore, it does not address the overall situation of inequity -areas such as Nyanga, for example, are also very under-resourced. New recruits should be deployed to stations where experienced officers have the ability to provide mentorship, and parliament must exercise its oversight effectively in ensuring that the SAPS addresses the inequities affecting the most under-resourced stations in each province.
August 2015 marks the one-year anniversary of the submission of the commission's report to the premier. To date, no Arm commitment has been made by the national offices of the SAPS to ensure that the service deficiencies revealed by the commission will be addressed. Ndifuna Ukwazi and its partners were instrumental in campaigning for the commission. These organisations are now striving to ensure that there is momentum behind the call for the implementation of the commission's recommendations. The commission has already resulted in the largest release of police data to the public in South African history.28 This data allows us to understand the systemic problems within the SAPS, which continue to hamper its ability to provide efficient and effective services to communities. The inequitable allocation of police resources, favouring the protection of capital and wealth rather than poor and crime-ridden communities, is a glaring fault.
But the issue revolves around more than just a rectification of a formula for proper resource allocation. Communities such as Khayelitsha, which are plagued by some of the highest crime rates in South Africa, require decision makers within the SAPS, the DoCS and the City of Cape Town, inter alia, to muster the political will to develop a comprehensive plan to ensure that the rights of township inhabitants to safety and security are protected.
Notes
1 K O'Regan and V Pikoli, Towards a safer Khayelitsha: the report of the Commission of Inquiry into the Allegations of Police Inefficiency and a Breakdown in Relations between SAPS and the Community in Khayelitsha [KC report], Summary, August 2014, xxiv. [ Links ]
2 The Khayelitsha Commission of Inquiry into Allegations of Police Inefficiency and a Breakdown in Relations between SAPS and the Community of Khayelitsha, also referred to as the O'Regan-Pikoli Commission.
3 KC report, Summary, xxvi.
4 The Social Justice Coalition (SJC), the Treatment Action Campaign (TAC), Equal Education (EE), the Triangle Project and Ndifuna Ukwazi (NU) (referred to jointly as the complainant organisations).
5 Ndifuna Ukwazi, Our evidence for the commission: a collection of community affidavits submitted to the O'Regan-Pikoli Commission of Inquiry into policing in Khayelitsha, 2014, 3.
6 Ibid.
7 J Seekings, Economy, society and municipal services in Khayelitsha: report for the Commission of Inquiry into Allegations of Police Inefficiency in Khayelitsha and a Breakdown in Relations between SAPS and the Community of Khayelitsha, Centre for Social Science Research, University of Cape Town, December 2013, http://www.khayelitshacommission.org.za/images/witnesses/13.%20Jeremy%20Seekings%20Dec%202013.pdf (accessed 24 June 2015). [ Links ]
8 KC report, 40, para. 37.
9 Ibid.
10 Ibid., Summary, xxv.
11 Ibid., 391, para. 154.
12 Letter from Lt. Gen. Arno Lamoer on behalf of the Provincial Commissioner, 22 October 2013. It was of some concern that in the data submitted in this letter, although the column submitted by the SAPS was labelled 'police personnel per population', in fact the column indicated the number of people per police person. The incorrect formulation could give the impression Harare was well-resourced. Population figures were slightly different from those independently calculated, but this did not affect the trends observed.
13 Statement by Leon Rabie to the Khayelitsha Commission of Inquiry.
14 Ibid., para. 5.5.
15 KC report, 245, para. 105. Presidential police stations, such as Khayelitsha Site B, may receive close to 100% of their allocation, with others receiving less than the 68% average as a consequence.
16 Statement by Leon Rabie, para. 5.5.
17 KC report, 245, para. 103.
18 Ibid. This does not match the information provided in his affidavit.
19 Annexure A to Rabie's affidavit.
20 KC report, 232, para. 50.
21 Ndifuna Ukwazi, evidence to the Khayelitsha Commission of Inquiry.
22 KC report, 232, para. 51.
23 SAPS, Annual report, 2014 , 250.
24 See, inter alia, UN Office on Drugs and Crime, Global study on homicide 2011: key findings, https://www.unodc.org/documents/data-and-analysis/statistics/Homicide/Global_study_on_homicide_Key_findings.pdf.
25 Constitution of the Republic of South Africa 1996.
26 KC report, 274, para. 219
27 Interview with Major General J Brand, Station Commander, Khayelitsha.
28 See Khayelitsha Commission, Information, http://www.khayelitshacommission.org.za/2013-11-10-19-36-33.html.
Annexure


