


Services on Demand
Article
 English (pdf)
 Article in xml format
 Article references
Indicators

Related links
-
 Cited by Google
 -
 Similars in Google
Share

 Permalink
SA Crime Quarterly
On-line version ISSN 2413-3108
Print version ISSN 1991-3877
SA crime q. n.47 Pretoria Jan./Mar. 2014
http://dx.doi.org/10.4314/sacq.v47i1.2
Visualising property crime in Gauteng applying GIS to crime pattern theory
Alexandra HiropoulosI; Jeremy PorterII
IAlexandra Hiropoulos is a doctoral student at The Graduate Center, City University of New York (CUNY) and researcher at John Jay College of Criminal Justice, CUNY. ahiropoulos@jjay.cuny.edu
IIJeremy Porter is an associate professor, Brooklyn College and The Graduate Center, CUNY. JPorter@brooklyn.cuny.edu
ABSTRACT
While the high rate of crime in South Africa has received much international attention, mainly focused on violent crime, the vast majority of offences reported to the South African Police Service concern property and other non-violent offences. The present study explores the relationship between one of the most frequently reported property crimes (thefts out of motor vehicles) and the environment in which they occur, using Geographic Information Systems (GIS). Utilising the framework of crime pattern theory, crime generators and attractors are visually examined in order to determine whether they can explain concentrations of crime. We argue that when used in conjunction with relevant social theory aimed at the examination of the determinants of crime and criminality, GIS can be a powerful practical tool in the presentation of crime data.
The last three decades have seen a growing interest in the relationship between crime and place. This is illustrated by a considerable body of writings on the ecology of crime and the development of a new subfield in criminology called environmental criminology. Environmental criminology is a family of theories that share a common interest in criminal events and the immediate geographical/spatial context in which they occur. Researchers examine crime patterns and seek to understand and explain them in terms of environmental influences associated with these contexts.1 Most importantly, this perspective is interested in the occurrence of the crime itself, as opposed to other criminological theories that are concerned with criminality, that is, how biological, developmental and/or social factors influence a criminal offender.
The advancement of the environmental perspective has been assisted by the recent development of widely accessible computerised mapping and spatial analysis techniques. Most commonly, these mapping and spatial analytic techniques are carried out in Geographic Information Systems (GIS), which house, manage and represent spatial data in a way that can significantly improve the ability of researchers to look more closely at the spatial variations and geographic contexts of crime occurrence.2 Perhaps the most intriguing - and powerful - property of GIS is that it can be used as a visualisation and data management tool, within which the integration of data from a diverse set of sources can be synthesised into a single geo-referenced database, containing observations from proximate spatial locations. Researchers can represent spatial patterns and visualise them across locations, providing insight into potential spatial clustering, spatial heterogeneity and variations over time. The advancement of GIS technology now allows us to examine data more rigorously as a way of generating new hypotheses, testing existing hypotheses and identifying unexpected spatial patterns.3
Research on crime and place in the United States and elsewhere has benefited from these advancements. However, this has not been the case in South Africa where, until recently, spatial data on crime and place were not readily available to researchers. Fortunately this is changing, given the availability of more reliable census data and the improving access to crime data through the efforts of some of the country's non-governmental organisations. Research institutions such as the Institute for Security Studies (ISS) have made it a point to gather spatial data, including the data for the current study. Notably, South Africa's socio-political history makes it uniquely amenable to ecological analyses of crime due to the historical fragmentation of space, the segregation of state-defined population groups into certain spaces, and surveillance and control of those spaces by the former apartheid regime.4
The environmental perspective is based on three simple premises. The first is that the nature of the immediate environment significantly influences criminal behaviour. All behaviour is viewed as resulting from a person-situation interaction, and the environment plays a fundamental role in initiating crime and shaping its course. Secondly, the distribution of crime in time and space is not random. Crime is patterned according to the location of criminogenic environments and will therefore be concentrated around crime opportunities and other environmental features that facilitate criminal activity. Finally, the relationship between criminogenic environments and crime patterns can provide a valuable tool in preventing crime. Based on this reasoning, environmental criminologists argue that they are strategically positioned to provide practical solutions to crime problems.5 The provision of solutions, along with the guidance of police action, has become a major goal of environmental criminology. Its applied focus has attracted researchers, criminal justice agencies and crime prevention practitioners alike.
While proponents of the environmental perspective praise its practicality in reducing crime, many researchers critique aspects of the perspective. Their critique primarily revolves around the perspective's sole interest in criminal events, while disregarding traditional theories of crime concerned with criminal offenders. For example, Lee argues that the field of environmental criminology 'remains theoretically shallow and empirically narrow' and environmental theories 'are even more bereft of depth.6
It is important to consider these critiques as one contends with the potential policy implications that might result. We argue that when used in conjunction with relevant social theory aimed at the examination of the determinants of crime and criminality, GIS can be a powerful practical tool in the presentation of crime data. Here we move away from the theoretical limitations of environmental criminology and focus on the methodological practicality of exploring property crime through the use of GIS technology. Specifically, we use GIS in conjunction with crime pattern theory in Gauteng to visualise the spatial relationship between property crime rates and major crime attractors and generators. Although Gauteng is the smallest of South Africa's nine provinces, it is the most urbanised and populous7 and has been described as 'the home of crime' by former Police Commissioner General Bheki Cele, accounting for around half of the country's crime statistics.8
While South Africa's crime problem has received much international attention, most of it focused on violent crime, the vast majority of offences reported to the South African Police Service (SAPS) concern property and other non-violent offences.9,10 In fact, while violent crime has been decreasing over the past decade, property crime has been on the rise.11 Our study seeks to examine one of the most frequently reported property crimes, thefts out of motor vehicles, through the visualisation of spatial variations in the occurrence of the crime in relation to its local surroundings.
SPATIAL/LOCATIONAL FEATURES OF CRIME
Beginning in the 1800s, many theories have been developed in the West to explain the relationship between crime and place. The roots of these theories trace back to early positivists and social ecologists Guerry and Quetelet in France during the 19th century, who attempted to explain differences in community crime levels in terms of the varying social conditions of the resident population.12 In the early 20th century, ecological research on crime increased with the influential sociological tradition emerging from the Chicago School, which argued that we cannot understand social life without understanding the arrangements of particular social actors in particular social times and places.13 Most influential was Shaw and McKay's work on delinquency in Chicago.14 Their findings regarding the stability of delinquency over time within certain neighbourhoods, as well as the negative relationship between crime and distance from central business districts, gave rise to the social disorganisation theory of crime.15
The tradition of the Chicago School has seen a revival in contemporary ecological studies of crime, and its methodological and theoretical underpinnings have advanced with the assistance of GIS. For example, spatial data have been utilised to study social disorganisation in areas ranging from suburban Texas16 to parts of Utrecht, Netherlands.17
The identification of crime hot spots by Brantingham and Brantingham in the 1980s provided a turning point in refocusing attention to spatial/locational features of crime.18 During this time, the prevailing emphasis in the UK and US on treatment and changing criminals or their environment was widely seen not to work. This led to a focus on small-scale situational crime prevention schemes, based on notions of rational choice and intended to reduce opportunities to offend.19
Though there is no common definition of hot spots, it is collectively understood that 'a hot spot is an area that has a greater than average number of criminal or disorder events, or an area where people have a higher than average risk of victimisation'.20 They are usually smaller than neighbourhoods and comprise block or street segments that experience inordinately high levels of crime. Hot spots show the potential value of place in the analysis of crime, and studies have found a relationship between crime hot spots and certain land uses and population characteristics.21
CRIME PATTERN THEORY
Ever since Shaw and McKay published their work on persistent concentrations of deviancy in the 1940s, many explanations of differences in neighbourhood crime levels have been proposed. The size of the geographic area of crime is pertinent.22 Since different theories of crime explain crime at different levels of analysis, the choice of theory is dependent on the type of problem being mapped. Three levels of analysis have been identified: macro, meso, and micro.23 Ultimately, the level at which one examines crime is dictated by the questions one asks, which will in turn determine the usefulness of the results. Theories of crime can only be useful in guiding crime mapping if an appropriate theory for the level of analysis is selected.24
The theories most appropriate for the meso level of analysis are neighbourhood theories of crime. Meso-level analysis is rooted in the Chicago school and involves the study of crime within the sub-areas of a city or metropolis. These areas represent intermediate levels of spatial aggregation and may range from suburbs and police districts down to individual streets and addresses.25 Neighbourhood theories such as crime pattern theory (CPT) deal with large areas, including square blocks, communities and census tracts, and are most appropriate for the present study because we examine property crime at the precinct level. Hot spots - that is, neighbourhood concentrations of property crime - are examined in order to discover whether neighbourhoods within Gauteng have significant property crime problems or not.26
CPT is highly compatible with data visualisation through GIS. Given that our goal is to visualise the relationship between the occurrence of crime and the locations in which they occur, CPT is a useful framework from which to begin. More specifically, CPT seeks to explain neighbourhood-level hot spots by investigating the way that offenders seek and find opportunities for crime in the course of their everyday lives.27 The theory combines elements from rational choice28 and routine activity theory29 to help explain the distribution of crime across spaces, and argues that it is the interactions of offenders with their physical and social environments that influence their choice of targets.30
Three main concepts are included in CPT: nodes, paths and edges. Nodes refer to where people travel to and from. Paths refer to the actual paths that people take to and from their personal activity nodes such as home, school and entertainment areas, and edges refer to the boundaries of areas where people live, work, shop, or seek entertainment. In our research we examine 'major nodes' or physical locations that are major points of interest within Gauteng. We also pull out a subset of this group and examine crime in relation to shopping centres, which are spatially represented as nodes; and we visually inspect the relationship between the occurrence of crime and access via streets, which are visualised as lines.
The rationale of CPT is that offenders follow similar spatial-temporal movement patterns to everyone else and operate within their own awareness space - the set of normal paths within the visual range of the offender. While engaging in their routine activities, reasonably rational offenders will note places without guardians and managers. Crime occurs in areas where the awareness space of the offender transacts with suitable targets. Individuals are likely to commit their initial crimes near their learned paths or the activity nodes of their friendship network, and crimes are likely to cluster near these activity spaces, with a higher concentration near the activity nodes. Therefore, places with routine activities and situational precipitators, located along the routes offenders travel, will be more likely to be subject to criminal activities.31
CPT is based on the premise that crimes do not occur randomly or uniformly in time and space. There are patterns to where criminal activity occurs. How targets come to the attention of offenders influences the distribution of crime events over time and space, as well as among targets. Central to the explanation of the concentration of crime at certain locations are the concepts of crime generators and crime attractors. Crime generators are places that attract large numbers of people for reasons unrelated to criminal motivation, such as shopping areas, office buildings or sports stadiums. They can produce crime by creating particular times and places that provide appropriate concentrations of people and other targets, in settings that are conducive to criminal acts. Potential offenders may notice and exploit criminal opportunities as presented. Crime attractors are places affording criminal opportunities that are well known to offenders. These facilities have potential victims congregate near or inside of them, or may themselves be vulnerable to criminal penetration, such as bars, parking lots, or large shopping malls, particularly those near major public transit exchanges. Offenders with criminal intent are attracted to these places because of the known opportunities for particular types of crime, and they may become activity nodes for repeat offenders.32
In our research these contexts are largely unknown, and provide us with an opportunity to explore crime occurrence across any number of intersections and with any number of approaches. Moreover, ecological theories of crime, such as CPT, have not been assessed to explain property crime in South Africa. Our research is therefore exploratory in the sense that it aims to visualise patterns of crime in relation to potential crime attractors and generators. It is our intention that these exploratory results can begin to contribute to the building of a knowledge base associated with the ecological examination of crime in South Africa.
METHODOLOGY
With the use of newly available data, this research explores the relationship between property crimes and the environment in which they occur. More specifically, the study seeks to answer the following questions: Are thefts out of motor vehicles concentrated in specific neighbourhoods? In other words, are there hot spots of this type of property crime? Secondly, what is the nature of the immediate environment surrounding thefts out of motor vehicles? Thirdly, is this type of property crime concentrated around the location of criminogenic environments exemplified by crime generators and crime attractors? Finally, can the environmental perspective provide practical and appropriate solutions to the problem of thefts out of motor vehicles? This last, and more theoretical, question is given most attention in the final section of the article.
Data and measures
Data for the present project were obtained from the Governance, Crime and Justice Division of the ISS. Recently, the Governance, Crime and Justice Division began geocoding annual statistics for 29 different crime categories for all 1 118 police station precincts in South Africa between 2003 and 2013, as well as approximately 150 demographic and other variables. All data used were in the form of ESRI Shape Files.
The dependent variable, thefts from vehicles, was originally obtained from the SAPS. Crime statistics are released by SAPS in an aggregated form as a crime count per police station boundary. The crime data are aggregate counts that represent the number of thefts out of motor vehicles within police precincts. Demographic and other variables can be overlaid on top of these areas, which each contain a single police station. In order to take the population distribution into account, the rate of thefts out of motor vehicles is calculated per 10 000 members of the population.
The spatial distribution of thefts out of motor vehicles will be examined independently and in conjunction with the components of crime pattern theory. In order to examine the environment surrounding this type of property crime, we utilised a number of independent variables that are considered crime generators and/or crime attractors, specifically shopping centres, major roads, and major nodes (including retail and industrial nodes and central business districts) in Gauteng.
Analytic techniques
A descriptive and exploratory examination of individual variables was conducted in order to answer the above research questions. This examination was both statistical and spatial in nature, and yielded a series of useful information concerning the utility of GIS in the visualisation of crime data within the environmental criminology framework.
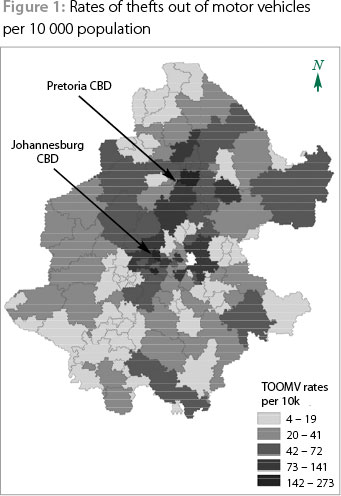
Firstly, a map of theft out of motor vehicle rates was created in ArcGIS 10.0 by calculating the rate of thefts out of motor vehicles per 10 000 members of the population. The map is based on quantile classifications, a method that arranges all observations from low to high and assigns equal numbers of observations to each classification category. In other words, it sorts crime cases into groups with equal numbers of cases in each group. This approach is useful when there is a need to highlight a proportion of the observations.33
In order to facilitate a more rigorous analysis of spatial patterns, exploratory spatial data analysis procedures (ESDA) were used. A central feature of ESDA is the use of formal statistical tests to determine whether crime locations show evidence of clustering, or are randomly distributed.34 The present study utilised the GeoDa software application for ESDA and made use of its functions of spatial data manipulation and utilities, data transformation, mapping, exploratory data analysis and spatial autocorrelation.
GeoDa provides several statistical applications for conducting exploratory data analysis. In order to test for evidence of crime event clustering (i.e. whether thefts from vehicles tend to be concentrated in specific neighbourhoods), the Moran's I spatial autocorrelation technique was utilised. Spatial autocorrelation techniques test whether the distributions of point events are related to each other. The Moran's I statistic works by comparing the value at any one location with the value at all other locations. Moran's I requires an intensity value for each aggregate unit, which is then assigned an intensity value (in this case, the rate of thefts out of motor vehicles within a police precinct). The Moran's I result varies between -1.0 and +1.0, with a positive coefficient indicating that places close together are statistically more alike, a negative coefficient that places close together tend to be dissimilar to one another, and a coefficient of approximately zero, indicating that the attribute values are randomly spread over space. Where aggregate units that are close together have similar values, the Moran's I result is high, indicating spatial clustering of high values (hot spots), low values (cold spots), and medium values.35
The assessment of global spatial autocorrelation, however, needs to also be supplemented by local measures of spatial dependence. In contrast to a global statistic such as the Moran's I (which is a single number or graph that indicates whether the null hypothesis of spatial randomness is satisfied for the complete map), a local statistic is designed to detect specific locations of elevated counts or rates.36 Such measures can help us identify statistically significant, independent clusters of thefts out of motor vehicles. Local indicators of spatial association (LISA) statistics were used to assess the local association between data by comparing local averages to global averages.37 These can be used to identify significant patterns of spatial association around individual locations such as hot spots, and can assess the extent to which the global pattern of spatial association is spread uniformly throughout the data or whether there are significant types of locations affecting the computation of Moran's I.38 LISA statistics are therefore useful in adding definition to crime hot spots and placing a spatial limit on those areas of highest crime event concentration.
In keeping with the framework of crime pattern theory, the study also sought to examine the surrounding locations of hot spots of thefts out of motor vehicles. With the use of ArcGIS 10.0, crime generators and attractors were overlaid on top of the map of significant clusters in order to visually inspect whether the environments surrounding hot spots are criminogenic.
RESULTS
Figure 1 displays the rates of thefts out of motor vehicles per 10 000 members of the population. A visual inspection of the map identified several spatial clusters that experience high and low rates of property crime.
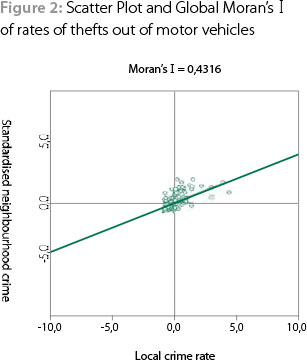
Results from the Moran's I spatial autocorrelation technique can be seen in Figure 2. The Moran's I statistic is easily visualised in a graph called a Moran scatter plot. The four quadrants in the Moran scatter plot in Figure 2 identify four types of spatial association between a location and its neighbours. Quadrants I (upper right) and III (lower left) indicate a positive spatial association. In Quadrant I, a location with an above-average value is surrounded by neighbours whose values are also above average (high-high). In Quadrant III, a location with a below-average value is surrounded by neighbours whose values are also below average (low-low). Quadrants IV and II indicate a negative spatial association. In Quadrant IV, a location with an above-average value is surrounded by neighbours with below-average values (high-low) and in Quadrant II, a location with a below-average value is surrounded by neighbours with above-average values (high-low). The slope of the regression line in the scatter plot is the global Moran's I. The global Moran's I for thefts out of motor vehicles is 0.431, indicating positive spatial autocorrelation across crime event counts.
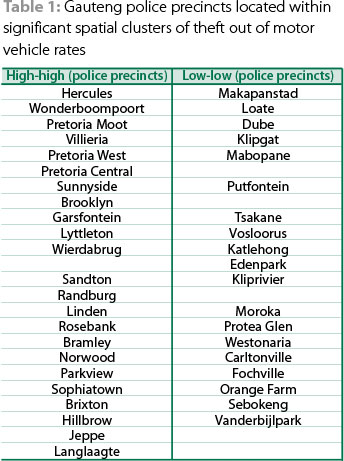
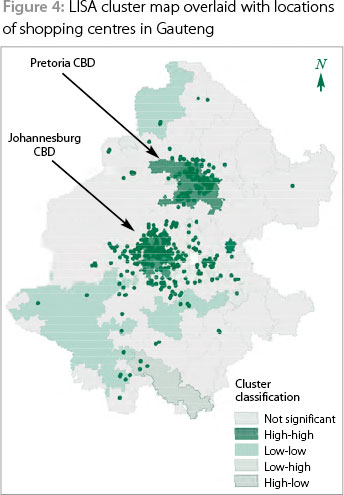
Since the null hypothesis of spatial randomness was sufficiently rejected and evidence for overall clustering was found, LISA statistics provided information about the nature of the clusters (high or low values) and their location. Figure 3 illustrates the LISA cluster map for rates of thefts out of motor vehicles. The cluster map shows the four types of local spatial autocorrelation (high-high, low-low, high-low, low-high) for those precincts with a significant local Moran statistic. The dark green shaded areas correspond to clusters of police precincts that experience high rates of thefts out of motor vehicles, and the light green shaded areas correspond to clusters of precincts that experience low rates of thefts out of motor vehicles. These precincts have been listed in Table 1. From this map we can statistically determine the precincts that are hot spots for thefts out of motor vehicles, as well as the precincts that experience considerably fewer thefts out of motor vehicles than would be expected if this type of property crime were randomly distributed across the province. However, even though the LISA cluster map suggests interesting locations, it does not provide a way to explain why the patterns occur where they do.39 In order to determine whether the surrounding environments are criminogenic, crime generators and attractors (shopping centres, major roads and major nodes, including retail and industrial nodes and central business districts) were overlaid on top of the LISA map of significant clusters. Figure 4 displays the LISA cluster map with the locations of shopping centres in Gauteng overlaid on top. Shopping centres can be both crime generators and attractors. A visual inspection of the map clearly shows that the majority of shopping centres in Gauteng are located in significant clusters of high rates of thefts out of motor vehicles. The precincts within these clusters are significantly more likely to neighbour a precinct that also experiences high rates of property crime. Few shopping centres are located in other areas of Gauteng, including clusters with low rates of thefts out of motor vehicles, and areas where property crime was found not to be related to its location.

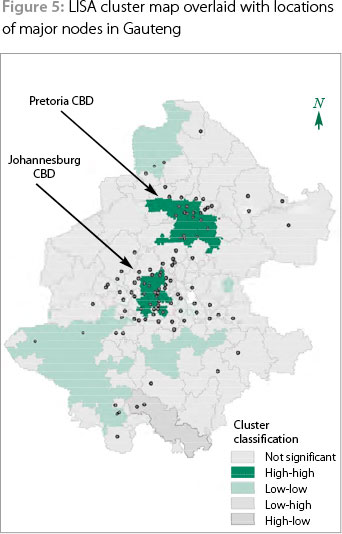
Major nodes can also be both crime generators and attractors. The major nodes included in the study were retail and industrial nodes and central business districts within Gauteng. Figure 5 displays the LISA cluster map with the locations of major nodes overlaid on top. A visual inspection of the map shows that most of the major nodes in the province are located in clusters with high rates of thefts out of motor vehicles. These are especially located in the central business districts of Gauteng.
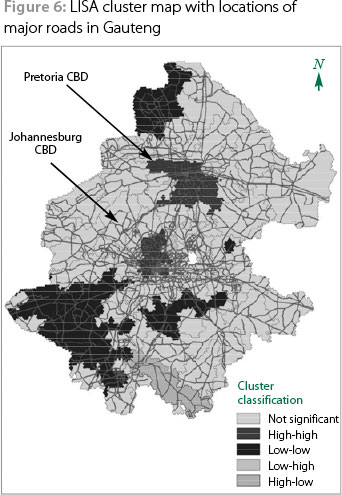
Finally, major roads are considered crime attractors because they are well known to offenders as easy routes for movement into and out of the area, while victims also tend to use these roads for ease of movement. Where the density of roads is high, one might assume that property crime is generated due to access points into and out of areas with high numbers of potential crime targets. In order to inspect whether major roads could be attracting thefts out of motor vehicles, Gauteng's major roads were overlaid on the LISA map of significant clusters experiencing high rates of this type of property crime (see Figure 6). Not surprisingly, the major hubs of these roads are located in clusters that experience high rates of thefts out of motor vehicles.
DISCUSSION
The present study found that place does matter, and that the visualisation of crime can be descriptively linked to the physical location of crime attractors and generators within the framework of CPT. Thefts out of motor vehicles were found to be concentrated in specific precincts in Gauteng and did not occur randomly or uniformly in space. Indeed, significant patterns of criminal activity were found, including precincts with significant clusters (hot spots) of thefts out of motor vehicles, as well as precincts that experienced considerably fewer thefts from vehicles than would be expected if crime were randomly distributed across precincts. The precincts within significant clusters of high rates of property crime were predominantly located in and around the central business districts of Gauteng. In this way, the study aims to contribute to a better understanding of the nature of property crime in the province of Gauteng, South Africa. Though the limitations of environmental criminology remain, we find evidence of the practicality associated with examining such a framework within the confines of a GIS.
Though the examination of crime generators and attractors was based on descriptive analyses, our findings show that CPT can provide a useful framework for explaining neighbourhood-level hot spots, due to its focus on the way that offenders seek and find opportunities for crime in the course of their everyday lives. Most of the shopping centres and major retail and industrial nodes in Gauteng are located in areas that experience high rates of thefts out of motor vehicles, mainly in the central business districts of the province. If crime mainly occurs in areas where the awareness space of the offender transacts with suitable targets, as crime pattern theory purports, this is not a surprising finding.
Hot spots of thefts out of motor vehicles were also found in locations with major roads running through them. Major roads, like shopping centres and major nodes, can be crime attractors, because they afford criminal opportunities that are well known to offenders. Since individuals are likely to commit crimes near their learned paths or activity nodes, and crimes are likely to cluster near these activity spaces, facilities along these activity nodes may themselves be vulnerable to criminal activity, as was the case in the present study. The present findings are therefore in agreement with Brantingham and Brantingham's commonsensical assertion that places with routine activities and situational precipitators located along the routes offenders travel, or near nodes that offenders frequent, are more likely to be subject to criminal activities.40
While indicative of the utility of such an approach, our study does have limitations. One such limitation could be the use of population counts as a denominator for calculating rates of property crime. This approach may create hot spot mapping output that misleads by exaggerating the crime problem in town centres that have few residents but a concentration of thefts out of motor vehicles. Ideally, it is preferable to use denominators that are directly relevant to the crime type for which a rate is created. In the present case, this would have been vehicle counts. However, such data were unavailable.
A further caveat could be the limitation to stationary information on crime and location. Though we found that place matters, social and spatial processes within places are non-stationary, and criminal activity can also be affected by variations in demographics, the built environment, economics and other social aspects that change across space and time. This point is especially relevant to South Africa, where urban space is drastically changing. Currently South Africa is characterised by great population mobility, increasing income inequality, multi-ethnicity, racial and ethnic segregation as well as family disruption.41 While these changing social geographies of urban South Africa provide a unique ecological platform to hypothesise about crime, they also place limitations on the sole use of the environmental perspective, which does not spend much time focusing on these characteristics to explain crime but instead on the physical layout and proximate locations of crime.
As noted above, in addition to aiding scholars in their pursuit to understand why crime is concentrated in certain neighbourhoods, the identification of crime hot spots may play an important role in the development of strategies to combat crime.42 If offenders are concentrated at a few places rather than mobile throughout an area, efforts to deter them should occur at this level. Findings from the present study could therefore contribute to recommendations for proper methods of combating this type of crime in Gauteng. However, it is important that the findings from this project are interpreted in the context of exploratory research, and any policy applications built upon the integration of social theory in their interpretation.
Recommendations that attempt to provide solutions to this crime problem and guide police action must be informed by an understanding of relevant social theory pertaining to the neighbourhood, and social conditions that exist in these spatial locations. Future research should build upon these findings in order to make them useful in practice. To that point, the present project was a first attempt at examining the relationship between property crime and space in South Africa. With the availability of newly developed data sets of spatial crime, demographic and socio-economic information, this is only the beginning of empirical research examining the spatial dimension of crime in South Africa. This could include investigations of factors associated with crime areas, such as unemployment, income, urbanisation rates and education levels.
NOTES
1. R Wortley and L Mazerolle, Environmental criminology and crime analysis, Oregon: Willan Publishing, 2008, 1-18. [ Links ]
2. L Anselin, J Cohen, D Cook et al, Spatial analyses of crime, in D Duffee (ed), Measurement and analysis of crime and justice, Washington, DC: National Institute of Justice, 2000, 213-262. [ Links ]
3. J G Cameron and M Leitner, Spatial analysis tools for identifying hot spots, in J E Eck, S Chainey, J G Cameron et al (eds), Mapping crime: understanding hotspots, Washington, DC: National Institute of Justice, 2005, 35-60. [ Links ]
4. M O'Donovan, Crime, poverty and inequality in South Africa: what the data shows, Conference report, National and international perspectives on crime and policing: towards a coherent strategy for crime reduction in South Africa and beyond, Institute for Security Studies, 2011. For a fuller discussion of the spatial aspects of crime in South Africa, see M Shaw and A Louw, Environmental design for safer communities: preventing crime in South Africa's cities and towns, Institute for Security Studies Monograph, 24, May 1998. Also see Safer by design: towards effective crime prevention through environmental design in South Africa, Institute for Security Studies Monograph, 16, November 1997.
5. Wortley and Mazerolle, Environmental criminology and crime analysis .
6. M Lee, Against environmental criminology: designing out crime and the death of utopian visions, Conference report, The Annual Conference of The Australian Sociological Association, 2009, 5-6.
7. Statistics South Africa, Census 2011, Statistical release P0301.4, http://www.statssa.gov.za/publications/P03014/P030142011.pdf (accessed 15 February 2014).
8. Gauteng is South Africa's home of crime, news24, 30 March 2011, http://www.news24.com/SouthAfrica/News/Gauteng-is-SAs-home-of-crime-Cele-20110330 ( accessed 10 March 2014).
9. O'Donovan, Crime, poverty and inequality in South Africa.
10. The use of such statistics must be made with the understanding of reliability limitations. For instance, property crime is more likely to be re ported by those with insurance cover age who would need a police report to make an insurance claim. However, property crime occurrences remain an important focus of the SAPS.
11. C Gould, J Burger and G Newham, The SAPS crime statistics. What they tell us - and what they don't, South African Crime Quarterly 42 (2012), 3-12. [ Links ]
12. Anselin et al, Spatial analyses of crime.
13. A Abbott, Chicago school: social change, in G Ritzer (ed), The Blackwell encyclopedia of sociology, v 2, Oxford: Blackwell, 445-448. [ Links ]
14. C Shaw and H D Mc Kay, Juvenile delinquency in urban areas, Illinois: University of Chicago Press, 1942. [ Links ]
15. Anselin et al, Spatial analyses of crime.
16. S Roh and T Choo, Looking inside zone V: testing social disorganisation theory in suburban areas , Western Criminology Review 9(1) (2008), 1-16. [ Links ]
17. W Steenbeek and J R Hipp, A longitudinal test of social disorganisation theory: feedback effects among social cohesion, social control, and disorder, Criminology 49(3) (2011), 833-871. [ Links ]
18. P Brantingham and P Brantingham, Mobility, notoriety, and crime: a study of crime patterns in urban nodal points, Journal of Environmental Systems 11 (1982), 89-99. [ Links ]
19. R H Burke, An introduction to criminological theory, Oregon: Willan Publishing, 2003. [ Links ]
20. J E Eck, S Chainey, J G Cameron et al (eds), Mapping crime: understanding hotspots.
21 . L Anselin, E Griffiths and G Tita, Crime mapping and hot spot analysis, in R Wortley and L Mazerolle (eds ) , Environmental criminology and crime analy sis, Oregon: Willan Publishing, 2008, 97-116. Also see L W Sherman, P R Gartin and M E Buerger, Hot spots of predatory crime: routine activities and the criminology of place, Criminology 27 (1989), 27-55; D W Roncek and P A Maier, Bars, blocks, and crimes revisited: linking the theory of routine activities to the empiricism of hot spots, Criminology 29 (1991), 725-755; J Cohen, W Gorr and A Olli gschlaeger, Modeling street - level illicit drug markets, Working paper 93-64, Pittsburgh: The H John Heinz III School of Public Policy and Management, Carnegie Mellon University, 1993; E Gracia, A Lopez- Quilez, M Marco et al, Exploring neighborhood influences on small-area variations in intimate partner violence risk: a Bayesian random- effects modeling approach, International Journal of Environmental Research and Public Health 11(1) (2014), 866-882; A J Snowden and W A Pridemore, Alcohol outlets, social disorganization , land use, and violence in a large college town: direct and moderating effects, Criminal Justice Review 38(1) (2013), 29-49; and D D Weisburd, N A Morris and E R Groff, Hot spots of juvenile crime: a longitudinal study of arrest incidents at street segments in Seattle, Washington, Journal of Quantitative Criminology 25(4) (2009), 443-467.
22. Eck et al, Mapping crime: understanding hotspots.
23. For a more detailed discussion of the different levels of analysis see Wortley and Mazerolle, Environmental criminology and crime analysis.
24. Eck et al, Mapping crime: understanding hotspots.
25. Wortley and Mazerolle, Environmental criminology and crime analysis .
26. See R V Clarke, Situational crime prevention: Successful case studies, 2nd ed, NY: Criminal Justice Press, 1997; also see R V Clarke and D Cornish , Modelling offenders' decisions: a framework for research and policy, in M Tonry and N Morris (eds), Crime and justice: an annual review of research , vol 6, Chicago: University of Chicago Press, 1985.
27. P Brantingham and P Brantingham, Crime pattern theory, in R Wortley and L Mazerolle (eds), Environmental criminology and crime analysis, Oregon: Willan Publishing, 2008, 78-94. [ Links ]
28. See D Cornish and R V Clarke, Analyzing organized crimes, in A R Piquero and S G Tibbetts (eds), Rational choice and criminal behavior: recent research and future challenges, New York: Routledge, 2002, 4163. [ Links ]
29. See M Felson, Crime and everyday life: insight and implications for society, CA: Pine Forge Press, 1994; also see R V Clarke, Situational crime prevention: successful case studies, 2nd ed, New York: Harrow and Heston, 1997.
30. M Felson and R V Clarke, Opportunity makes the thief, Police Research Series, Paper 98, London: Home Office, 1998. [ Links ]
31. Brantingham and Brantingham, Crime pattern theory.
32. Ibid.
33. Cameron and Leitner, Spatial analysis tools for identifying hot spots.
34. Ibid.
35. Eck et al, Mapping crime: understanding hotspots.
36. Anselin et al, Crime mapping and hot spot analysis .
37. Eck et al, Mapping crime: understanding hotspots.
38. Cameron and Leitner, Spatial analysis tools for identifying hot spots .
39. Anselin et al, Crime mapping and hot spot analysis .
40. Brantingham and Brantingham, Crime pattern theory.
41. G D Breetzke and A C Horn, Key requirements in the development of a spatial - ecological theory of crime in South Africa, South African Journal of Criminology 21(1) (2008), 123-143. [ Links ]
42. Anselin et al, Crime mapping and hot spot analysis.

