


Services on Demand
Article
 English (pdf)
 Article in xml format
 Article references
Indicators

Related links
-
 Cited by Google
 -
 Similars in Google
Share

 Permalink
SAIEE Africa Research Journal
On-line version ISSN 1991-1696
Print version ISSN 0038-2221
SAIEE ARJ vol.114 n.3 Observatory, Johannesburg Sep. 2023
A Cost-sensitive Technique to Pre-characterize UHF Antennas at Tertiary Education Institutions
Casey J. BryantI; P. Gideon WiidII
IPost graduate student at the Cape Peninsula University of Technology, in the Department Electrical, Electronic and Computer Engineering at the Bellville Campus, Cape Town 7535 (e-mail: bryant.casey1@gmail.com)
IISenior Member, IEEE; Radar and Remote Sensing Group in the Electrical Engineering Department of the University of Cape Town (UCT), Rondebosch, 7700, South Africa (e-mail: gideon.wiid@uct.ac.za)
ABSTRACT
This article describes an antenna characterization measurement technique that can be achieved using low-cost equipment on a sports field. It is an adaptation of a reflection range measurement and results were compared to control measurements done at an open-area-test-site as well as in an anechoic chamber. This technique was capable of obtaining results with accuracy to within 2 dB for boresight gain and within 2 dB for the main beam of the antenna pattern. Its purpose is not to be highly accurate, but rather to show that it is possible to cost-sensitively introduce students to radio frequency equipment, as well as have access to a pre-characterization test method for inhouse, student-built antennas at tertiary education institutions.
Open License: CC-BY
Index Terms: Antenna characterization, cost-sensitive, education, measurements, UHF.
I. INTRODUCTION
WITH the drive for the fourth industrial revolution there has been an exponential increase in wireless devices, from wallets to cars, everything appears to be going wireless. These wireless systems all require well-built antennas allowing for optimal connectivity [1]. Academics wanting to get into the field of electromagnetics and antennas have a difficult time gaining hands-on experience due to the expensive equipment and dedicated testing facilities required. These facilities, such as an open area test site (OATS), anechoic chamber or a reflection range can be costly to build and maintain for something as niche as antenna testing [2, 3]. The required equipment cost is also too high for many universities [4] and those that can afford the equipment often do not allow unsupervised use of the equipment. This means that students seldom become comfortable or experienced with these devices.
Some of the basic antenna characteristics that would be beneficial for students to obtain measurement experience in, are input impedance, gain and gain pattern measurements. This can be done by using a vector network analyzer (VNA), a few radio frequency (RF) cables and connectors along with a rotatable tripod [1, 2, 5]. To achieve quality, repeatable results, a well defined range that promotes a free-space response is ideal. This is achieved by ensuring a low level of background interference and mitigating any reflections arriving at the receive antenna [6].
The following section outlines the required equipment and the proposed site to be used for cost-sensitive testing. Section III shows the measurement design, and Section IV the results along with a filtering method to smooth the data and remove horizontally polarized reflections in Section V. The cost for the required equipment is covered in Section VI with the paper being concluded in Section VII.
II. ANTENNA TEST EQUIPMENT
This section introduces the cost-effective equipment that was used in testing, as well as the specific antennas that were tested.
A. Vector network analyzers
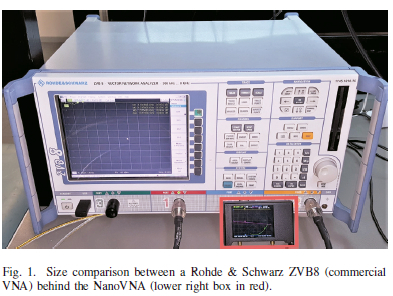
The VNA is considered in [7] to be the most complex and versatile piece of test equipment that an RF engineer can use. This high-precision device is used to measure the frequency response of a device under test (DUT) across a configured frequency range. It does this by transmitting a specific frequency signal at one port, while monitoring for the same frequency, reflected or transmitted, at both its ports [8]. This transmit and receive signal is swept across a selected frequency band and set number of points. A NanoVNA («$300) [9] was made available to the authors to test and compare to a commercial VNA («$80000), both pictured in Fig. 1. The NanoVNA has a frequency range of 50 kHz to 4.4 GHz at a system dynamic range of 90 dB (calibrated) [10]. This battery powered device can be operated via its touchscreen with 201 points, or computer software (via USB) with 1024 points. It has a sweep time of under 0.3 seconds. All these factors make it an ideal device for class-room level measurements up to 4.4 GHz.
B. Antenna under test
Log periodic array antennas were first discussed in the 1950s by Duhamel and Isbel [11]. Isbel then explored the use of dipoles in these arrays [12], forming today's well known log periodic dipole arrays (LPDA). Kibona [13] describes this type of antenna as "a broadband, multi element, directional narrow-beam antenna that has impedance and radiation characteristics that are regularly repetitive as a logarithmic function of the excitation frequency". This makes the LPDA antenna suitable for ultra high frequency (UHF) testing, as one antenna could cover the entire UHF (300 MHz to 3 GHz) band.
The antenna used for testing was A-INFO's DS-18300 which is a 22-element LPDA with a specified frequency range of 180 MHz to 3 GHz [14].
C. Non-conducting tripods
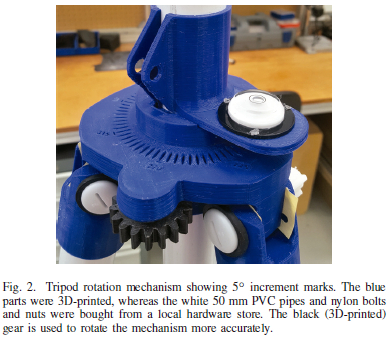
One important aspect to consider with antenna testing, is that parasitic coupling and detuning effects can occur when an antenna is operated near metallic objects. It is, therefore, good practice to ensure that there are no reflecting or conducting materials near the antenna under test (AUT). For this reason, a simple, rotatable, RF transparent, low-cost tripod was designed in-house to hold the antennas. It was made from 3D-printed parts and 50 mm PVC piping. It could reach a height of 3 meters and allowed for easy rotation with markers as seen in Fig. 2. The total cost for both tripods was less than $80. All the necessary equipment was then ready to conduct a two-antenna method measurement.
III. MEASUREMENT SYSTEM DESIGN
The two-antenna method [15] makes use of two identical antennas. If students (or engineers) manufacture two identical antennas of the same design, it allows for use of this simpler two-antenna method as opposed to the three-antenna method. The equation for the two-antenna method is derived from the Friis free-space transmission equation in [16].
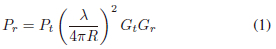
Where Pr is the receive power, Pt is the transmit power, A is the wavelength, R is the separation distance between transmit and receive antenna, and Gt & Gr is the gain of the transmit and receive antennas respectively.
When using two identical antennas, Gt = Gr = G, simplifying (1) and solving for G gives the following:
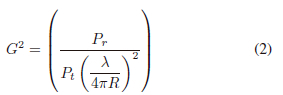
Where  = |s21|2 (and S21 is the linear transmission parameter) allowing (2) to be rewritten to decibel (dB) form as:
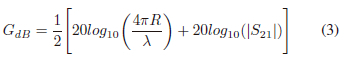
Equation (3) is used to calculate the gain in dB from the VNA measured linear S2i parameters.
A. Antenna range
When researching how to make antenna measurements, antenna ranges such as OATS, anechoic chambers and reflection ranges are referred to as a basic requirement for standardized, accurate results [2, 17, 18]. However, these ranges cost large sums of money to build and maintain. Although an indoor laboratory measurement could be used to give rough estimates, the multitude of reflections and loading of the antenna make these measurements unreliable and unrepeatable. If an institution does not have a facility available, students need to make alternative plans to accurately test their antenna designs. This usually consists of using third party test locations which could have a daily rental rate, and likely require travel. Although this is a requirement for commercial applications, pre-compliance measurements and measurements at classroom level do not require such a high level of accuracy.
This work therefore proposes using a sports field as a modified reflection range to allow cost-sensitive measurements at most tertiary education institutes. This allows students to get a better understanding of electromagnetic fields and antenna measurement techniques at their own institution.
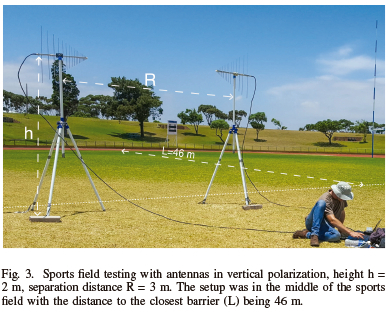
The sports field that was used is situated at the Cape Peninsula University of Technology's (CPUT's) Bellville campus. The field is recessed into the ground, creating a soil berm around the field as can be seen in Fig. 3. This soil berm likely introduces attenuation effects by means of diffraction and reflection [19].
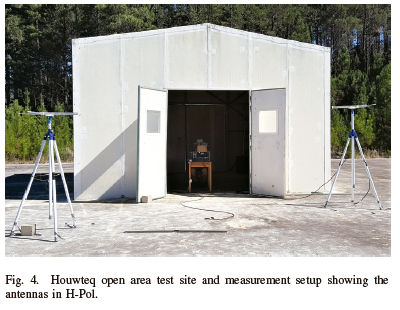
To test the accuracy of the NanoVNA and get preliminary measurements in a more controlled environment, device comparison tests were first done at the Houwteq-Spaceteq commercial OATS of the Denel Group [20] near Grabouw in the Western Cape of South Africa.
B. Measurement Device Comparison
To verify the accuracy of the proposed low-cost VNA, measurements were made on the OATS (Fig. 4) to compare to a commercial VNA. This site consists of a 30 x 25 meter metallic ground plane which aids in measurement repeatability. Measurements were made with both the NanoVNA and the Rohde & Schwarz ZVB8 instrument. Two identical LPDA antennas were placed on tripods and boresighted at a height of 2 m and R = 3 and 5 meters. Although this separation distance (R) does not meet the far-field criterion of «15 m, the method in [15] was used and accurate results were proven to be valid for 3 m. Another factor that played a role was the length of the available cables being only 5 m each. The result for the NanoVNA and ZVB8's S11 and S21 measurements are within less than half a dB across the 180 MHz to 3 GHz range over 601 points as shown in Figs. 5 and 6.
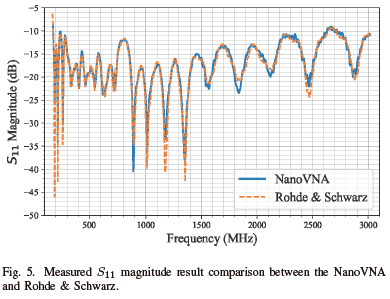
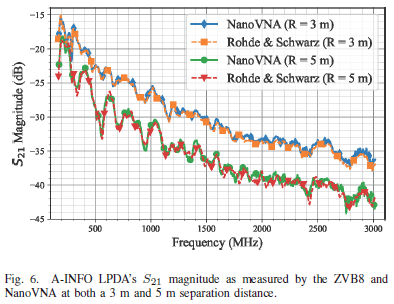
The ZVB8 reflection coefficient plot shows deeper resonant points at certain frequencies, due to the high-quality calibration kit and better dynamic range capabilities of this device. The transmission (S21) plot shows indistinguishable results for the R = 3 and 5 meter separation distances.
Considering these factors, the results show that for this type of measurement, at a fraction of the cost, a reflection and transmission measurement can be made with sufficient accuracy using a «$300 device.
Having confirmed that the accuracy of the NanoVNA is sufficient, the following section will discuss a baseline measurement made in an anechoic chamber and the measurements made on the sports field.
C. Anechoic chamber measurement setup
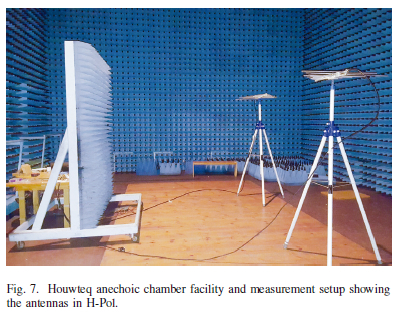
An opportunity to make comparative measurements in Houwteq's anechoic chamber [20], seen in Fig. 7 allowed for a control measurement against which the sports field result could be compared. This chamber is a fully-anechoic room with radar absorbing material (RAM) under the wooden floor. It should be noted that reflections off the wooden floor were experienced with the antennas in horizontal polarization (H-Pol). These reflections can be reduced by placing RAM between the AUTs.
D. Sports field measurement setup
With the anechoic chamber control measurement results available, the sports field measurement could be set up next. Setup considerations included pointing the transmit antenna away from any metallic surfaces, with the receive antenna rotating in the direction of least possible reflections. Fig. 3 shows the measurement setup using the middle of the field to ensure all large reflection planes (except the ground plane) was over 45 m away. This implies that any reflected waves would travel more than 90 m and be sufficiently attenuated compared to the 3 m separation. Calibrating the NanoVNA with a short, open, load, and through (transmission reflection calibration) to the end of the cables allowed the reference plane to be right at the antenna connector. Boresighting the antennas at a height of 2 m, a measurement was taken. The receive antenna was then rotated in 5 degree increments up to 180°. Due to the near-symmetry design of the LPDA, these results were then mirrored to create the 360° polar patterns.
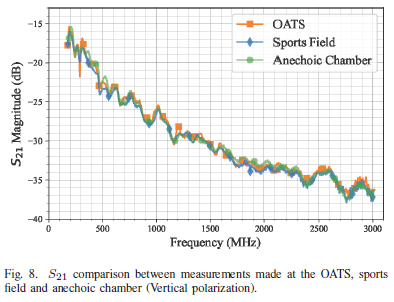
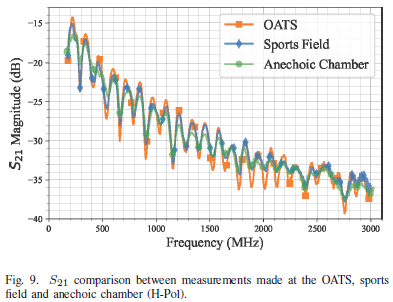
Fig. 8 shows strong agreement between the OATS, sports field and anechoic chamber transmission parameter magnitude as measured in vertical polarization (V-Pol). Fig. 9 shows the H-Pol transmission response for the different ground plane reflections. It can be noted that they follow a similar trend, however, due to less reflections off the wooden floor in the anechoic chamber, it varies less than the sports field and OATS. The values from these plots will be used to calculate the realized gain of the antenna. This will be done only for the V-Pol as the H-Pol has large variations due to the ground reflection, making the reflected and direct wave arrive in- and out-of-phase at the receive antenna. This causes up to a 6 dB magnitude peak and trough when adding perfectly in/out of phase. Due to the better reflection of the OATS, this variation is more severe for that measurement than on the sports field or in the anechoic chamber.
IV. RESULTS
Having made all the required comparative measurements, the results will be discussed next.
A. Gain comparison
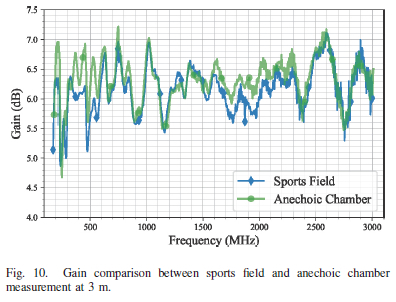
With the VNA measured S21 magnitude and knowing the separation distance R, the boresight realized gain for the antennas can be calculated using (3) and is plotted against frequency as shown in Fig. 10. From the plot it can be deduced that the typical realized gain for this antenna is 6 dB. Balanis [17] discusses that as the element spacing decreases at the higher frequencies, the variation in impedance and other characteristics decreases due to the smoother transmission of the active region (where elements « λ/2) between the closer elements [21]. This is visible with the increase in frequency whereby the gain trace stabilizes between 1300 MHZ and 2300 MHz. The higher frequencies radiation impedance increases due to the thick radius of those elements.
B. Gain Pattern Comparison
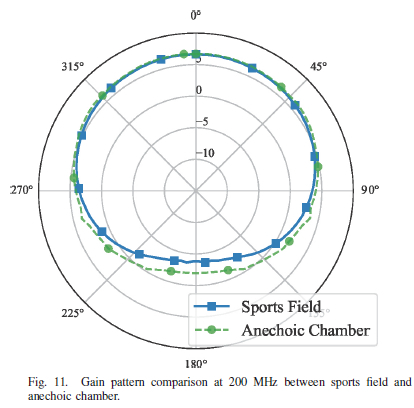
By rotating the receive antenna by the 5 degree intervals up to 180 degrees as explained in Section II-C, the polar pattern can be plotted. This is shown for frequencies of 200 MHz, 1 GHz, and 2.5 GHz in Figs. 11 to 13. The gain patterns shown demonstrate close correlation, less than 2 dB, in the main lobe. The 200 MHz frequency plot, Fig. 11 has the largest discrepancy where the anechoic chamber shows more gain in the back lobe than the sports field. This is attributed to a change in the cable coming off the antenna as well as the lowest limit of the anechoic chambers RAM ability.
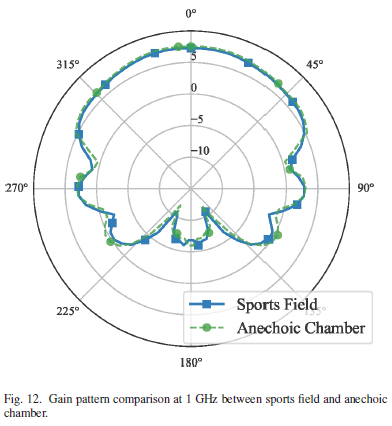
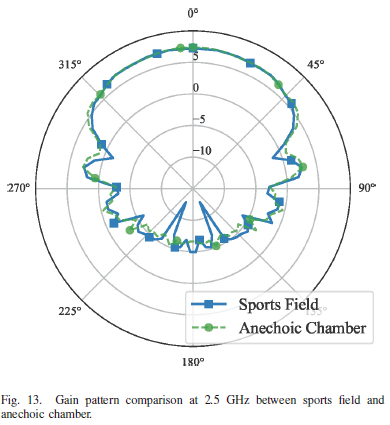
For the 1 GHz and 2.5 GHz frequency patterns, the similarities are nearly indistinguishable besides certain nulls being more prominent on the sports field. Specifically for the 2.5 GHz pattern plot, at « 155° there is a null of 7 dB less than the anechoic chamber.
The results show that using the sports field in question, results could be obtained to within 2 dB, with a worst-case difference at a missed null of 7 dB compared to a state-of-the-art facility for the UHF range. This shows that for «$500, students and engineers are able to obtain a hands-on experience with antenna-testing in-house at a fraction of the cost to a commercial setup. The results shown here are raw results, filtering the data can further improve the accuracy as shown in the following section.
V. DIGITAL FILTERING
Looking closely at the higher frequencies of the transmission (S21) plots, it can be noted that there is some noise on the plot. In Fig. 10 the high frequency (1 GHz and up) shows a ripple, likely caused by a reflection in the cables or due to the VNA operating close to the limits of its dynamic range. This ripple can be removed in post-processing using a filter. This post-processing should not alter the underlying trend, but rather smooth the results to enable a better visual representation. An important aspect to note is that this filtering can also remove the in- and out-of-phase addition caused by the ground reflection. This removes the need to scan through different heights of the send and receive antennas per frequency as discussed in [3], significantly reducing the required measurement time compared to a conventional reflection range measurement.
The Savitzky-Golay filter [22] is a digital filter that allows the required smoothing without distorting the tendency of the underlying data. This is achieved by fitting successive sub-sets of data with a low-degree polynomial. Applying this filter in Python [23] with a 3rd-order polynomial and a window size of 21 gives the smoothed gain result shown in Fig. 14, as opposed to the unfiltered data in Fig. 10. When applying the same order polynomial along with a window size of 39, the sports field unfiltered 3 meter H-Pol (Fig 9) shows similar trends to the V-Pol unfiltered anechoic chamber measurement as shown in Fig. 15. Considering a free-space equivalent, there should be no difference due to polarization for an antenna. Achieving in- and out-of-phase removal with a filter shows the improved accuracy achievable with this filter.
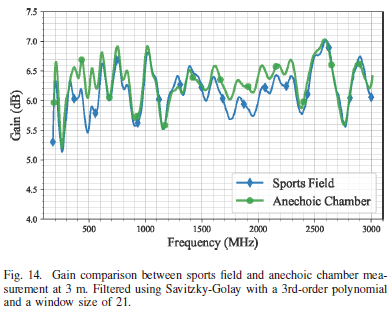
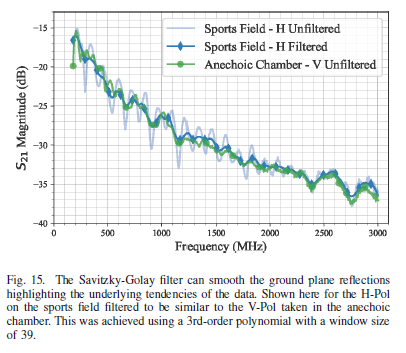
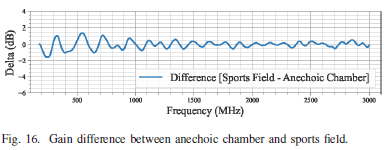
Fig. 16 shows the gain difference between the traces in Fig. 14. This shows that the boresight gain as measured on a sports field yields results to within 2 dB of accuracy compared to measurements in an anechoic chamber.
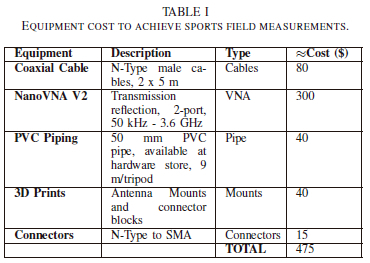
VI. COST
Table I outlines the expenses involved in acquiring the cost-effective antenna testing equipment.
VII. CONCLUSION
Due to the wide use of antennas and the ever-growing interest in wireless control, the ability to experiment with and characterize antennas at tertiary education institutions is paramount. However, the cost to implement a dedicated test facility is often prohibitive. For this reason, research was conducted to highlight the ability of using a cost-effective VNA, self-built tripods and available facilities such as a sports field to make boresight gain measurements to within 2 dB accuracy. Gain pattern plots were made to within 2 dB accuracy, with a worst-case missed null showing a 7 dB discrepancy. The ability to remove in- and out-of-phase reflections from the H-Pol sports field results through postprocessing was also discussed aiding in reduced measurement times.
ACKNOWLEDGMENTS
The authors wish to thank the South African Radio Astronomy Observatory's radio frequency interference team for their assistance, and for allowing the use of their Rohde and Schwarz ZVB8 VNA for this research; Fred Thomas for allowing the use of, and assisting with the anechoic chamber measurements; and the MESA Solutions team for the instrumentation and assistance given during this research.
REFERENCES
[1] J. A. Fordham, "An introduction to antenna test ranges, measurements and instrumentation," Microwave Instrumentation Technologies, LLC, 2016.
[2] G. Evans, Antenna Measurement Techniques. London: Artech House Publishers, 1990. [ Links ]
[3] L. Hemming and R. Heaton, "Antenna gain calibration on a ground reflection range," IEEE Transactions on Antennas and Propagation, vol. 21, no. 4, pp. pp. 532538, 1973.
[4] C. D. M. Ambatali, "Implementation of an oscilloscope vector network analyzer for teaching s-parameter measurements," in 2018 IEEE Region 10 Humanitarian Technology Conference (R10-HTC). IEEE, 2018, pp. 1-6.
[5] M. D. Foegelle, "Antenna pattern measurement: concepts and techniques," Compliance Engineering, vol. 19, no. 3, pp. 22-33, 2002.
[6] S. Eser and L. Sevgi, "Open-area test site (OATS) calibration," IEEE Antennas and Propagation Magazine, vol. 52, no. 3, pp. 204-212, 2010.
[7] M. Hiebel, Fundamentals ofVector Network Analysis. Germany: Rohde & Schwarz GmbH & Co. KG, 2007.
[8] J. Dunsmore, "Network analyzer basics- ee142 fall 07," http://rfic.eecs.berkeley.edu/142/pdf/NABasicsNotes.pdf, 2007, [Accessed: 10.12.2021].
[9] OwOComm, "S-a-a-2 user guide," https://nanorfe.com/nanovna-v2.html, January 2020, [Accessed: 25.04.2020].
[10] H. NanoRFE, "About nanovna v2," https://nanorfe.com/nanovna-v2.html, n.d. 2019, [Accessed: 28.04.2020].
[11] R. DuHamel and D. Isbell, "Broadband logarithmically periodic antenna structures," in 1958 IRE International Convention Record, vol. 5. IEEE, 1957, pp. 119-128.
[12] D. Isbell, "Log periodic dipole arrays," IRE transactions on antennas and propagation, vol. 8, no. 3, pp. 260-267, 1960.
[13] L. Kibona, "Gain and directivity analysis of the log periodic antenna," International Journal of Scientific Engineering and Research (IJSER), vol. 1, no. 3, pp. 14-18, 2013.
[14] C. A-INFO, "A - info ds-18300 technical specifications," https://www.bbrc.ru/upload/iblocka98/5ca2b850_e6a4_11ea_80de_0cc47a1243ef_f363d9a1_e6a4_11ea_80de_0cc47a1243ef.pdf, 2018, [Accessed: 20.05.2020].
[15] K. Mistry, P. Lazaridis, Z. Zaharis, M. Akinsolu, B. Liu, and T. Loh, "Accurate antenna gain estimation using the two-antenna method," in IET Conference Proceedings, 2019.
[16] H. T. Friis, "A note on a simple transmission formula," Proceedings of the IRE, vol. 34, no. 5, pp. 254-256, 1946.
[17] C. Balanis, Antenna Theory : Analysis and Design, 4th ed. United States of America: John Wiley & Sons Inc, 2016.
[18] T. Yanagi, T. Fukasawa, and H. Miyashita, "Extended s-parameter method for measuring reflection and mutual coupling of multi-antennas," IEICE Transactions on Communications, vol. 99, no. 10, pp. pp.2195-2202, 2016.
[19] H. Pienaar, H. C. Reader, and D. B. Davidson, "Karoo array telescope berm shielding: Efficient computational modeling and multicopter measurement," IEEE Transactions on Electromagnetic Compatibility, vol. 59, no. 2, pp. 375-382, 2016.
[20] Spaceteq, "EMC test facility, EMC testing," https://www.spaceteq.co.za/emc-test-facility, n.d. 2018, [Accessed: 30.04.2020].
[21] Y. Wang, J. Wang, Z. Zhao, and J. Yang, "A novel method to calculate the phase center of antennas," Journal of Electromagnetic Waves and Applications, vol. 22, no. 23, pp. 239-250, 2008.
[22] A. Savitzky and M. J. Golay, "Smoothing and differentiation of data by simplified least squares procedures." Analytical chemistry, vol. 36, no. 8, pp. 1627-1639, 1964.
[23] G. Van Rossum and F. L. Drake Jr, Python reference manual. Centrum voor Wiskunde en Informatica Amsterdam, 1995.
The financial assistance of the National Research Foundation (NRF) towards this research is hereby acknowledged. Opinions expressed and conclusions arrived at, are those of the authors and are not necessarily attributed to the NRF.

Casey Bryant received his B.Tech in Mechatronics (Cum Laude) from the Cape Peninsula University of Technology (CPUT) in 2019. As part of his coursework, he carried out a cost analysis on a radio frequency anechoic chamber in conjunction with the French South African Institute of Technology (F'SATI). He is furthering his studies with an M.Eng in Satellite Systems and Applications at CPUT, researching cost-effective methods to pre-characterise antennas at tertiary educational institutions.

Pieter Gideon Wiid (Senior Member, IEEE) received the B.Eng., M.Sc. Eng., and Ph.D. degrees in electronic engineering from the University of Stellenbosch (SU), Stellenbosch, South Africa, in 2000, 2005, and 2010, respectively. From 2001 to 2007, he was a Technology Engineering Investigator with South Africa's Power Utility, Eskom, Western Cape, South Africa, doing technical investigations, documentation control, and standards. In 2010, he was a Post-Doctoral Fellow with SU, where he was involved in broadband antenna development. From 2011 to 2016, he was a Lecturer with his alma mater. In 2017, he accepted a joint position between SKA SA and SU, as a Senior Researcher in the field of electromagnetic interference (EMI) and electromagnetic compatibility (EMC). Afterward, he was appointed in 2020 to the Cape Peninsula University of Technology to do research on EMC for nanosatellites. During 2022, he moved to the University of Cape Town to join the Radar Remote Sensing Group, where his research concentrates on EMC and antenna measurement techniques. His current research interests include EMC, EMI mitigation, antenna measurement techniques, electromagnetic coupling to photovoltaic installations, and hyperband antenna design. Dr. Wiid currently serves on the IEEE South African Combined AP/MTT/EMC Chapter leadership and the IEEE EMC Society board of directors, as well as on the South African National Committee of the International Union of Radio Science as Chair of Commission E-Interference. He is a registered Professional Engineer with the Engineering Council of South Africa.

