


Services on Demand
Article
 English (pdf)
 Article in xml format
 Article references
Indicators

Related links
-
 Cited by Google
 -
 Similars in Google
Share

 Permalink
SAIEE Africa Research Journal
On-line version ISSN 1991-1696
Print version ISSN 0038-2221
SAIEE ARJ vol.114 n.2 Observatory, Johannesburg Jun. 2023
Machine Learning Based Driver Monitoring System: A Case Study for the Kayoola EVS
Ali ZiryawulawoI; Cosmas MwikirizeII; Jonathan SerugundaII; Edwin MugumeII; Simon Peter MiyingoIII; Melissa KiraboIV
IDepartment of Product Development at Kiira Motors Corporation, Kampala, Uganda. Email: azilyawulawo@gmail.com
IICosmas Mwikirize, Jonathan Serugunda and Edwin Mugume (Member, IEEE) are with the Department of Electrical and Computer Engineering, Makerere University, P.O Box 7062, Kampala, Uganda. Email: {cosmas.mwikirize@mak.ac.ug, jonathan.serugunda@mak.ac.ug, edwin.mugume@mak.ac.ug}
IIIKiira Motors Corporation and is now with the United Nations. Email: simon.miyingo@gmail.com
IVKiira Motors Corporation and is now with Nile Breweries Limited. Email: melissakirabo7@gmail.com
ABSTRACT
With the ever-growing traffic density, the number of road accidents has continued to increase. Finding solutions to reduce road accidents and improve traffic safety has become a top priority for Kiira Motors Corporation, a Ugandan state-owned automotive company. The company seeks to develop intelligent driver assistance systems for its market entry product, the Kayoola EVS bus. A machine learning-based driver monitoring system that would monitor driver drowsiness and send out an alarm in case drowsiness is detected has been developed in an attempt to reduce drowsiness-related accidents. The system consists of a camera positioned in such a way as to keep track of the driver's face. The camera is interfaced with a Raspberry Pi minicomputer which carries out the computations and analysis and when drowsiness is detected, an alarm is triggered. Dangerous driver behavior including distraction and fatigue has long been recognized as the main contributing factor in traffic accidents. This paper therefore presents the development of a driver monitoring system for the Kayoola Electric City Bus to address the increasing occurrences of road accidents. The machine learning-based driver monitoring system is designed to be non-intrusive with continuous real-time operation.
Index Terms: Blink Detection, Convolutional Neural Network, Drowsiness Detection, Facial Landmarks, Kayoola EVS.
I. INTRODUCTION
DRIVER drowsiness and distraction, particularly amongst long-distance truck drivers and public carrier vehicle drivers is a primary contributor to a big percentage of road accidents across the globe with an estimated annual death of 1.3 million people according to the World Health Organization [1]. Subsequently, driver drowsiness and distraction ought to be well addressed to increase transportation safety and reduce the number of accidents that result from fatigued and distracted driving.
Kiira Motors Corporation is a State Enterprise established to champion value addition in the nascent motor vehicle industry in Uganda through technology transfer, contract manufacturing and supply chain localization. KMC developed Africa's first electric vehicle, the Kiira EV, Africa's first hybrid vehicle, the Kiira EVS, and Africa's first solar electric bus, the Kayoola Solar Bus [2].
Enhancing a car driver's overall performance decreases both the occurrences and damage caused as a result of accidents. Over the past decade, several techniques to model and improve driving monitoring and assistance systems have been proposed. The main goal of the Advanced Driver Assistance System (ADAS) is to offer safer environment for driver and to make contributions to traffic safety in general. Advanced Driver Assistance Systems include; pedestrian detection, road signs recognition, automated parking and driver fatigue detection. Driver monitoring addresses the driver's fatigue problem, which is responsible for extreme number of road accidents [3].
A lot of research has been carried in attempt to measure drowsiness given that the effects of drowsiness are not instantaneous with varying onset periods as well as the cumulative decrease in performance together with quantifiable psycho-physiological signs [4]. The advancement in technology has led to advanced fatigue measurement and quantification methods such as monitoring of the brain activity using the electroencephalography, eye movements and head movements [5]. Other systems measure driver performance using parameters such as lane monitoring [6], steering wheel movements and braking [7].
In this paper, a low-cost drowsy detection system using a Raspberry Pi based on the PERcentage of eye CLOsure (PERCLOS) has been developed. The PERCLOS method is non-intrusive, comfortable, does not inconvenience the driver and has been proven to be an accurate means of detecting drowsiness [8]. In addition, this method is not affected by environmental factors like road condition and is able to detect cases of micro sleeps basing on a set threshold value. In the PERCLOS method, a camera is positioned in such a way that it is able to track and capture a live stream video of the driver's face. The video is processed in real time to determine whether the driver is drowsy or alert and an alarm is sounded if the driver is drowsy.
The paper is outlined as follows. Section II includes the related works Section III details the steps taken to develop the Driver Monitoring System based on the established design considerations and the user requirements. Section IV details the analysis done on the system's performance metrics on the algorithms used in the development of the project and Section V concludes the paper.
II. RELATED WORK
Authors in [9] proposed a system based on Haar-like features and Adaboost to train a cascade classifier which shown great performance in face detection. The key concept of this feature-based approach is that the face in the image is identified based on certain basic characteristics, regardless of ambient light, the orientation of the face, and posture.
Machine learning has over the years emerged as an accurate framework for face detection and eye state classification. Deep learning based on convolution neural networks (CNNs) has rapidly emerged as a powerful tool in face detection primarily for drowsiness detection [10]. A multi-tasking Convolutional Neural Network model was developed in [11] to detect driver drowsiness. The model utilizes the changes in the driver's eye and mouth characteristics to detect drowsiness. Authors in [12] proposed a real-time driver state monitoring using a CNN-based Spatio-temporal approach where action recognition is extracted from temporal information in addition to the spatial information.
A deep learning model for reliable drowsiness prediction is described in [13], which is based on a mix of a 3D conditional generative adversarial network and two-level attention bidirectional LSTM network. A 3D encoder-decoder generator was developed to raise high-resolution fake image patterns and implement a 3D discriminator to predict fatigue incidents from the spatial-temporal domain, with the goal of retrieving shortterm spatial-temporal features with a variety of fatigue-related data. Researchers also looked at the employment of a two-level attention technique to steer the bidirectional LSTM to understand the prominence of memory data for short periods and temporal data for extended-term spatial-temporal fusion.
Altameem et al. [14] implemented a real-time image classification and drowsiness system based on machine learning. Facial features are used to create an emotion recognition approach based on Support Vector Machines (SVM). Under varied brightness circumstances, the algorithm demonstrated high performance. The system is linked to the car's circuits, which allows it to follow the car's data and provide more precise findings. Autonomous cars must include sensing devices that can predict if a driver is tired, irritated, or experiencing severe shifts in emotions, such as fury. In order to extract the driver's state and assess if they are driving safely, these sensing devices must continually track the driver's face and recognize facial landmarks.
Esteves et al. [15] investigated the use of signal processing and machine learning approaches in connected cars to identify driver fatigue, which was made possible through interactive simulations. Extensive biometrics research employing the electrocardiogram and the faces allows for the continued development of subject-specific fatigue frameworks for effective prediction.
Cheng et al. [16] offered a multi-pronged strategy for determining if the sequence of the driver's facial landmarks varies from attentive to drowsy behavior. The study was devised and carried out using a simulation tool. Based on face landmarks, eye aspect ratio and mouth aspect ratio patterns are computed. Percentage eye-closure across a set time frame, blink rate, averages of blink length, closing frequency, reopening frequency, and proportion of yawning was collected. Following extracted features, a drowsiness evaluation framework is suggested. The tiredness evaluation system was created using different machine learning techniques.
Koohestani et al. [17] focus on analyzing the driving experience using a variety of machine learning approaches. The suggested system's optimization section contains two primary phases. In the first stage, bagging, boosting, and voting ensemble learning techniques are used to maximize the efficiency of the K-nearest neighbors, support vector machine, and naïve Bayes algorithms. Then, four novel optimization techniques (the ant lion optimizer, whale optimization algorithm, particle swarm optimization, and grey wolf optimizer) are used to enhance the system's variables and, as a consequence, improve its overall functionality.
A drowsiness detection system for driver monitoring is suggested in [8] which is adaptable to use in buses and trucks. Head-pose estimation, face recognition, eye detection, eye-state classification, and fatigue estimation among others are different sub-systems of the design. The proposed system is implemented utilizing two main steps. First, spectral regression is used for eye tracking and then a fusion model is used for eye state classification. PERCLOS is then used to determine whether the eye is open or closed.
III. METHODOLOGY
A. System Overview
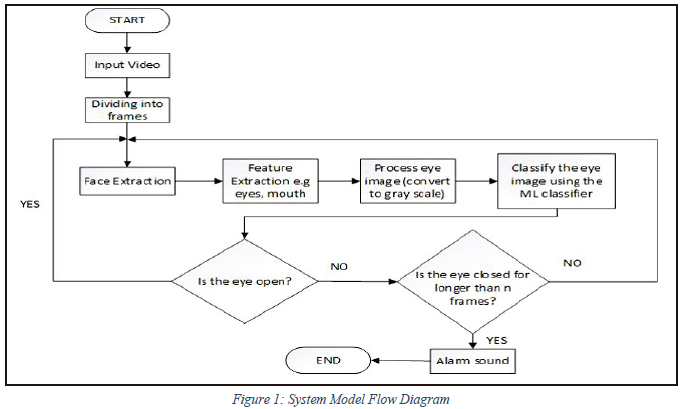
The proposed system consists of a camera positioned to keep track of the driver's face in a bus. The camera captures the live-stream video and feeds the data into the machine learning program on the Raspberry Pi, the system then detects the driver's face and localizes the eyes which are then classified as open or closed. Once the eyes have been detected as closed for a period longer than a set threshold, the driver monitoring system sends out an alarm alerting the driver.
The input to the system is the live-stream video of the driver's face and the output is the driver's state (i.e., alert or drowsy) and an alarm is sounded if drowsiness is detected. This was achieved by dividing the video into frames, performing face detection on each frame, and localizing the eye region on each detected face. Eye state analysis was then applied to the eye region to make a decision on whether the driver is alert or drowsy. The algorithms used in this project are detailed below.
Face detection was done using the Viola-Jones algorithm which uses Haar-like features, that is, a scalar product between the image and some Haar-like templates. The Viola-Jones algorithm has 4 main steps i.e., Selecting Haar-like features, creating an integral image, running AdaBoost training, and creating classifier cascades.
Eye state analysis involves the blink rate and duration, and the open/closed state of the eyes. A convolutional neural network was used to implement blink detection as well as open/close eye state detection. Deviation from a threshold value was determined and drowsiness detection was then based on how many consecutive frames the driver's eye is closed for, causing a high enough deviation from the threshold value, therefore triggering an alarm. The system model is shown in the flow diagram in Figure 1.
B. Data Collection and Processing
Data collection involved taking pictures of different people of different ethnicities under different lighting conditions, orientations and eye state. The different orientations included open eyes, closed eyes, half-closed eyes, eyes looking at an angle. A canon rebel t3i camera was used to take pictures of various faces, under different lighting conditions.
To enrich our data, we also added images from two other open-source datasets; Specs on Faces (SoF) dataset and FDDB (Face Detection Dataset and Benchmark). The Specs on Faces (SoF) dataset is a collection of images of 112 persons (66 males and 46 females) who wear glasses under different illumination conditions. The dataset is focused on two main challenges: harsh illumination environments and face occlusions, which highly affect face detection, recognition, and localization [18]. The Face Detection dataset and benchmark (FDDB), is a dataset of face regions designed for studying the problem of unconstrained face detection. It contains an annotation of faces in a set of images taken from the Faces in the wild data set [19].
The collected data was preprocessed in the following ways;
1) Format: The collected data was spread in different file types that included raw format, JPEG, and PNG. All data were converted into .bmp format due to compression artifacts in some compression levels of JPEG images.
2) Data Processing and Cleaning: This is involved processing the collected data. Different datasets were created for training and testing. The training and testing sets are split on an appropriate proportionality with the training set having 80% and the testing set having 20% of the data. The training set is split further into a validation set. Data resizing, sorting, labeling, and renaming was performed on the data in the training, testing, and validation datasets.
3) Feature Extraction: The purpose of this step was to find out which features are important for prediction and select them for faster computations and low memory consumption. The main important feature that is extracted are the eyes for localization and classification. Other features that are extracted include the nose and mouth as they are important for face detection. For this case, features like open eye, half-closed eyes, completely closed eyes, frontal face, etc. are important for training a driver drowsiness system.
For prototype testing in the Kayoola bus, data from 60 participants was collected during day and night conditions. The performance of the system was analyzed for the different user conditions as elaborated in Chapter III Section C.
C. Software Implementation
Two machine learning models were developed for face detection and eye detection and localization. These were the blink rate detection based on facial landmark detection and the other was a convolutional neural network using Haar Cascade classifiers based on the Viola-Jones algorithm.
A CNN model was developed based on Viola-Jones Algorithm to detect drowsiness based on Open/Closed eye state. The model was trained on different faces where Haar cascade classifiers were used for face detection. The cascade classifiers were first trained based on the Viola-Jones object detection framework. The trained classifiers were then fed into the CNN model which was then trained to detect drowsiness based on the Open/Closed eye state.
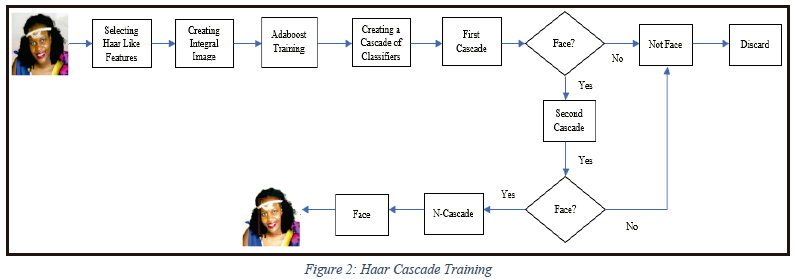
i). Haar Training
The model was trained as summarized in Figure 2 on a total of 1800 positive images and 2620 negative images. The positive images in this case imply the images that contained the face region and negative images denote images with no face. The vector file was packed with 200 positive images of dimensions 24 x 24. This vector file is created into which the positive object files are packed containing the names of the positive images as well as the location of the objects in each image. Haar training was done for 30 stages, over all types of Haar features. 1000MBs of memory were assigned for the training of the program. Training was terminated when the false alarm rate was lower than 1 x 10e"5. The output of this algorithm was the position of the detected face as a rectangle.
The executable Haar training file collects a new set of negative samples for each stage with a set limit for the size of the set. It uses the previous stages' information to determine which of the "candidate samples" are misclassified. Training ends when the ratio of misclassified samples to candidate samples is lower than the FRstage number. Therefore, regardless of the number of stages (n stages) defined in the haar training batch file, the program may terminate earlier if the condition is met. Each completed stage of the training creates a text file and all the created classifiers from each of the stages are combined together to generate one XML file which is a cascade of Haar-like classifiers. The generated classifier is used in training the model for face and eye detection.
ii). CNN for Drowsiness Detection based on Open/Closed Eye state
A convolutional neural network was designed as in Figure 3 to train the model to accurately classify eyes as open or closed.
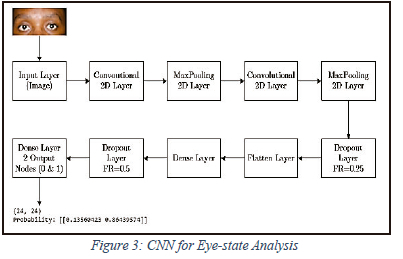
The CNN uses the Haar Cascade Classifiers to localize the face, left eye, and right eye. The image data generator function creates batches of images at every instant it is called and then processing is done on the images to resize, normalize and convert them to grayscale. Different layers including the convolutional layer, Max pooling layer, dropout layer, flatten layer and dense layer are added and their sizes are specified. Two activation functions, that is the Relu and Softmax functions are used to get all the relevant data and also squash the matrix into output probabilities.
Drowsiness was estimated based on the percentage of eye closure (PERCLOS) defined in [20] as the ratio of the closed eyes detected by the classifier in a given frame to the total number detected of eyes (both open and closed) over a specified time frame. PERCLOS is calculated according to (1):
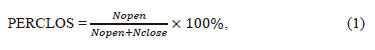
where Nopen and Nclose represent the number of open and closed eye detected frames in a specific time interval.
Drowsiness detection was also performed based on blink-rate detection. The eye region extracted from the facial landmarks as described in [21] is then fed as input of the blink rate detection algorithm so as to output a live-stream video highlighting the eye region, the eye aspect ratio, and the number of blinks detected.
i). Facial Landmark Detection
Facial Landmark detection is a key step in building a blink detection algorithm so as to be able to localize the eyes in a given frame. This algorithm was built using OpenCv, python, and dlib.
ii). Eye Region Extraction
The essence of facial landmark detection is to localize the key regions in the face which include the eyes, eyebrows, nose, ears, and mouth. This feature extraction is achieved by specifying the indices of the different parts which are required to be extracted in the visualization of the facial landmarks. The video stream from the webcam is instantiated and the frames in the video stream are looped over with the loop broken when there are no more frames left in the video. When data is fed into the camera, faces in the different frames are detected and the facial landmarks are applied to the detected faces in order to localize the regions of interest around the face. The regions of interest, in this case, are the left and right eyes.
iii). Blink detection
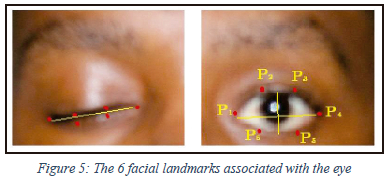
The distance between the vertical eye landmarks and the horizontal eye landmarks is computed by defining the coordinates of the facial landmarks of the eyes [22]. The two sets of distances between the different eyes are computed and the Eye Aspect Ratio (EAR) is computed. For this project, facial landmark detectors are used for localization of eyes and eyelid contours in the blink detection algorithm. The eye aspect ratio is then derived from the eye contours and is used to determine the eye state as open or closed. For each frame in the video, the eye landmarks are detected and localized as in Figure 4.
Based on the image in Figure 4, it can be seen that there is a relation between the width and height of the coordinates. The Eye Aspect Ratio (EAR) is the equation that defines the relationship between the width and height of the coordinates and is derived from equation (2)
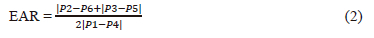
Where; P1, P2, . . ., P6 are 2D facial landmark locations depicted in Figure 4. The numerator of this equation computes the distance between the vertical eye landmarks while the denominator computes the distance between horizontal eye landmarks.
The EAR threshold was set to 0.3 as recommended by the studies in [23] and [24]. If the EAR falls below 0.3 and then rises above it, a blink is registered. The EAR consecutive frames threshold was set to 3. This indicates that three successive frames with an EAR less than the EAR threshold must happen in order for a blink to be registered. The number of blinks is drawn on the output frame.
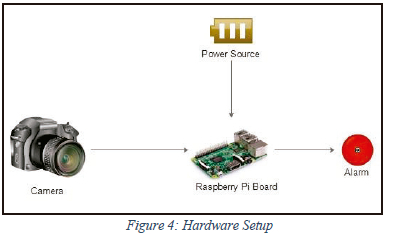
D. Hardware Implementation
The prototype was developed using the Raspberry Pi Model 3 B+ board and the camera used was the pi camera. The process involved the arrangement of the components and connecting the components including the camera, display, and power source to the control board.
In selecting the technology for the integrated system, the key requirement was the system's ability to work unobtrusively for a wide range of operator characteristics and behaviors under varying environmental conditions, and the ability to draw power from the vehicle's battery. The Raspberry Pi provided the greatest promise of meeting these design objectives.
Tests which included onboard and off-board tests were carried out to analyze the functionality of the system. The onboard tests were carried out in the Kayoola bus with the camera placed in such a way that it was able to capture the driver's face.
IV. RESULTS AND DISCUSSION
The drowsiness detection results were obtained by testing both drowsiness detection algorithms on 60 participants in different conditions. Testing was done using the webcam on the laptop computer and the alarm was sounded using the speakers on the laptop. Testing of the drowsiness monitoring system was also done using the Raspberry Pi in the Kayoola bus.
The system was tested for different people in different ambient lighting conditions (daytime and nighttime). Two drowsiness detectors were tested; one is based on the closed/open eye and the other was based on the blink rate. Though the two processes have relatively equal accuracy, the computational requirements of the former are less than that of the latter.
A. CNN Model for Open/Closed Eye State
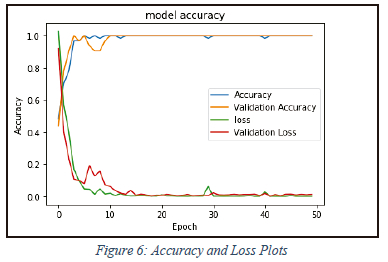
The Convolutional Neural Network to classify between open and closed eyes was trained on a total of 13,987 images and validated on a total of 632 images for 15 epochs. The accuracy and loss graphs of the training and testing processes are shown in the figure below.
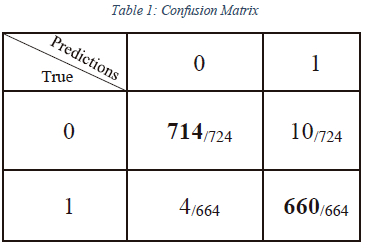
The Confusion Matrix: In order to evaluate the classification performance, the confusion matrix is used to visualize the discrepancy between the actual class labels and predicted results from the classification. The rows correspond to the known class of the data, that is, the labels in the data. The columns correspond to the predictions made by the model. The value of each element in the matrix is the number of predictions made with the class corresponding to the column, for example, with the correct value as represented by the row. Thus, the diagonal elements show the number of correct classifications made for each class, and the off-diagonal elements show the errors made. The confusion matrices of the results are shown in Table 1.
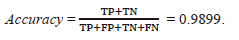
1) Accuracy, Precision, and Recall: Accuracy refers to the percentage of correct predictions made. These performance parameters can be obtained from the confusion matrix using the respective equations.
Precision refers to the percentage of the relevant instances while recall refers to the fraction of the total relevant instances accurately classified by an algorithm.
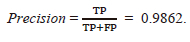
From the results obtained above, it is seen that the model accurately predicted 98.62% of the closed eyes as closed and 99.44% of the open eyes as open.
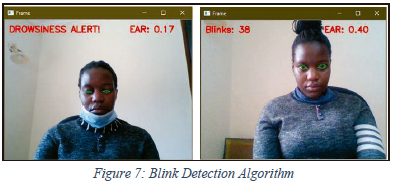
B. Blink Detection A lgorithm
The blink detection algorithm was able to accurately detect the drowsiness based on the eye aspect ratio and whether or not the person is detected as blinking. This algorithm however could not accurately perform on individuals wearing masks given that it uses facial landmarks for eye extraction. The sample output of the blink detection algorithm is shown in Figure 7.
C. Drowsiness Detection
Testing was carried out among different people under different conditions both day and during night conditions. Each individual was asked to be alert while looking in the camera for a certain time and also act drowsy for a certain time and the number of alert and drowsy detections was recorded and tabulated as in the table. The accuracy of the detection was also calculated according to (3):
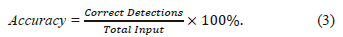
The drowsiness detection algorithms were tested on 60 individuals. Each individual was requested to blink 20 times and also become drowsy 6 times during the testing process. The results obtained are tabulated in Table 2 and Table 3.
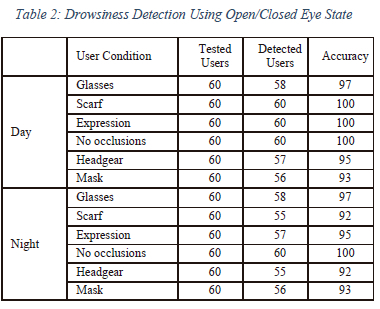
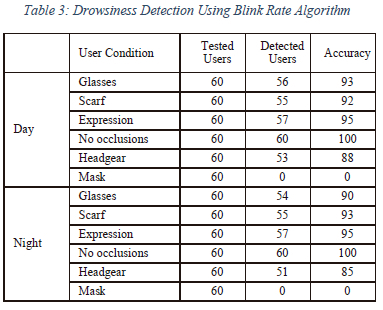
The results from testing the drowsiness detectors indicate that both detectors were robust and were able to detect drowsiness in various scenes. However, the drowsiness detector based on the blink detector was unable to detect drowsiness when the subject had a mask on, while the drowsiness detector based on the open/closed eye state could properly detect drowsiness with or without the face mask on. Also, the detector based on open/closed eye state generally outperformed the blink detector across the different user conditions and lighting scenes (day or night).
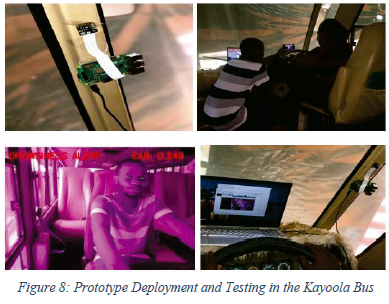
D. Prototype Testing
The drowsiness detection algorithms were also tested on the Raspberry Pi3 Model B+ with the live-stream video captured by the Pi Camera. The setup was placed in the Kayoola Bus. The Raspberry Pi and Pi camera were placed on the windshield frame so as to properly capture the driver's face.
The process of setting up the prototype involved carefully placing the Raspberry Pi board in the Kayoola bus as well as ensuring that the pi camera is well connected to the camera port. The camera was then well positioned so as to ensure that it is able to capture the driver's face. The system was then powered on and an individual sat in the driver's seat so as to mimic the driver.
The tests were carried out on 60 different individuals where each individual was asked to become drowsy for a certain time and also blink 6 times. The model was able to accurately detect the blinks and drowsiness and in case drowsiness was detected, an audio alarm was sounded and a visual display warning showing drowsiness detected was displayed on the screen. The functionality test of the prototype from the display can be as shown in Figure 8.
E. Discussion of Results
The Viola Jones algorithm together with the open/closed eye classifier was considered for the final implementation in the drowsiness detection algorithm given its better number of frames per second as well as low computation memory requirement thereby providing faster detection suitable for the real-time application in the driver monitoring system.
The blink detection algorithm accurately detected and calculated the number of blinks for the different individuals. This algorithm however couldn't accurately detect individuals wearing masks given that it uses facial landmarks to localize the eyes.
Our proposed approach achieves an accuracy of 98.99%, a precision of 98.62%, and a recall value of 99.44%. This generally compares favorably with other works in literature which were based on different dataset. Li et al. [25] proposed a Grey Wolf Optimizer Algorithm for monitoring driver physiological signals, achieving an accuracy of 97.5%, precision of 98.3%, and recall value of 94%. Siddiqui et al. [26] proposed a machine learning model for monitoring drowsiness based on respiratory rate detection, achieving an accuracy of 87%, precision of 86%, and recall of 88%. Although these studies used different datasets, the system proposed in this paper achieves accuracy, precision, and recall values which compare favorably with these related works in literature.
V. CONCLUSION
The research was successfully completed and all the intended objectives were successfully achieved. This involved understanding the current advanced driver assistance systems currently employed in vehicles and the deployment of machine learning for driver monitoring and drowsiness detection.
In addition, a prototype based on the Raspberry Pi was developed for the machine learning-based driver monitoring system. The machine learning driver monitoring system operation will detect drowsiness and alert the driver in case drowsiness is detected. This system will increase the safety of the Kayoola EVS by helping to reduce fatigue-related accidents.
VI. Limitations
The primary limitation of the drowsiness detection system was the presence of eyewear especially dark or tinted eye wear, where the eyes weren't visible. The system performed better when the participant was not wearing any form of eyewear. Other challenges faced in this project include the following;
Dependence on ambient light: The model strongly depends on the ambient light condition. As our algorithm considers the eyesight as a dark region when it is closed and a brighter region when it is open so if the ambient condition affects such that there may be a possibility of brighter and darker conditions depending on the light source then it causes error in the result. Also, this model depends on a certain minimum level of light condition otherwise it becomes very difficult to detect and classify the eyes as open or closed.
Processor speed of hardware: For real-time operation, the system requires high computation memory and processor speed. This ultimately will ultimately increase the cost of the product.
Multiple face problem: If multiple faces are detected by the system, then the integrity of its output may be compromised due to the different conditions of the faces detected. In addition to this, the detection speed is reduced because of the operation on multiple faces.
VII. RECOMMENDATIONS
The model's ability to discern drowsiness through eyewear should be improved. It is recommended that future development work include investigations into the factors that limit the operational performance of the system when the driver is wearing any form of eyewear, especially dark or tinted glasses. The factors that may limit the model performance when the driver is wearing eyewear may include; reflections on the lenses, lens coatings that reduce transmission of the infrared part of the spectrum, and opacity of sunglasses.
The results of this evaluation indicated the driver monitoring system performed better under higher levels of ambient illumination as compared to lower levels of ambient illumination. The source of illumination is more widespread during higher levels of illumination (daytime), coming from many points of entry through the windows of the vehicle. Therefore, it is recommended that future development work designs a system that provides even illumination of the driver's face in both the lateral and vertical dimensions. To tackle this challenge, we used an infrared camera for our system.
In order to tackle the challenge of multiple face detection, there is a need to ensure that the camera is placed in such a way that only the driver's face is captured.
Further research should be carried out to assess other drowsiness monitoring approaches such as lane departure, pedal movements, and steering wheel movements as these could as well provide relatively accurate results. Future research should focus on the fusion of these approaches to achieve a high-performance hybrid advanced driver assistance system.
REFERENCES
[1] World Health Organization, Road Traffic Injuries, 20 08 2021. [Online]. Available: https://www.who.int/news-room/fact-sheets/detail/road-traffic-injuries
[2] Kiira Motors Corporation," Kiira Motors Corporation," 28 09 2021. [Online]. Available: https://www.kiiramotors.com/about/.
[3] T Kundinger, A Riener, N Sofra, and K Weigl," Driver drowsiness in automated and manual driving: insights from a test track study", 25th International Conference on Intelligent User Interfaces (IUI '20). Association for Computing Machinery, New York, NY, USA, 369-379, 2020.
[4] J. S. Bajaj, N. Kumar, and R. K. Kaushal, "Comparative Study to Detect Driver Drowsiness," in 2021 International Conference on Advance Computing and Innovative Technologies in Engineering (ICACITE), 2021, pp. 678-683. doi: 10.1109/ICACITE51222.2021.9404761.
[5] M. Ramzan, H. U. Khan, S. M. Awan, A. Ismail, M. Ilyas, and A. Mahmood, "A Survey on State-of-the-Art Drowsiness Detection Techniques," IEEE Access, vol. 7. 2019. doi: 10.1109/ACCESS.2019.2914373.
[6] S. Arefnezhad, S. Samiee, A. Eichberger, and A. Nahvi, "Driver Drowsiness Detection Based on Steering Wheel Data Applying Adaptive Neuro-Fuzzy Feature Selection," Sensors, vol. 19, no. 4, p. 943, Feb. 2019, doi: 10.3390/s19040943.
[7] M. DreiBig, M. H. Baccour, T. Schack and E. Kasneci," Driver Drowsiness Classification Based on Eye Blink and Head Movement Features Using the k-NN Algorithm," 2020 IEEE Symposium Series on Computational Intelligence (SSCI), 2020, pp. 889-896, doi: 10.1109/SSCI47803.2020.9308133.
[8] B. Mandal, L. Li, G. S. Wang, and J. Lin, "Towards Detection of Bus Driver Fatigue Based on Robust Visual Analysis of Eye State," IEEE Transactions on Intelligent Transportation Systems, vol. 18, no. 3, 2017, doi: 10.1109/TITS.2016.2582900.
[9] P. Viola and M. Jones," Rapid object detection using a boosted cascade of simple features," Proceedings of the 2001 IEEE Computer Society Conference on Computer Vision and Pattern Recognition. CVPR 2001, Kauai, HI, USA, 2001, pp. I-I, doi: 10.1109/CVPR.2001.990517.
[10] W. Kongcharoen, S. Nuchitprasitchai, Y. Nilsiam and J. M. Pearce," Real-Time Eye State Detection System for Driver Drowsiness Using Convolu- tional Neural Network," 2020 17th International Conference on Electrical Engineering/Electronics.
[11] Computer, Telecommunications and Informa- tion Technology (ECTI-CON), 2020, pp. 551-554, doi: 10.1109/ECTI-CON49241.2020.9158265.B. K. Savas, and Y. Becerikli," Real Time Driver Fatigue Detection System Based on Multi-Task ConNN," in IEEE Access, vol. 8, pp. 12491- 12498, 2020, doi: 10.1109/ACCESS.2020.2963960.
[12] N. Kose, O. Kopuklu, A. Unnervik and G. Rigoll," Real-Time Driver State Monitoring Using a CNN Based Spatio-Temporal Approach*," 2019 IEEE Intelligent Transportation Systems Conference (ITSC), 2019, pp. 3236-3242, doi: 10.1109/ITSC.2019.8917460.
[13] Y. Hu, M. Lu, C. Xie, and X. Lu, "Driver Drowsiness Recognition via 3D Conditional GAN and Two-Level Attention Bi-LSTM," IEEE Transactions on Circuits and Systems for Video Technology, vol. 30, no. 12, 2020, doi: 10.1109/TCSVT.2019.2958188.
[14] A. Altameem, A. Kumar, R. C. Poonia, S. Kumar, and A. K. J. Saudagar, "Early Identification and Detection of Driver Drowsiness by Hybrid Machine Learning," IEEE Access, vol. 9, 2021, doi: 10.1109/ACCESS.2021.3131601.
[15] T. Esteves et al., "AUTOMOTIVE: A Case Study on AUTOmatic multiMOdal Drowsiness detecTIon for smart VEhicles," IEEE Access, vol. 9, 2021, doi: 10.1109/ACCESS.2021.3128016.
[16] Q. Cheng, W. Wang, X. Jiang, S. Hou, and Y. Qin, "Assessment of Driver Mental Fatigue Using Facial Landmarks," IEEE Access, vol. 7, 2019, doi: 10.1109/ACCESS.2019.2947692.
[17] A. Koohestani, M. Abdar, A. Khosravi, S. Nahavandi, and M. Koohestani, "Integration of Ensemble and Evolutionary Machine Learning Algorithms for Monitoring Diver Behavior Using Physiological Signals," IEEE Access, vol. 7, 2019, doi: 10.1109/ACCESS.2019.2926444.
[18] M. Afifi and A. Abdelhamed, "AFIF4: Deep gender classification based on AdaBoost-based fusion of isolated facial features and foggy faces," J. Vis. Commun. Image Represent., vol. 62, pp. 77-86, Jul. 2019, doi: 10.1016/j.jvcir.2019.05.001.
[19] V. Jain and E. Learned-Miller, "Fddb: A benchmark for face detection in unconstrained settings," UMass Amherst Tech. Rep., no. January, 2010.
[20] Q. Zhuang, Z. Kehua, J. Wang and Q. Chen," Driver Fatigue Detection Method Based on Eye States with Pupil and Iris Segmentation," in IEEE Access, vol. 8, pp. 173440-173449, 2020, doi: 10.1109/AC-CESS.2020.3025818.
[21] N. N. Pandey and N. B. Muppalaneni, "Real-Time Drowsiness Identification based on Eye State Analysis," in 2021 International Conference on Artificial Intelligence and Smart Systems (ICAIS), 2021, pp. 1182-1187. doi: 10.1109/ICAIS50930.2021.9395975.
[22] Q. Cheng, W. Wang, X. Jiang, S. Hou and Y. Qin," Assessment of Driver Mental Fatigue Using Facial Landmarks," in IEEE Access, vol. 7, pp. 150423-150434, 2019, doi: 10.1109/ACCESS.2019.2947692.
[23] C. Dewi, R.-C. Chen, X. Jiang, and H. Yu, "Adjusting eye aspect ratio for strong eye blink detection based on facial landmarks," 2022, doi: 10.7717/peerj-cs.943.
[24] A. Kuwahara, K. Nishikawa, R. Hirakawa, H. Kawano, and Y. Nakatoh, "Eye fatigue estimation using blink detection based on Eye Aspect Ratio Mapping (EARM)," Cognitive Robotics, vol. 2, pp. 50-59, Jan. 2022, doi: 10.1016/J.COGR.2022.01.003.
[25] X. Li, Z. Yang, and H. Wu, "Face detection based on receptive field enhanced multi-task cascaded convolutional neural networks," IEEE Access, vol. 8, 2020, doi: 10.1109/ACCESS.2020.3023782.
[26] H. U. R. Siddiqui et al., "Non-invasive driver drowsiness detection system," Sensors, vol. 21, no. 14, 2021, doi: 10.3390/s21144833.
This Research was funded in part by Kiira Motors Corporation.
Ali Ziryawulawo received the B.Sc. degree in Electrical Engineering from Makerere University in 2021. He is an Electrical and Electronic Systems Engineer with Kiira Motors Corporation, a Ugandan Automotive Manufacturer. His research interests include green mobility technologies, advanced driver assistance systems, cyber-physical systems, machine learning applications and IoT.
Melissa Kirabo received the B.Sc. degree in Electrical Engineering from Makerere University in 2021. She is a Control & Automation Engineer at Nile Breweries Limited-Anheuser-Busch InBev. Her research interests include industrial retrofits and optimization using PLC's, the application of machine learning technologies in industrial automation, and advanced driver assistance systems.
Cosmas Mwikirize received the B.Sc. degree in Electrical Engineering from Makerere University in 2009, and a M.Sc. degree in Electrical Engineering from Makerere University in 2012. He also holds an M.Eng degree (2017) and a PhD degree (2019) in Biomedical Engineering from Rutgers University. He is a lecturer in the Department of Electrical and Computer Engineering at Makerere University. He is a researcher at the Marconi Lab and his work focuses on machine learning-aided image analysis and embedded systems development.
Jonathan Serugunda received the B.Sc. degree in Electrical Engineering from Makerere University in 2005. He received the M.Sc. degree in Communication Engineering from the University of Manchester, United Kingdom in 2008 and the Ph.D. degree in Electrical & Electronic Engineering from the University of Bristol, United Kingdom in 2015. He is a lecturer at Makerere University in the Department of Electrical and Computer Engineering. He is a member of netLabs!UG which is a wireless research center based at Makerere University. His research interests include radio wave propagation and antenna design, design and analysis of wireless networks, physical layer security and unmanned aerial vehicles (UAVs) assisted communication systems.

Edwin Mugume (S'12-M'17) received the B.Sc. degree in Electrical Engineering (First Class Honours) from Makerere University, Uganda in 2007, and the MSc degree in Communication Engineering (Distinction) from the University of Manchester, United Kingdom in 2011. He completed the PhD degree in Electrical and Electronic Engineering from the University of Manchester in 2016. He is a Lecturer in the Department of Electrical and Computer Engineering at Makerere University. His research interests include energy efficient dense heterogeneous cellular networks, applications of machine learning, and the Internet of Things. He is a Member of IEEE.
Simon Peter Miyingo received the B.Sc. degree in Telecommunications Engineering (First Class Honours) from Makerere University, Uganda in 2012 and an MSc. degree in Engineering and Management (Distinction) from the University of Exeter, United Kingdom in 2013. He is passionate about Computer Vision and Deep Learning especially its application in the field of Autonomous Vehicles. He currently works at the United Nations Headquarters in New York.

