


Services on Demand
Article
 English (pdf)
 Article in xml format
 Article references
Indicators

Related links
-
 Cited by Google
 -
 Similars in Google
Share

 Permalink
SAIEE Africa Research Journal
On-line version ISSN 1991-1696
Print version ISSN 0038-2221
SAIEE ARJ vol.114 n.1 Observatory, Johannesburg Mar. 2023
Deep Learning Inter-city Road Conditions in East Africa Focusing on Rwanda for Infrastructure Prioritization using Satellite Imagery and Mobile Data
Davy K. UwizeraI, *; Charles RurangaII, *; Patrick McSharryIII, *
IAlumnus of Carnegie Mellon University and currently pursuing a dual PhD in Data Science at ACE-DS and Internet of Things at ACEIoT
IICurrently the director of ACE-DS
IIIFellow, RSS, Senior Member, IEEE Professor ofmachine learning and big data at Carnegie Mellon University and Oxford University
ABSTRACT
Traditional survey methods for gathering information, such as questionnaires and field visits, have long been used in East Africa to evaluate road conditions and prioritize their development. These surveys are time-consuming, expensive, and vulnerable to human error. Road building and maintenance, on the other hand, has long experienced multiple challenges due to a lack of accountability and validation of conventional approaches to determining which areas to prioritize. With the digital revolution, a lot of data is generated daily such as call detail record (CDR), that is likely to contain useful proxy data for spatial mobility distribution across different routes. In this research we focus on satellite imagery data with applications in East Africa and Google Maps suggested inter-city roads to assess road conditions and provide an approach for infrastructure prioritization given mobility patterns between cities. With increased urban population, East African cities have been expanding in multiple directions affecting the overall distribution of residential areas and consequently likely to impact the mobility trends across cities. We introduce a novel approach for infrastructure prioritization using deep learning and big data analytics. We apply deep learning to satellite imagery, to assess road conditions by area and big data analytics to CDR data, to rank which ones could be prioritized for construction given mobility trends. Among deep learning models considered for roads condition classification, EfficientNet-B3 outperforms them and achieves accuracy of 99%.
Index Terms: Deep-learning, mobile data, classification, vision recognition, big data, satellite imagery
I. INTRODUCTION
A. Background
INTERCITY roads have always been important to our countries' development because they enable capital and labor to move easily through regions. Despite recent efforts to improve inter-city routes to promote trade of goods across East African cities, a significant number of roads directly connecting cities and districts remain in poor condition [22]. Some of these routes are vulnerable to bad weather due to a lack of pavement, making them dangerous to use, especially during rainy seasons [24].
While there are technologies which address routing such as Google Maps, they tend to focus on the fastest route. And options they have for avoiding problematic road conditions such as tolls and railways, may not be applicable in developing countries[3]. Furthermore, in East Africa and most developing countries, the methodology and process for assessing road conditions continues to rely heavily on field visits, surveys, and questionnaires, which take a long time [ ], are expensive, and are vulnerable to human error [ ]. And as a result of the low visibility of these methods, corruption can occur in some cases [27][10].
However, with the rise of digital devices and access to continuously updated satellite imagery, it is possible to support or replace survey based methods with new methods that could enable conducting the assessment of road conditions and infrastructure prioritization more quickly and accurately [30]. This would provide more visibility into road infrastructure budgeting, enhance mobility and reduce travel risk under unfavorable weather conditions. And given the fact that weather patterns have been changing in various parts of the world due to climate change [21], better ways of understanding road conditions could also be very instrumental to transport industry for adaptation planning [9][4].
Other than travel risk, there is also a number of notwell connected routes between neighboring cities, whereby traveling between neighboring cities is only easier if you have to use a third connecting district. These cases are known for hindering economic activities across neighboring cities affecting various sectors such as agriculture, tourism, education, health care etc, where there is always a constant need of moving products or capital from one side to another. Thus, a good way of assessing badly connected city routes would also further contribute to better prioritization of route maintenance and construction across regions for the benefit of various sectors.
We assess route conditions using deep learning methods and satellite imagery and provide a data oriented approach to infrastructure prioritization, using mobility trends extracted from fully anonymized Call Detail Record (CDR).
While machine learning techniques and deep learning methods in particular are now viewed as state-of-art in various fields, their application still lags behind in developing countries, especially in the field of remote sensing [34]. Consequently, some of the machine learning techniques such as deep-learning, which have demonstrated great potential for the analysis and modeling of unstructured data such as imagery, are not widely used in infrastructure related studies in East Africa. This research also seeks to fill this gap by contributing to existing academic knowledge of applying machine-learning techniques to solve real life problems in East Africa using deep learning[12][36] and big data analytics [37][23].
There are a number research works that have been done in line with route conditions assessment [16][2][28], however most of them are not applicable to Africa context, and a few, none to our knowledge, have considered using both CDR based mobility trends and road conditions to provide an infrastructure prioritization approach in East Africa.
In this paper we conduct our research in East Africa, focusing mainly on Rwanda, located at latitude:-1.940278 and longitude:29.873888. We assess 133 inter-city connecting routes suggested by Google Maps API in the country and provide a way for quick road condition classification and infrastructure prioritization using satellite imagery and CDR data.
B. Literature Review
Route infrastructure analysis and classification has been of great interest to the research community around the world especially for infrastructure monitoring and policy making. Given a strong connection of road infrastructure and other economic sectors, patterns underlying efficient and bad road networks and their impact on other sectors, have been studied in addressing multiple research problems across the globe.
Gibbons et al. assessed the impact of construction of new road infrastructure in small towns in Britain. The researchers measured exposure to transport improvement and estimated its impact on employment and labor productivity. The research shows that improved transport infrastructure such as construction of new road schemes has substantial positive effects on area level employment and number of establishments. Where by 1% increase to good road accessibility led to 0.3%-0.5% increase in establishments and employment. The paper also states that there was a strong positive correlation between improved transport infrastructure and output per worker, wages and use of intermediate inputs [11].
Petrucci et al. assessed road conditions during bad weather periods in Italy. Researchers highlight that during bad weather conditions, roads with bad conditions are likely to be affected and cause life threatening risk. Landslides were the most frequent cases. Among the assessed cases 84% of people who were injured were motorists. And of the victims, 50 % were killed along fast-flowing roads [ ]. This highlights the importance of well designed routes and continuous assessment of road conditions.
Oshri et al. used deep learning and satellite imagery to assess infrastructure quality in Africa [25]. While infrastructure quality is one of the important features in United Nations Sustainable Development Goals, the research highlights how monitoring progress in developing regions is still expensive using traditional survey methods and proposed a remote sensing approach using deep learning. By training convolutional neural networks (CNN), researchers were able to predict the ground truth labels of the Afrobarometer round five survey.
The labels comprised Electricity, Sewerage, Piped Walter and Roads. The researchers achieved classification accuracies of 88%, 8 %, 74% and 78% respectively.
Berriel et al. used deep learning for automatic classification of crosswalks [ ]. The research focuses on filling the gap of zebra crossing classification problem for automatic retrieval and annotation of crosswalks satellite imagery data. The results of the research showed that deep learning could be used to perform crosswalk classification with a 97% accuracy on a global scale.
Surface object segmentation has also been done using satellite imagery and deep learning, demonstrating the potential of deep learning models to not only identify, but also detect the boundaries of the object pattern throughout the learning process. Using deep learning and satellite imagery, Bischcke et al. segmented building footprints [6]. The study centered on using a multi-task loss to develop semantic segmentation approaches. The results showed that they were able to boost accuracy by eight percent over current state-of-the-art semantic segmentation methods.
Khan et al. studied automatic target object detection in satellite images [18]. According to the writers, conventional image feature extraction methods including Histogram of Oriented Gradients, Gabor Feature, and Hough Transformation do not work well for large datasets with varying sizes, orientations, and noisy backgrounds. They propose using CNN to process the set of target object pixels positions using an edge boxes method. Van also used YOLT (you just look twice) CNN architecture to identify small and large objects in satellite imagery, such as vehicles, planes, boats, buildings, and airports, more quickly [35].
There are various ways of analyzing and classifying infrastructure to improve upon the traditional use of surveys.
Cole et al. conducted a research on the analysis and detection of power outages in urban areas that may appear as a result of natural and anthropogenic hazards damaging physical infrastructure. To address this researchers applied a feed forward neural network model on night light satellite data and locally-relevant geo-spatial data, achieving Pearson coefficients between 0.48 and 0.58. Cadamuro et al. assess road infrastructure quality in Kenya using satellite imagery. The researchers demonstrate how deep learning methods on satellite imagery could be used for assigning grades on road infrastructure in developing countries. In this paper the grades considered were great, good, fair, bad, poor [8].
Khalil et al. assessed infrastructure growth in Dubai using multi-temporal satellite imagery. The researchers use supervised and unsupervised learning classification methods such as Jenks Natural Breaks Classification method, with image processing to detect locations which experienced massive growth of infrastructure in the city [ ]. The results of the research show that one could confidently quantify infrastructure growth using satellite imagery and machine learning.
Clearly, a great deal of research has gone into using deep learning on satellite imagery, and the findings have been remarkable as compared to conventional image classification and detection methods. In conclusion, as compared to conventional field-intensive survey approaches, the combination of deep learning and satellite imagery has proven to be very cost-effective and less time-consuming.
In this research we seek to use deep learning methods for classification of roads in East Africa. The four categories considered are (1) paved big road; (2) paved small road; (3) not-paved big; (4) not-paved small (5) industrial zone. In the following section we discuss our methodology starting with the exploration of our data. We also use CDR data to assess infrastructure prioritization for not-paved roads given mobility patterns.
II. Methodology
A.Data
Satellite imagery used in this research is retrieved from Google earth which is supported by Data SIo (Scripps Institution of oceanography), NoAA (National oceanic and Atmospheric Administration), US. Navy (United States Navy), NGA (National Geospatial-Intelligence Agency), GEBCo (General Bathymetric Chart of the oceans), Image Landsat, and Image IBCAo (International Bathymetric Chart of the Arctic ocean). For resolution, we used a 1000 meters eye altitude and a 400 by 400 view per selection.
For mobility trend study, we have used fully anonymized CDR data collected by Rwanda's major network operators (MNOs).
Below we describe and visualize various metrics of the datasets being considered.
B.Roads Data
Using random sampling of spatial route areas, 50,000 thousands images were retrieved under the four road categories: paved big (5000), paved small (5000), not-paved big (10000), not-paved small, (20000). Our target areas were guided by field survey results obtained from Rwanda Transport Development Agency (RTDA) report [ ] on spatial distribution of inter-city routes in Rwanda as highlighted in the map below, Figure 1.

Using human review and spatial distribution of roads per area as displayed in Figure 1, and their associated legend, images which were labeled as paved-big, Figure 2, were district class road 1. Most of these consisted of big roads within districts.

Labels for paved-small were given to areas marked as only paved in Figure 1, which consisted of mainly small sized paved roads, Figure 3.
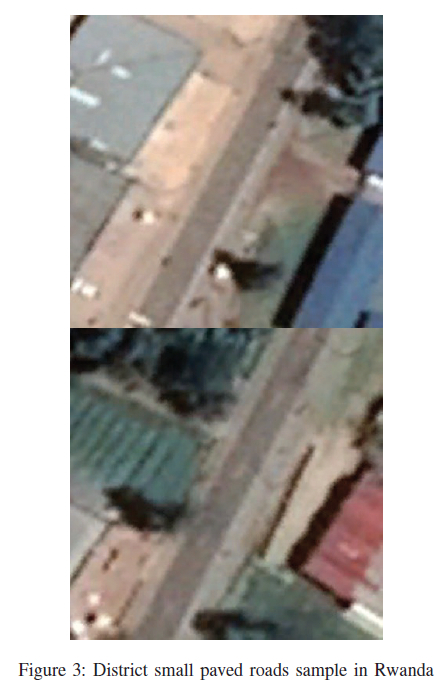
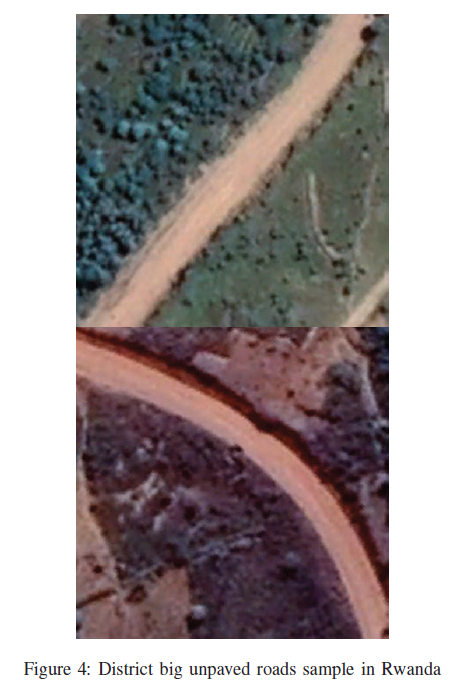
Images which were labeled not-paved-big were roads labeled as unpaved in Figure 4, but which had bigger width size than paved-small class, Figure 3.
Unpaved roads with same or less than the size of paved-small roads class, Figure 3, were marked as unpaved-small, Figure 5.

C. CDR Data
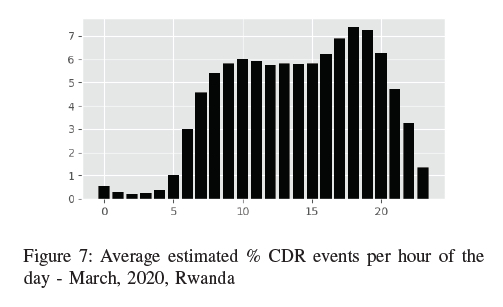
We analyze 3,01 billion of fully anonymized CDR events in March, 2020 with a total of 17 million subscribers. It is towards the end of this month that the first lock-down was introduced in the country due to the pandemic, Covid19, on 21 of March. Hence the insights from this month will capture both before and after lockdown announcement mobility patterns. CDR data is comprised of many fields, but our field of interest for this research were, msisdn for subscriber ID, tower ID from which the event happened, tower ID and it's latitude and longitude, and date-of-charge timestamp which is basically the timestamp at which the CDR event was charged by the MNOs from subscriber's account. In Figure-6, 7, we visualize CDR events throughout the considered month of March. The results in 7 show that there were more cdr events produced after the announcement of first lock-down due to Covid-19, perhaps as a result of the cashless oriented policies that followed the announcement in favor of mobile transactions.

D.Retrieving Inter-districts Routes
To focus on inter-city connecting routes, we use Google Maps APIs to retrieve route positions for all pairs of districts with associated travel time and distance. Travel time and distance retrieved from Google Maps, together with classification of road conditions using satellite imagery, are used in the localization of not-well connected districts routes. See section II-G, II-C. They were also used in mining CDR data, particularly in checking long trips subscribers have done throughout the day and filter out noise in CDR data. Filtering is done by checking one's traveling speed between two locations. Trips which were above 100KM/h were removed from consideration.
E.Deep Learning
Road conditions are classified using deep learning methods into four categories: paved-big, paved-small, not-paved-big, and not-paved-small. For training, we use MobileNet version 2 (Mobilenet-V2), Inception version 3 (Inceptionv3), Resnet50 version 2 (Resnet50V2), and EfficientNet (EfficientNet-B3) deep neural network architectures. We also adopt deep transfer learning [31] with imagenet pre-trained weights.
1)InceptionV3: The model architecture aims to increase accuracy while minimizing added computation per layer by using factorized convolutional layers and aggressive regular-ization. InceptionV3 architecture is implemented as in Szegedy et al. [29].
2)ResNet50V2: Resenet50V2 is among deep residual network architectures, they focus on learning residual functions rather than learning unreferenced functions. Resnet architectures demonstrated higher accuracy and fast convergence[60]. Resnets models fall in different categories depending on the number of layers used in model building. The most common are Resnet18, Resnet34, Resnet50, Resnet101 and Resnet153 [13]. In this research we use Resnet50V2 [ ]. Resnets add non-linearity between layers and the main difference between Resnet version 1 and Resnet version 2 is the removal of non-linearity in the last layer on version 2. This was done to promote easy continuous connection in a form of identity connections. Resnet architecture used are presented in He et al. [14].
3)EfficientNet-B3: EfficientNets focus on efficient scaling of deep learning modeling [ ]. While some of the mod-els have interchangeably focused on depth and width based scaling. EfficentNet uniformly scales each dimension with a fixed set of scaling coefficients [15]. The proposed method of scaling coefficients in EfficientNets was proved to outperform conventional methods which use arbitrarily scaling of network dimensions, such as focusing only on width, depth and resolution [32]. There are multiple structures of EfficientNets, in this research we used EfficientNet-B3.
As previously mentioned, InceptionV3, Resnet50V2 and EfficientNet-B3 are used as our base-models for our research task. The models are initiated without the final layer (head) and imagenet weights are used with these models to speed up learning and minimize risk of convergence to local minimum using transfer learning. Then we add one dense layer of size 512 with sigmoid activation and the output layer with softmax activation.
4) Compactness and Separability Visualization: To visually understand the separability and compactness of considered predictive models, we use t-stochastic neighborhood embed-dings (t-SNE) [ ]. t-SNE converts similarities between data points to joint probabilities.
F. Origin Destination Matrices
There are different ways for computing OD matrices. Some approaches consider computing home location, where home location is defined as the position where you were most spotted in specified period between 7PM and Midnight, and then joining one's home-location against every other location they are spotted in other than their home-location. This is done sequentially during the day.
Others match one's previously spotted location from the start of day against subsequent locations. Both scenarios could have more complex variants depending on the target goal of the OD matrix [33]. But in most cases, the end goal is to maximize accuracy of the estimated travel location demand, and make sure to filter out data points that could introduce noise in the dataset. Most of the noise in the case of CDR data, comes in when subscribers produce CDR activities during travel not necessarily because they have stopped by that particular location where the activities happened.
To address this for inter-city trips extraction, We divide the day in three window times, midnight to 10am as window 1, 10am to 4pm, window 2 and 4pm to midnight, window 3, Figure 8, and extract OD matrices based on these three windows.

G. Localization of not-well connected Neighboring Districts Routes
To identify neighboring districts with not-well connected routes, we extract travel time between neighboring districts from Google Maps APIs and find a trio districts (ABC) where travel time tAB - tAC + tCB < t.
Implying that it takes longer to travel directly from A to B than traveling from A through C to B. Cases where this is true, districts A to B, are likely to have no direct connecting routes or just have bad designed connecting routes, Algorithm-1.

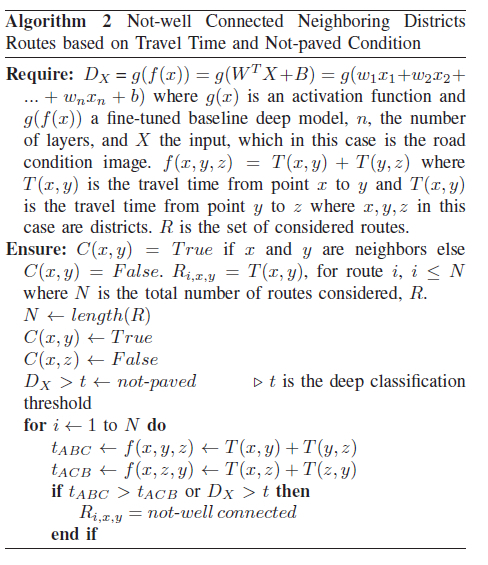
Besides, neighboring districts connected with a not-paved road are automatically included among districts with notwell connected routes , Algorithm-2.. We use deep learning methods previously discussed in section II-E, to identify pairs of districts with not-paved connecting routes.
H. Route Infrastructure Prioritization
Given not-well connected districts identified using methodology in section II-G, let total of movements between a pair of not-well connected districts, AB, over total movement between neighboring districts be MAB, total movement in and out A be MA, total movements in and out B be MB.
Let average distance between A to 3 most travel location cities be AVDA and average distance between B to 3 most travel location cities be AVDB.
Let total movements in and out of districts be TM, total movement between pairs of neighborign districts be TNDM, social economic index (SEI) and Financial Economic Index (FEI).
There are multiple approaches of computing SEI and FEI, but as indicated by Marcelo et al. [20], SEI, Formula-1, is composed mainly of the following indicators: direct jobs created (DJC), number of direct beneficiaries (NDB), people affected by land use restructuring (PA), possible cultural and environmental risks and pollution in terms of C02. On the other hand FEI, Formula-2, mainly consist of financial internal rate of return (RR), multiplier effects (ME), Priority Economic Zones (PE), Implementation Risk (IR), Complementary/Competition effects (CC). For more info on SEI and FEI implementation see Marcelo et al. [20].

While most of researches focus mainly on SEI and FEI to build infrastructure prioritization score of which variables, in most cases, consist of qualitative variables [ ], we propose a novel approach for inter-city route infrastructure prioritization which introduces a quantitative component that takes into consideration movements in and out, visual road condition, travel time distance between adjacent cities, and their distances from main cities such as capital cities.
We compute route prioritization score (RPS) for route AB as,
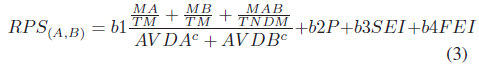
Whereby coefficient c, is the distance disadvantage from famous travel location cities and b are weights to considered variables. P is an output of if road paved or 1 if not paved, derived from a classification deep learning model,  ) where g(x) is an activation function and g(f (x)) a fine-tuned baseline deep model, n, the number of layers, and X the input to the model, which in this case is the road condition image.
For the scope of this research we keep b1 = 1, b2 = 0,1 and b3 = b4 = 0. With b2 = 1, non-paved roads are given high priority, whereas for b2=0, both paved and non-paved roads are given equal priority.
To allow diversification while setting the 3 most travel locations, cities in the capital city are considered as one city. Since cities in Kigali are combined on AVDA and AVDB, we take the shortest distance to one of the three cities in Kigali. Algorithm-3, highlights the flow of the proposed approach.

I. Testing
The dataset, as described in II-A subsection, is divided into training and testing dataset. 70% is used for training and 30% is used for testing for our target models. The test results are then used to evaluate both accuracy and speed in order to draw conclusions about the best model to recommend for policymakers and practitioners.
III. Results &Discussion
A. Modeling
Each model was trained on batch size 32, and 16 epochs with weight decay of 5e-04 and the overall accuracy of EfficientNet-B3, InceptionV3 and Resnet50 is 93%, 95%, 98% respectively. Input shape used was 224x224 for EfficientNet-B3 and Resnet50, 299x299 for Inception, 300x300 for EfficientNet-B3. In the following parts of this section we discuss in detail the classification results of our three target models.
1) InceptionV3: Below we present detailed classification results of InceptionV3, Table-I.
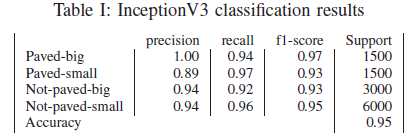
Inception scores 95% overall accuracy on the four road condition categories. Paved-big, Not-paved-small and Not-paved small areas are the most well classified categories by the model. Table-I.
2) ResNet50V2: Same as in the previous two sections, detailed classification results of Resnet50V2 are presented in this section, Table-II.

ResNet50V2 scores 97% overall accuracy on the four road condition categories. Paved-big, Not-paved-small and Not-paved-big areas are the most well classified categories by the model. Table-I.
3) EfficientNet-B3: Below we present detailed classification results of EfficientNet-B3, Table-III.

The results in Table-III show that EfficientNet-B3 scores 99% overall accuracy on the four road condition categories. Paved-big and Paved-small are the most well classified categories by the model.
Table-II shows that EfficientNet-B3 outperforms the rest of deep learning models by keeping a high accuracy across categories, especially for paved-big, not-paved-big categories.
B. Mobility Analytics
Using fully anonymized CDR data and the approach discussed in section II-F, we observe the number of trips from origin district, where trips originated from, to destination district, where trip ended. Below we visualize the average percentage volume of origin to destination daily trips per pair of districts, Figure 9. A total number of 1,333,243 trips was estimated for all pairs of districts.

The results show that capital city districts, Gasabo, Kicukiro, Nyarugenge, have more trips in and out, compared to the rest of districts in the country. In Table IV, we combine capital city districts into one city, Kigali city, and rank the top 10 districts per number of incoming trips to have the overall picture of famous travel location preference in the country.

C. Route Infrastructure Prioritization
Considering neighboring districts, we use Google Maps APIs to extract route location, distance and time to travel from one district to its neighboring districts. Then we apply the algorithm discussed in the methodology section II-G to localize not-well connected inter-city routes for neighboring districts, Figure 10.

Results show that districts which are not well connected between them are: Bugesera-Kamonyi, Nyanza-Gisagara, Nyamagabe-Nyamasheke, Nyabihu-Rutsiro, Nyagatare-Gicumbi. Table V.

Using inter-city suggested roads retrieved for neighboring districts, we assess not-paved roads, using the best performing model in section II-E, EfficientNet-B3. Neighboring districts connected with a not-paved road are automatically included among districts with not-well connected routes. See results in Figure 11.

By doing this, the following districts are added to neighboring districts with not-well connected routes: Nyabihu-Gakenke, Ngororero-Gakenke, Ngororero-Karongi, Nyamagabe-Karongi, Bugesera-Nyanza, Ruhango-Karongi, Rusizi-Nyaruguru. Table VI.

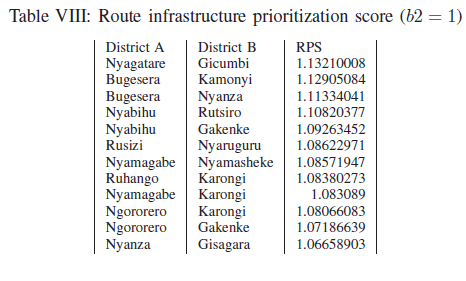
Given an identified pair of districts with bad road conditions we compute RPS as discussed in section II-H to assess which route could be given high priority for construction, upgrade or redesign. Table VII. Given that Rwanda is a small country, we set the distance disadvantage coefficient from famous travel location cities to 0.

Results show that top five routes which would be prioritized using this approach are, Nyagatare-Gicumbi, Bugesera-Kamonyi, Bugesera-Nyanza, Nyabihu-Rutsiro, Nyabihu-Gakenke. With 62 = 1, for our case, only the scores would be affected but not the ranks as all of the roads selected using Algorithm- , turned out to be also unpaved, Table VIII.
IV. Conclusion
Assessing road conditions and prioritizing their construction in East Africa, has long relied on the use of structured data and traditional survey approaches for collecting information such as questionnaires, interviews and field visits. These types of surveys are often slow, costly and prone to human error. Using Google Maps APIs we retrieve connecting routes location between neighboring districts to identify not-well connected routes given travel time and road conditions. By using Deep Learning methods and satellite imagery, in this research study we are able to assess with 99% accuracy four different types of road conditions. Namely, Paved-big, Paved-small, Not-paved Big, Not-paved-small. The best performing model for assessing these road conditions in terms of an accuracy of 99% was EfficientNet-B3.
Given districts with bad road conditions and not-well connected routes, we use extracted mobility patterns from CDR data to provide a data oriented method on how efficiently their construction and maintenance could be prioritized. Among not-well connected routes the following pair of districts rank higher in terms of construction and maintenance prioritization: Nyagatare-Gicumbi, Bugesera-Kamonyi, Bugesera-Nyanza, Nyabihu-Rutsiro, Nyabihu-Gakenke.
The results show that given a specific country in East Africa, one could assess with confidence inter-city road conditions suggested by Google Maps API and rank them for infrastructure prioritization.
On the other hand this highlights that Google Maps API does not always suggest the roads with better conditions in the context of Africa (paved vs not-paved), rather the ones with less travel time. With the methodology provided in this research it's possible to find a better traveling route network by avoiding roads with bad conditions given classification results.
Classification results in this research express that the deep learning models used were able to learn different patterns independently by observing the ranking accuracy per category. Additional studies of blended optimal deep model architectures for classification of more variety of road conditions would be interesting to explore.
REFERENCES
[1] Rwanda Transport Development Agency. Map of Classified National and District Roads Class 1 Network 2020. https://www.rtda.gov.rw. [Online; accessed March-15-2021]. 2020.
[2] Sruthy Agnisarman et al. "A survey of automation-enabled human-in-the-loop systems for infrastructure visual inspection". In: Automation in Construction 97 (2019), pp. 52-76. [ Links ]
[3] Facundo Alvaredo et al. World inequality report 2018. Belknap Press, 2018.
[4] Kathryn A Arnold, Alize Le Roux, and Sibusisiwe A Makhanya. "Implementing a GIS based methodology for determining highly vulnerable rural access roads to a changing climate in Ethiopia". In: (2018).
[5] Rodrigo F Berriel et al. "Deep learning-based large-scale automatic satellite crosswalk classification". In: IEEE Geoscience and Remote Sensing Letters 14.9 (2017), pp. 1513-1517. [ Links ]
[6] Benjamin Bischke et al. "Multi-task learning for segmentation of building footprints with deep neural networks". In: 2019 IEEE International Conference on Image Processing (ICIP). IEEE. 2019, pp. 1480-1484.
[7] Kenneth K Boyer, John R Olson, and Eric C Jackson. "Electronic surveys: Advantages and disadvantages over traditional print surveys". In: Decision Line 32.4 (2001), pp. 4-7. [ Links ]
[8] Gabriel Cadamuro, Aggrey Muhebwa, and Jay Taneja. "Assigning a grade: Accurate measurement of road quality using satellite imagery". In: arXiv preprint arXiv:1812.01699 (2018).
[9] Xavier Espinet and Julie Rozenberg. "Prioritization of climate change adaptation interventions in a road network combining spatial socio-economic data, network criticality analysis, and flood risk assessments". In: Transportation Research Record 2672.2 (2018), pp. 4453.
[10] Mihaly Fazekas and Bence Toth. "The extent and cost of corruption in transport infrastructure. New evidence from Europe". In: Transportation research part A: policy and practice 113 (2018), pp. 35-54.
[11] Stephen Gibbons et al. "New road infrastructure: the effects on firms". In: Journal of Urban Economics 110 (2019), pp. 35-50. [ Links ]
[12] Yanming Guo et al. "Deep learning for visual understanding: A review". In: Neurocomputing 187 (2016), pp. 27-48. [ Links ]
[13] Kaiming He et al. "Deep residual learning for image recognition". In: Proceedings ofthe IEEE conference on computer vision and pattern recognition. 2016, pp. 770778.
[14] Kaiming He et al. "Identity mappings in deep residual networks". In: European conference on computer vision. Springer. 2016, pp. 630-645.
[15] Yihui He et al. "Amc: Automl for model compression and acceleration on mobile devices". In: Proceedings of the European Conference on Computer Vision (ECCV). 2018, pp. 784-800.
[16] Ilaria Henke et al. "Decision-making in the transport sector: A sustainable evaluation method for road infrastructure". In: Sustainability 12.3 (2020), p. 764. [ Links ]
[17] Mohamad Ali Khalil et al. "Multi-Temporal satellite imagery for infrastructure growth assessment of Dubai City, UAE". In: MATEC Web of Conferences. Vol. 120. EDP Sciences. 2017, p. 09006.
[18] Muhammad Jaleed Khan et al. "Automatic target detection in satellite images using deep learning". In: J. Space Technol 7.1 (2017), pp. 44-19. [ Links ]
[19] Laurens van der Maaten and Geoffrey Hinton. "Visualizing data using t-SNE". In: Journal ofmachine learning research 9.Nov (2008), pp. 2579-2605.
[20] Darwin Marcelo et al. "Prioritizing water supply infrastructure investments in Sri Lanka: an application of the world bank infrastructure prioritization framework". In: World Bank Policy Research Working Paper 8331 (2018).
[21] Bongeka L Mbutuma, M Mostafa Hassan, and DK Das. "Impact of Climate Change on Traffic Controls in Developing Countries". In: International Congress and Exhibition" Sustainable Civil Infrastructures: Innovative Infrastructure Geotechnology". Springer. 2018, pp. 46-57.
[22] Zeynu Mohammed, Mesfin Mekonnin, and Abera Jaleta. "Factors affecting logistics performance empha-sis on transport function: a study on east africa bottling sc jimma branch". PhD thesis. 2020. [ Links ]
[23] Mama Nsangou Mouchili, John William Atwood, and Shadi Aljawarneh. "Call data record based big data analytics for smart cities". In: Proceedings of the Second International Conference on Data Science, E-Learning and Information Systems. 2019, pp. 1-7.
[24] Esdras Ngezahayo, Gurmel S Ghataora, and Michael PN Burrow. "Factors Affecting Erosion in Unpaved Roads". In: Proc. of the 4th Intern. Conf. on Geotech-nical Research and Eng. 2019, pp. 7-9.
[25] Barak Oshri et al. "Infrastructure quality assessment in africa using satellite imagery and deep learning". In: Proceedings of the 24th ACM SIGKDD International Conference on Knowledge Discovery & Data Mining. 2018, pp. 616-625.
[26] O Petrucci and AA Pasqua. "Damaging events along roads during bad weather periods: a case study in Calabria (Italy)". In: Natural Hazards and Earth System Sciences 12.2 (2012), pp. 365-378. [ Links ]
[27] Ming Shan et al. "Investigating the underlying factors of corruption in the public construction sector: Evidence from China". In: Science and engineering ethics 23.6 (2017), pp. 1643-1666. [ Links ]
[28] Marcin Staniek. "Road pavement condition as a determinant of travelling comfort". In: Intelligent Transport Systems and Travel Behaviour. Springer, 2017, pp. 99-107.
[29] Christian Szegedy et al. "Rethinking the inception architecture for computer vision". In: Proceedings of the IEEE conference on computer vision and pattern recognition. 2016, pp. 2818-2826.
[30] Haifa Tamiminia et al. "Google Earth Engine for geobig data applications: A meta-analysis and systematic review". In: ISPRS Journal of Photogrammetry and Remote Sensing 164 (2020), pp. 152-170. [ Links ]
[31] Chuanqi Tan et al. "A survey on deep transfer learning". In: International conference on artificial neural networks. Springer. 2018, pp. 270-279.
[32] Mingxing Tan and Quoc Le. "Efficientnet: Rethinking model scaling for convolutional neural networks". In: International Conference on Machine Learning. PMLR. 2019, pp. 6105-6114.
[33] Reza Tolouei, Stefanos Psarras, and Rawle Prince. "Origin-destination trip matrix development: Conventional methods versus mobile phone data". In: Trans portation research procedia 26 (2017), pp. 39-52. [ Links ]
[34] Grigorios Tsagkatakis et al. "Survey of deep-learning approaches for remote sensing observation enhancement". In: Sensors 19.18 (2019), p. 3929. [ Links ]
[35] Adam Van Etten. "You only look twice: Rapid multi-scale object detection in satellite imagery". In: arXiv preprint arXiv:1805.09512 (2018).
[36] Athanasios Voulodimos et al. "Deep learning for computer vision: A brief review". In: Computational intelligence and neuroscience 2018 (2018).
[37] Li Zhu et al. "Big data analytics in intelligent transportation systems: A survey". In: IEEE Transactions on Intelligent Transportation Systems 20.1 (2018), pp. 383-398. [ Links ]
* All authors are with the African Center of Excellence in Data Science (ACE-DS), University of Rwanda.

Davy K. Uwizera is a Masters of Science in Information Technology graduate from Carnegie Mellon University, class of 2017, currently pursuing a dual PhD in data science at Africa Center of Excellence in Data Science and a PhD in Internet of Things at Africa Center of Excellence in Internet of Things. His current research interests include unstructured data mining, deep learning, machine learning edge and big data.

Charles Ruranga Received the B.Sc. degree in economics from National University of Rwanda, Rwanda, 2001, M.Sc. degree in economics, University of Montreal, Canada, 2007. He received his PhD in statistics from Makerere University, Uganda in 2017. His research interests include, but are not limited to, econometric spatial analysis, time series and multivariate signal processing. He is currently the director of the African Center of Excellence in Data Science (ACE-DS).

Patrick McSharry (Senior Member of the IEEE) He received the B.A. degree in theoretical physics in 1993 and the M.Sc. degree in electronic and electrical engineering in 1995 from Trinity College Dublin, Dublin, Ireland. He received the D.PHil. degree in mathematics from the university ofOxford, U.K., in 1999. He is currently visiting professor at Carnegie Mellon University Africa and a member of the Kigali Collaborative Research Center, Having served 22 years at Oxford University, McSharry remains affiliated with the Oxford Man Institute of Quantitative Finance, the Mathematical Institute, the Department of Computer Science, and the Oxford Internet Institute. He is a Fellow of the Royal Statistical Society, Senior Member of the IEEE and Senior Academic Member of the Willis Research Network.

