


Serviços Personalizados
Artigo
 Inglês (pdf)
 Artigo em XML
 Referências do artigo
Indicadores

Links relacionados
-
 Citado por Google
 -
 Similares em Google
Compartilhar

 Permalink
SAIEE Africa Research Journal
versão On-line ISSN 1991-1696
versão impressa ISSN 0038-2221
SAIEE ARJ vol.113 no.4 Observatory, Johannesburg Dez. 2022
Classifying Economic Areas for Urban Planning using Deep Learning and Satellite Imagery in East Africa
Davy K. UwizeraI; Charles RurangaII; Patrick McSharryIII
IAlumnus of Carnegie Mellon University and currently pursuing a dual PhD in Data Science at ACE-DS and Internet of Things at ACEIoT
IICurrently the director of ACE-DS
IIIFellow, RSS, Senior Member, IEEE; Professor of machine learning and big data at Carnegie Mellon University and Oxford University
ABSTRACT
Monitoring and assessing the distribution of economic areas in East Africa such as low and high income neighborhoods, has typically relied on the use of structured data and traditional survey approaches for collecting information such as questionnaires, interviews and field visits. These types of surveys are slow, costly and prone to human error. With the digital revolution, a lot of unstructured data is generated daily that is likely to contain useful proxy data for many economic variables. In this research we focus on satellite imagery data with applications in East Africa. Recently East African cities have been developing at a fast pace by building new infrastructure and constructing innovative economic zones. Moreover with increased urban population, cities have been expanding in multiple directions affecting the overall distribution of areas with economic activity. Automatic detection and classification of these areas could be used to inform a number of policies such as land usage and could also assist with policy enforcement monitoring. On the other hand, the distribution of different economic areas in a specific city could provide proxies for various economic development variables such as income distribution and poverty metrics. In this research, we apply deep learning techniques to satellite imagery to classify and assess the distribution of various economic areas of a specific region for urban planning. By benchmarking performance against various state-of-art models, results show that the proposed deep learning techniques yielded superior performance with an f1-score of 99%.
Index Terms: classification, deep learning; satellite imagery; transfer learning; urban planning; remote sensing; monitoring.
I. INTRODUCTION
ECONOMIC areas range from low and high income neighborhoods, industrial zones, trade areas, schools etc [59][62][35]. There are various geographical factors and economic drivers which influence the distribution of economic areas including government policies. The spatial distribution of various economic areas has been used in various urban economic planning [36] such as transport [47], city expansion [45] and land usage policies [63]. Moreover, their distribution influences daily individual and household economic decisions depending on their corresponding geographical location [43], hence, indirectly influencing a number of macro-economic variables. The analysis and monitoring of the spatial distribution of these areas in East Africa has previously relied on the use of structured data and traditional approaches for data collection such as paper questionnaires, face-to-face interviews and field visits [3]. These survey methods are prone to human error and are often slow and costly [14]. Yet, with the digital revolution a lot of unstructured data is generated daily that is likely to contain useful proxy data in line with various economic variables, and could be analyzed to support existing policy and generate new insights [12]. The sources of data range from daily captured images by individuals, government, social media as well as satellite imagery, which is our target data source in this research.
There are different types of satellite imagery data to consider such as night-time lights [49], weather estimates [19], vegetation indices [67] and infrastructure [51]. There are various patterns and relationships that have been identified from big data sources which can be utilized to address various challenges, resulting in different use cases. This includes, but is not limited to, transport demand prediction [50], conflict outbreak monitoring [38], disease outbreak prediction and spatial area labelling [40].
Spatial area labelling and access to digital maps have recently inspired innovations in technology, and contributed various use cases such as self driving cars [75] and automatic optimal routing [41]. Currently digital map labeling could act as the ground truth for validation assessment or provide a secondary data source for various research studies in line with spatial areas such as economic area classification, which we will focus on in this study.
Using deep learning and transfer learning [66], our research seeks to classify spatial economic areas under five categories (residential high income, residential middle income, residential low income, commercial buildings and industrial areas) in East Africa, by focusing on Rwanda. East African countries have promoted infrastructure development with various programs initiated to facilitate city infrastructure expansion. Some of the initiatives included dispatching big government institutions in various locations of city outskirts rather than having them condensed in one central place of the city [4]. Moreover there has been enormous effort to renovate cities with new master-plans to promote more infrastructure and greenness. However, reaching sustainable urban development has been a challenge in developing countries [16].
With rapid urban migration in the region, under the absence of a stable economic base, there has been an increasing trend of overpopulation in urban areas, resulting in inactive rural areas with shifting demographics, decreased tax base and slum formation in the city [ ]. Slums affect the expansion of urban infrastructure in various ways. Normally they provide homes for many families on a very small area of land. Hence in most cases, the government has to expropriate or find ways to relocate various families that would be affected in order to expand the infrastructure in the area. Hence, the ability to analyze and classify spatial economic areas will have various applications in facilitating monitoring such as country infrastructure trends and distribution of different types of residential areas and could guide various policies in urban planning.
As stated previously, urban economic monitoring has been relying on traditional paper surveys and questionnaire methods in most developing countries. Although this has been helpful for various case studies, there are a number of down-sides as we highlighted such as timeliness, high cost, human error and enumerator fraud. By using artificial intelligence techniques such as machine learning, it is possible to utilize satellite imagery and in parallel a number of these issues are automatically mitigated.
While machine learning techniques and deep learning methods in particular are now viewed as state-of-art in various fields, their application on unstructured proxy data such as imagery for economic activities monitoring is still limited in developing countries [ ]. Consequently, some of the machine learning techniques such as deep-learning, which have demonstrated great potential for the analysis and modeling of unstructured data, are not widely used in economic studies. This research also seeks to fill this gap by contributing to existing academic knowledge of applying machine-learning techniques to solve real life problems in sub-saharan Africa using deep learning [22][72] and transfer learning [52][60].
A. Literature Review
Economic area analysis and classification have been of great interest to various researchers especially for economic monitoring and policy making [54]. Patterns underlying the formation of economic areas and the resulting differences between associated economic classes have been used in addressing a multitude of research problems across the globe in various sectors.
Czapiewski et al. assessed the impact of location on the role of small towns in regional development in poland [17]. The researchers demonstrate how depending on the location of the small towns, they can play various roles such as connecting rural and urban areas and serving as a local engine for economic development. By classifying eighty six target towns in three categories, small, medium-sized and big and using a two step methodology [48], it was found that the location of small towns has a significant impact on boosting various economic factors such as education, access to health care and cultural activities [17].
Location is one of the important features in spatial area classification and has been used within other case studies. Lamnisos et al. analyzed the correlation between geo-demographic areas and mortality. Using a Poisson distribution for mortality estimation and K-means for area classification the researchers found, at 95% confidence interval, that rural areas and semi-rural areas had 44% and 36% higher premature mortality rate respectively compared to metropolitan areas[34]. Further details of K-means and Poisson log-linear models can be found in [31][20]. Bafíski et al. conducted research on the classification of rural areas for land usage policy in Poland. By investigating economic structure, transport-wise accessibility and development dynamics, the authors estimated the state of development of rural areas [5].
Spatial distribution and classification of economic areas is a broad subject with great relevance for the monitoring of economic activities. Barbero et al assessed the correlation between wages and the spatial distribution of various industries in general equilibrium trade models [6] for asymmetric markets [9]. Li et al [37] highlighted the geographical location determinants of high-growth firms by assessing factors associated with their emergence. Basu et al, analyzed house prices and spatial autocorrelation [8]. Using estimated generalized least squares [9] their research results showed that there is statistically significant spatial autocorrelation for house transaction prices. Yoo et al, also analyzed the spatial autocorrelation and spatial heterogeneity of house prices controlled by the presence and absence of agricultural conservation easement policy [77]. Some researchers have also studied the relationship between spatial distribution of neighborhoods and violent crimes such as Barton et al [7], Papachristos et al [53], He et al [23] hence demonstrating that violent crimes influence various economic activities in corresponding locations.
While the location of economic areas has an impact on economic activities there are also factors influencing the formation of economic areas. Hodgson highlighted some of these factors such as transport infrastructure [28]. The paper shows that there was a significant effect of railroad construction on the geographical distribution of towns in the Western states of the USA. Clausing et al measured the impact of taxes and big firms headquarters locations [15]. Other factors affecting the distribution of economic areas include but are not limited to rural-urban migration[55], natural disasters[ ] and weather conditions [56].
There are various ways of analyzing and classifying economic areas that aim to improve upon the traditional use of surveys. Kussul et al used deep learning, specifically convolution neural networks (CNN), to classify land cover and crop types from satellite imagery [33]. The results of their research showed that deep learning outperformed random-forest with a significant margin. Sidike et al applied deep learning on satellite imagery to label diverse agricultural landscapes [61] for field management. The paper expresses how remote sensing technologies are cost-effective compared to traditional mapping practices with intensive field surveys and proposes a deep learning method for mapping 19 different agricultural landscapes. The model accuracy is compared against support vector machines and random-forest. Deep learning scored the highest accuracy with 6%.
Oshri et al used deep learning and satellite imagery to assess infrastructure quality in Africa [51]. While infrastructure quality is one of the important features in United Nations Sustainable Development Goals, the research highlights how monitoring progress in developing regions is still expensive using traditional survey methods and proposed a remote sensing approach using deep learning. By training convolutional neural networks researchers were able to predict the ground truth labels of the Afrobarometer round five survey. The labels comprised Electricity, Sewerage, Piped Walter and Roads. The researchers achieved classification accuracies of 88%, 86%, 74% and 78% respectively.
Berriel et al used deep learning for automatic classification of crosswalks [ ]. The research focuses on filling the gap of zebra crossing classification problem for automatic retrieval and annotation of crosswalks satellite imagery data. The results of the research showed that deep learning could be used to perform crosswalk classification with a 97% accuracy on a global scale.
Satellite imagery and deep learning have also been used in surface object segmentation, showing the ability of deep learning models to not only classify, but also understand the boundaries of the object pattern in the learning process. Bishcke et al segmented building footprints using deep learning and satellite imagery [11]. The research focused on improving semantic segmentation approaches with a multi-task loss. The results showed they were able to increase accuracy by a significant eight percent on existing state-of-art methods in semantic segmentation.
Khan et al conducted research on automatic target object detection in satellite images [70]. The authors highlight how traditional image feature extraction such as Histogram of Oriented Gradients, Gabor Feature and Hough Transformation don't work well for huge data of varying size, orientation and noisy background. They propose an edge boxes method using a convolution neural network to filter the set of target object pixels position. Van also used a deep learning method called YOLT (you only look twice) for faster detection of small and big objects in satellite imagery such as vehicles, airplanes, boats, buildings and airports [32].
Sanya et al [58], used convolution networks on satellite imagery to identify patterns in urban housing density in developing countries by classifying satellite imagery into high-density, medium density, and low density.
Clearly a lot of research has been done in line with the use of deep learning on satellite imagery and yielded tangible results over traditional image classification and detection methods. In summary, the combination of deep learning and satellite imagery has proved to be very cost-effective and less time consuming compared with traditional field intensive survey methods.
In this research we seek to introduce customized deep learning methods for classification of economic areas categories in East Africa. The five categories considered are (1) residential low-income; (2) residential middle-income; (3) residential high-income; (4) commercial buildings; and (5) industrial zone.
In addition to the proposed methods, to our knowledge no research has focused so far on economic areas classification in East Africa in terms of high, middle, low income residential areas, commercial and industrial zones.
In the following section we discuss our methodology starting with the exploration of our data.
II. Methodology
A. Data
In this research we use satellite imagery data retrieved from Google earth 2021 which is supported by Data SIO (Scripps Institution of Oceanography), NOAA (National Oceanic and Atmospheric Administration), US. Navy (United States Navy), NGA (National Geospatial-Intelligence Agency), GEBCO (General Bathymetric Chart of the Oceans), Image Landsat, and Image IBCAO (International Bathymetric Chart of the Arctic Ocean).
Using random sampling of spatial area in Kigali per target area, 342,843 thousands images were retrieved under the five categories: residential high income (78941), residential low income(162501), residential middle income(101401), commercial building, (67400) and industrial zone,(24400). While it is clear that areas considered are not evenly represented, data augmentation and within-sample random re-sampling was applied to boost the sample size of small-population classes, see Section-II-B. For the industrial zone, we also included some images from Nairobi, Kenya industrial spatial area. The average number of samples for a category is 86929. The size of the sample per category is proportional to the size of the spatial target area considered per category. Kigali is located at latitude:-1.985070 and longitude:-1.985070, coordinates. Nairobi is located at latitude:-1.286389 and longi-tude:36.817223, coordinates.
Our target areas for residential areas were mainly guided by field survey results obtained from Uwayezu et al [69] on spatial distribution of the affordable housing projects and informal settlements in Kigali city as highlighted in the map below. Figure-1.
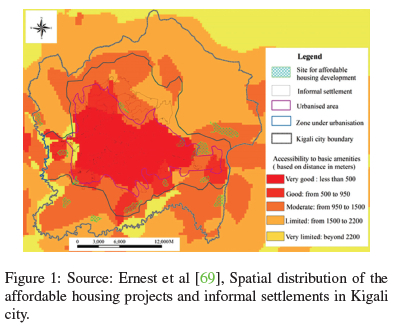
Using human review and target areas in Figure-1, images which were labeled as low incomes, Figure-2, were mostly slums without easy access to main roads, minimal or no neighborhood road infrastructure and primarily consisted of small compounds.

Labels for middle income areas were given to images which consisted of bigger compounds and evidence of road access.
Furthermore there were a few houses which share some of the characteristics of the houses that were found in the low residential income category, Figure-3.

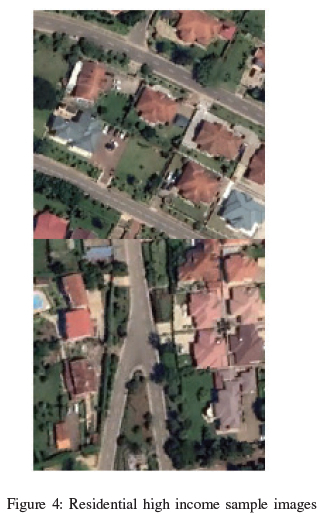
Images which were labeled under residential high income had easy access to roads, bigger compounds and had modern roofs overall from the space view. Figure-4
Images containing a collection of skyscrapers and other low elevation buildings, mainly in the central business district and towns were labeled as commercial buildings. Figure-5

Images labeled as industrial zone category are typically made up of large flat buildings. Most of these images were retrieved from known industrial zones locations in East Africa focusing on Kigali and Nairobi.
B. Methods and Proposed Work
1) Baseline Models: Deep learning methods are used to classify economic areas under five distinct categories: residential low income, residential middle income, residential high income, commercial buildings and industrial areas. We select three deep neural network architectures to restrict the scope of the research: Mobilenet version 2 (MobileNetV2), Inception version 3 (InceptionV3), Resnet50 version 2 (Resnet50V2). Models were chosen mainly for their performance despite their light-weight architecture, but the proposed approach could be implemented across other architectures.
MobileNetV2 is based on inverted residual structure with depth-wise separable convolutions. It minimizes non-linearity in narrow layers to improve robustness in representational power. The model is light-weight, but has proved to maximize both accuracy and computational speed in various computer vision tasks. MobileNetV2 base-model architecture could be found in Sandler et al [57].
By using factorized convolutional layers and aggressive regularization, the model architecture seeks to improve accuracy and at the same time minimize added computation per layer. InceptionV3 base-model architecture is implemented as in Szegedy et al [65].
Resenet50V2 is among deep residual network architectures, they focus on learning residual functions rather than learning unreferenced functions. Resnet architectures demonstrated higher accuracy and fast convergence[60]. Resnets models fall in different categories depending on the number of layers used in model building. The most common are Resnet18, Resnet34, Resnet50, Resnet101 and Resnet153 [24]. In this research we use Resnet50V2 [25]. Resnets add non-linearity between layers and the main difference between Resnet version 1 and Resnet version 2 is the removal of non-linearity in the last layer on version 2. This was done to promote easy continuous connection in the form of identity connections. Resnet architecture based-model used are presented in He et al [25].
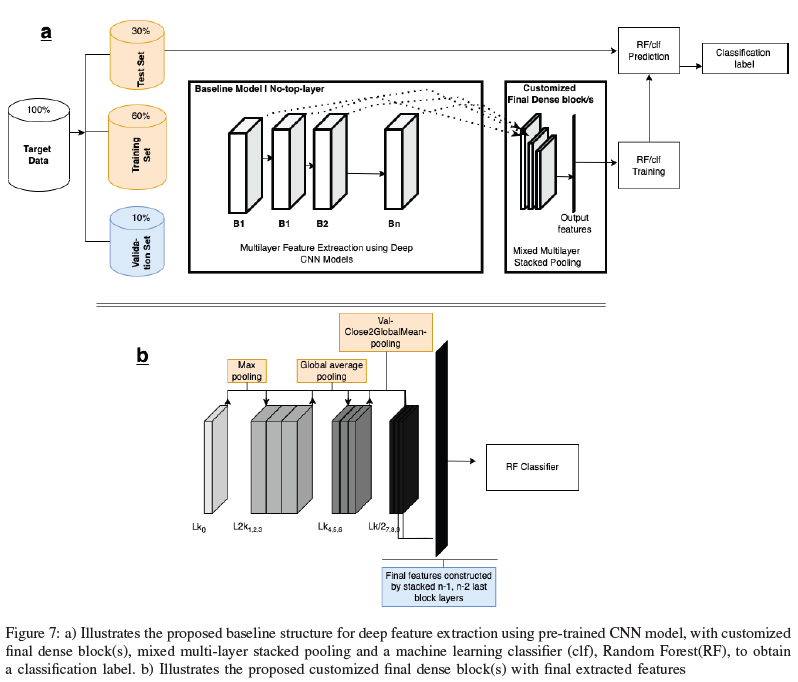
2) Proposed Work: As previously mentioned, MobileNetV2, Resnet50V2 and InceptionV3 are used as our base-models for our research task. The models are initiated without the final layer (head) and ImageNet weights [64] are used with these models to speed up learning and minimize risk of convergence to local minimum. These models are only used for baseline architecture where each model structure is initiated with ImageNet weights without a top layer. The top layer is replaced with our proposed customized dense blocks, with mixed multi-layer stacked pooling to extract final features which are passed through a traditional machine learning model for the final label, Figure-7. Given an output layer, L, of the baseline model with size k, we introduce model customization using dense-net blocks, Formula-1, and mixed multilayer stacked pooling.

Where D(k) is the dense block structure given k, s = step, which is the nth iteration for block customization, d = dense-layer, k = layer - output - size, a,b,c are parameters to be set. The output layer of the baseline model is at step 0, that is s = 0.
Using Formula-1, in this research, we opt for a = 2 at s = 1, a = 1 at s = 2 and a =1/2 at s = 3. We set b = c =1 and hold p at 3 for s> 0, Figure-7. As mentioned for s =0, we use the output layer of the baseline model, in that case a = c =1 and b =0.

As usual, given input vector x, transformation for the vector is given by:

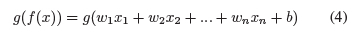
Where w=weights, b=biases, the extended output for Formula-2, is given by:

Since this is linear, looking at Formula-3, to introduce non-linearity, activation functions are usually applied, Formula-4:
Relu activation function [1], Formula-5, which is currently widely used, adjusts input values less than zero, forcing them to zero to avoid the vanishing gradient problem [30].

However it could take on a different architecture depending on the problem being addressed, for more feature extraction. [39].
In this research the proposed function is modified to,

Where a, b, p, n are parameters to be set. In this research we used a = - 10e4, b = 0, p = - 1, n = 1. This is done to introduce some controlled minimal variation on transformed negative values instead of categorically setting them to zero.
On our final stack pooling, we also use a custom pooling where we keep values close to the global mean of total observations during the pooling, Formula-7. We do this to enrich the focus of features extracted for our classification task.
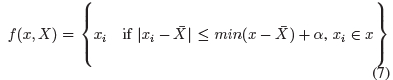
Where x, is the target observations for pooling, X total observations, and X = mean(X) and a a constant.
C. Data Augmentation
For classes with low numbers compared to the rest, such as industrial zone and commercial, rotation, up-sampling and within-sample re-sampling was applied to increase their size and balance the represented classes during training. This was only done on the training data. Test and validation data remained as it is.
1) Visualization: To visually understand the separability and compactness of considered predictive models, we use t-stochastic neighbor embedding (t-SNE) [46]. t-SNE converts similarities between data points to joint probabilities.
D. Testing
The dataset, as described in II-A section, is divided into training and testing dataset. 70% is used for training and 30% is used for testing on both our target models and benchmark models. The test results are used to evaluate the accuracy in order to draw conclusions about the recommended approach for policymakers and practitioners.
III. Results & Discussion
A. Data Analysis
While shape and size is a clear distinct pattern between economic areas as shown in Figures-4,3,2,5,6, color cross-areas pattern could also be an important feature, especially in Africa. This is due to the fact that high income areas roof aerial view and roads tend to be neat with paved roads compared to middle income and low income areas. The same applies for commercial building areas versus industrial zones.
Using random sampling of 5000 images per category, below we present the color histogram distribution of our dataset.
1) Color Histogram Analysis: In Figures-8,9,10, we plot color histograms by channels; Red, Blue, Green (RGB) and present further color patterns behind our economic areas.


Figure-8 shows that residential low-income category blue channel spikes in between fifty and ninety pixel values, and one hundred and sixty and one hundred and eighty compared to green and red channels which are skewed to the right with spikes in between seventy and one hundred and ten pixels values. Overall, this shows that the tonality of residential low-income tends toward zero.
On the middle income side, Figure-9, the blue channel spikes are between thirty and fifty and one hundred on the left side and seventy and one hundred and eighty on the right side with a more narrow curve angle turning area compared to the low-income category. Green and red channels of the category are also right-skewed but with more variation compared to the low-income category. It shows that the middle-income residential category has more color variation compared to low-income residential category.
This is likely due to the fact that designs in middle class residential are more variant. In most cases, middle class neighborhoods are made of houses which have been gradually improved from low to middle class houses rather than newly built houses from scratch. Hence, making their designs and roof colors to be more variant compared to low income class which tend to use the same form of cheap house materials.
Looking at residential high-income, Figure-10 shows that histogram values for all channels tend to spike all together in central with few spikes and minimal spikes intervals.
This implies that high income residential category color is normally distributed with less variation compared to both low-income and high income categories. The reason behind this is often linked to building regulations and naturally formed oligopolistic house design contractors.
B. Modeling
Each model was trained with a configuration of batch 32, and 16 epochs with weight decay of 5e-04 with a custom early-stopping of patience 2, activated after 6 epochs. We considered the best model on validation which is restored after the custom early-stopping. The f1-score accuracy of MobileNetV2, InceptionV3 and Resnet50 is 98%, 99%, 99% respectively. Input shape used was 224x224 for MobileNetV2 and Resnet50, and 299x299 for inception. In the following parts of this section we discuss in detail the classification results of our three target models.
1) MobileNetV2: Below we present detailed classification results of MobilenetV2, Table-I, and visualize the separability and compactness of the embedding layer output per predicted class using t-SNE, Figure-11.
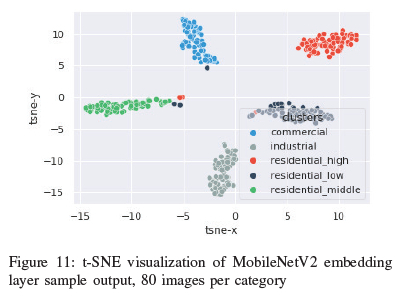

The results in Table-I show that MobileNetV2 scores 98% f1-score accuracy on the five categories. Industrial, Residential-high and Residential-low are the most well classified categories by the model.
2) InceptionV3: Below we present detailed classification results of InceptionV3, Table-II, and visualize the separability and compactness of the embedding layer output per predicted class, Figure-12, the same way we did in the previous section.
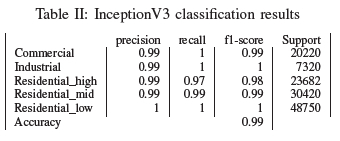

Inception scores 99% f1-score accuracy on the five categories. Industrial, Residential-low Commercial, Residential-mid, areas are the most well classified categories by the model. Table-II.
3) ResNet50V2: Same as in the previous two sections, detailed classification results of Resnet50V2 are presented in this section, Table-III, with the visualization the separability and compactness of the embedding layer output per predicted classes, Figure-13.
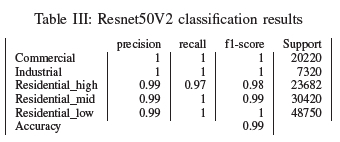

Table-III shows that Resnet50V2 outperforms the rest of deep learning models at 99% f1-score, by keeping a high accuracy across all categories, especially for Commercial, Industrial, Residential-low, and Residential-mid areas.
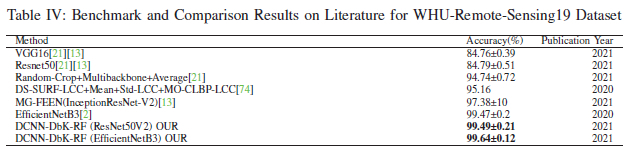
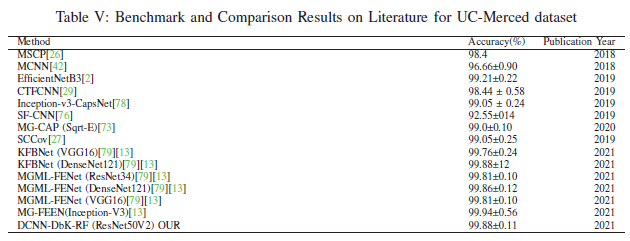
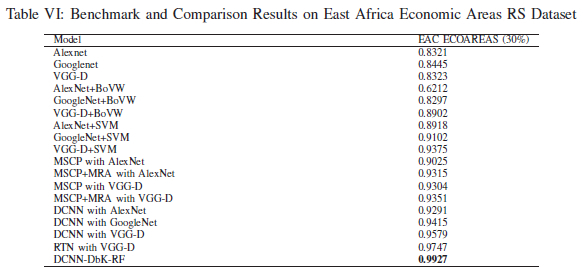
4) Benchmark Results: We compare our results against various state-of-art models in image classification.
The results show that our approach outperforms state-of-art models on RS classification of the five considered categories: Commercial, Industrial, Low Residential Income, Middle Residential Income, High Residential Income. Table-IV, Table-V, Table-VI.
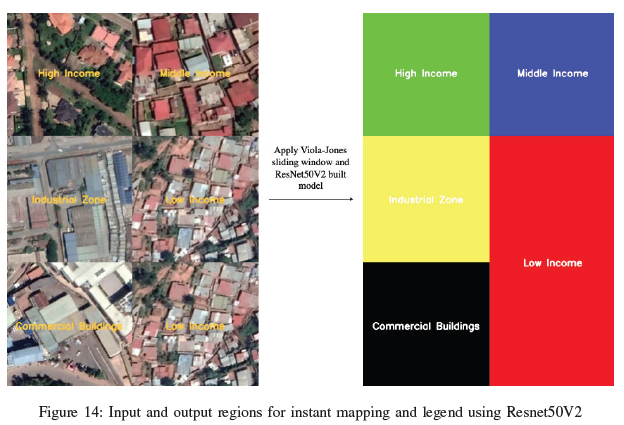
C. Application
Using the best model highlighted in the previous section, we showcase that the pattern learnt from the dataset in this research could be used from pixel to legend and map using Viola-Jones [71] sliding window. Hence, demonstrating that the model built could be applied for instant mapping or improvement of current survey based maps in urban planning, see Figure-14.
Figure-15 shows that you could use results obtained in this research to localize and map the spatial distribution of economic areas considered in this research with high accuracy. However, detection results show that in gray areas such as fields, pastures and roads, the model is likely to get them wrong if they are at the edge of the image view. Hence center view for the target area is recommended for better results. You can see this scenario, top-right of Figure-15, where the model wrongly classifies the field area present in the image as low income while it's not.
By combining localization, Figure-15 and mapping, Figure-14 with coordinates, the results obtained in this research could be used to monitor and enforce the implementation of government proposed zoning plans.
D. Weakness
While, our target residential areas were mainly guided by field survey results obtained from Uwayezu et al [69] as highlighted in Figure-1, in some cases they were also guided by human review, looking at easy access to main roads and house compounds size etc. It is good to note that in some cases this may not be accurate. Hence using more accurate third party data such as world bank data, or country level statistical data on income would yield more accurate data.
IV. Conclusion
Monitoring and assessing the distribution of economic areas in East Africa such as low and high income neighborhoods, has typically relied on the use of structured data and traditional survey approaches for collecting information such as questionnaires, interviews and field visits. These types of surveys are often slow, costly and prone to human error. By using Deep Learning methods and satellite imagery, in this research study we achieve 98% accuracy results with our best model on the classification of five economic area categories. namely, Commercial, Industrial, Residential High, Residential Middle, and Residential Low. The best performing model in terms of an accuracy of 99% was Resnet50V2. The results show that given a specific land zone, one could assess with confidence the spatial distribution of various economic areas in that zone. This has applications in city infrastructure planning and policy monitoring such as city infrastructure master plan enforcement, city expansion monitoring and shanty towns formulation localization and prevention. Classification results express that the deep learning models used were able to learn different patterns independently by observing the ranking accuracy per category. Additional studies of how various architectures are likely to work given different loss functions would be good to explore. Besides, this research was done using daylight satellite imagery, it would also be interesting to see how far one can go on the same or similar research using night-light satellite imagery. Assuming that, night light reflection and it's spatial distribution is likely to provide unique patterns across various areas.
REFERENCES
[1] Abien Fred Agarap. "Deep learning using rectified linear units (relu)". In: arXiv preprint arXiv:1803.08375 (2018).
[2] Haikel Alhichri et al. "Classification of remote sensing images using EfficientNet-B3 CNN model with attention". In: IEEE Access 9 (2021), pp. 14078-14094. [ Links ]
[3] Facundo Alvaredo et al. World inequality report 2018. Belknap Press, 2018.
[4] Gideon Baffoe et al. "Understanding the concept of neighbourhood in Kigali City, Rwanda". In: Sustain-ability 12.4 (2020), p. 1555.
[5] Jerzy Bafiski and Marcin Mazur. "Classification of rural areas in Poland as an instrument of territorial policy". In: Land Use Policy 54 (2016), pp. 1-17. [ Links ]
[6] Javier Barbero, Kristian Behrens, and Jose L Zofio. "Industry location and wages: The role of market size and accessibility in trading networks". In: Regional Science and Urban Economics 71 (2018), pp. 1-24. [ Links ]
[7] et al Barton Michael S. "An investigation of the influence of the spatial distribution of neighborhood violent crime on fear of crime". In: Crime Delinquency (2017), pp. 1757-1776.
[8] Sabyasachi Basu and Thomas G. Thibodeau. "Analysis of spatial autocorrelation in house prices". In: The Journal of Real Estate Finance and Economics (1998), pp. 61-85.
[9] Ricardo N Bebczuk and Ricardo Nestor Bebczuk. Asymmetric information in financial markets: introduction and applications. Cambridge University Press, 2003. [10] Rodrigo F Berriel et al. "Deep learning-based large-scale automatic satellite crosswalk classification". In: IEEE Geoscience and Remote Sensing Letters 14.9 (2017), pp. 1513-1517.
[11] Benjamin Bischke et al. "Multi-task learning for segmentation of building footprints with deep neural networks". In: 2019 IEEE International Conference on Image Processing (ICIP). IEEE. 2019, pp. 1480-1484.
[12] Desamparados Blazquez and Josep Domenech. "Big Data sources and methods for social and economic analyses". In: Technological Forecasting and Social Change 130 (2018), pp. 99-113.
[13] Musabe Jean Bosco, Guoyin Wang, and Yves Hategekimana. "Learning Multi-Granularity Neural Network Encoding Image Classification Using DCNNs for Easter Africa Community Countries". In: IEEE Access 9 (2021), pp. 146703-146718.
[14] Kenneth K Boyer, John R Olson, and Eric C Jackson. "Electronic surveys: Advantages and disadvantages over traditional print surveys". In: Decision Line 32.4 (2001), pp. 4-7.
[15] Kimberly A. Clausing. "Does tax drive the headquarters locations of the world's biggest companies?" In: Transnational Corporations Journal (2018).
[16] Barney Cohen. "Urbanization in developing countries: Current trends, future projections, and key challenges for sustainability". In: Technology in society 28.1-2 (2006), pp. 63-80. [ Links ]
[17] Konrad Czapiewski, Jerzy Bariski, and Magdalena Górczytíska. "The impact of location on the role of small towns in regional development: Mazovia, Poland". In: European Countryside 8.4 (2016), pp. 413-426. [ Links ]
[18] James Daniell, Friedemann Wenzel, and Andreas Schaefer. "The economic costs of natural disasters globally from 1900-2015: historical and normalised floods, storms, earthquakes, volcanoes, bushfires, drought and other disasters". In: EGUGA (2016), EPSC2016-1899.
[19] Gary K Davis. "History of the NOAA satellite program". In: Journal of Applied Remote Sensing 1.1 (2007), p. 012504. [ Links ]
[20] Annette J Dobson and Adrian G Barnett. An introduction to generalized linear models. CRC press, 2018.
[21] D Guo et al. "Remote sensing image scene classification based on supervised contrastive learning". In: Guangxi Xuebao/Acta Photonica Sin. 50.7 (2021).
[22] Yanming Guo et al. "Deep learning for visual understanding: A review". In: Neurocomputing 187 (2016), pp. 27-48.
[23] et al. He Zhanjun. "Discovering the joint influence of urban facilities on crime occurrence using spatial co-location pattern mining". In: Cities 99 (2020).
[24] Kaiming He et al. "Deep residual learning for image recognition". In: Proceedings of the IEEE conference on computer vision and pattern recognition. 2016, pp. 770778.
[25] Kaiming He et al. "Identity mappings in deep residual networks". In: European conference on computer vision. Springer. 2016, pp. 630-645.
[26] Nanjun He et al. "Remote sensing scene classification using multilayer stacked covariance pooling". In: IEEE Transactions on Geoscience and Remote Sensing 56.12 (2018), pp. 6899-6910. [ Links ]
[27] Nanjun He et al. "Skip-connected covariance network for remote sensing scene classification". In: IEEE transactions on neural networks and learning systems 31.5 (2019), pp. 1461-1474.
[28] Charles Hodgson. "The effect of transport infrastructure on the location of economic activity: Railroads and post offices in the American West". In: Journal of Urban Economics 104 (2018), pp. 59-76. [ Links ]
[29] Hong Huang and Kejie Xu. "Combing triple-part features of convolutional neural networks for scene classification in remote sensing". In: Remote Sensing 11.14 (2019), p. 1687.
[30] Hidenori Ide and Takio Kurita. "Improvement of learning for CNN with ReLU activation by sparse regularization". In: 2017 International Joint Conference on Neural Networks (IJCNN). IEEE. 2017, pp. 2684-2691.
[31] Akanksha Kapoor and Abhishek Singhal. "A comparative study of K-Means, K-Means++ and Fuzzy C-Means clustering algorithms". In: 2017 3rd international conference on computational intelligence & communication technology (CICT). IEEE. 2017, pp. 1-6.
[32] Muhammad Jaleed Khan et al. "Automatic target detection in satellite images using deep learning". In: J. Space Technol 7.1 (2017), pp. 44-49.
[33] Nataliia Kussul et al. "Deep learning classification of land cover and crop types using remote sensing data". In: IEEE Geoscience and Remote Sensing Letters 14.5 (2017), pp. 778-782.
[34] Demetris Lamnisos et al. "Geodemographic Area Classification and Association with Mortality: An Ecological Study of Small Areas of Cyprus". In: International journal of environmental research and public health 16.16 (2019), p. 2927.
[35] Jong-Wha Lee and Innwon Park. "Free Trade Areas in East Asia: Discriminatory or Non-discriminatory?" In: World Economy 28.1 (2005), pp. 21-48.
[36] Lin Li, Yohei Sato, and Haihong Zhu. "Simulating spatial urban expansion based on a physical process". In: Landscape and urban planning 64.1-2 (2003), pp. 6776.
[37] Minghao Li et al. Location Determinants of high Growth Firms. MPRA Paper. University Library of Munich, Germany, 2015. URL: https://EconPapers.repec.org/RePEc:pra:mprapa:66611.
[38] Xi Li, Fengrui Chen, and Xiaoling Chen. "Satellite-observed nighttime light variation as evidence for global armed conflicts". In: IEEE Journal of Selected Topics in Applied Earth Observations and Remote Sensing 6.5 (2013), pp. 2302-2315.
[39] Yuanzhi Li and Yang Yuan. "Convergence analysis of two-layer neural networks with relu activation". In: arXiv preprint arXiv:1705.09886 (2017).
[40] KJ Linthicum et al. "Application of polar-orbiting, meteorological satellite data to detect flooding of Rift Valley Fever virus vector mosquito habitats in Kenya". In: Medical and Veterinary Entomology 4.4 (1990), pp. 433-438.
[41] Yanchi Liu et al. "Intelligent bus routing with heterogeneous human mobility patterns". In: Knowledge and Information Systems 50.2 (2017), pp. 383-415.
[42] Yanfei Liu, Yanfei Zhong, and Qianqing Qin. "Scene classification based on multiscale convolutional neural network". In: IEEE Transactions on Geoscience and Remote Sensing 56.12 (2018), pp. 7109-7121.
[43] Hector A Lopez-Ospina, Francisco J Martinez, and Cristian E Cortes. "Microeconomic model of residential location incorporating life cycle and social expectations". In: Computers, Environment and Urban Systems 55 (2016), pp. 33-43.
[44] Shuaib Lwasa and Cecilia Kinuthia-Njenga. "Reappraising urban planning and urban sustainability in East Africa". In: Urban development (2012), pp. 3-21.
[45] Yueliang Ma and Ruisong Xu. "Remote sensing monitoring and driving force analysis of urban expansion in Guangzhou City, China". In: Habitat International 34.2 (2010), pp. 228-235.
[46] Laurens van der Maaten and Geoffrey Hinton. "Visualizing data using t-SNE". In: Journal of machine learning research 9.Nov (2008), pp. 2579-2605.
[47] Danny MacKinnon, Gordon Pirie, and Matthias Gather. "Transport and economic development". In: (2008).
[48] Rahel Meili and Heike Mayer. "Small and medium-sized towns in Switzerland: Economic heterogeneity, socioeconomic performance and linkages". In: Erdkunde (2017), pp. 313-332.
[49] Charlotta Mellander et al. "Night-time light data: A good proxy measure for economic activity?" In: PloS one 10.10 (2015), e0139779.
[50] Harvey J Miller and Yi-Hwa Wu. "GIS software for measuring space-time accessibility in transportation planning and analysis". In: GeoInformatica 4.2 (2000), pp. 141-159.
[51] Barak Oshri et al. "Infrastructure quality assessment in africa using satellite imagery and deep learning". In: Proceedings of the 24th ACM SIGKDD International Conference on Knowledge Discovery & Data Mining. 2018, pp. 616-625.
[52] Sinno Jialin Pan and Qiang Yang. "A survey on transfer learning". In: IEEE Transactions on knowledge and data engineering 22.10 (2009), pp. 1345-1359.
[53] Andrew V Papachristos and Sara Bastomski. "Connected in crime: the enduring effect of neighborhood networks on the spatial patterning of violence". In: American Journal of Sociology 124.2 (2018), pp. 517568. [ Links ]
[54] Kirsteen Paton. "Making working-class neighbourhoods posh? Exploring the effects of gentrification strategies on working-class communities". In: Classed intersections: Spaces, selves, knowledges (2010), pp. 137-157.
[55] Debraj Roy and Michael Lees. "Understanding resilience in slums using an agent-based model". In: Computers, Environment and Urban Systems 80 (2020), p. 101458.
[56] Jason Russ. "Essays on the Impact of Weather on Economic Activity". PhD thesis. The George Washington University, 2018.
[57] Mark Sandler et al. "Mobilenetv2: Inverted residuals and linear bottlenecks". In: Proceedings ofthe IEEE conference on computer vision and pattern recognition. 2018, pp. 4510-4520.
[58] Rahman Sanya and Ernest Mwebaze. "Identifying patterns in urban housing density in developing countries using convolutional networks and satellite imagery". In: Heliyon 6.12 (2020), e05617.
[59] Alain Segessemann and Olivier Crevoisier. "Beyond economic base theory: The role of the residential economy in attracting income to Swiss regions". In: Regional Studies 50.8 (2016), pp. 1388-1403.
[60] Ling Shao, Fan Zhu, and Xuelong Li. "Transfer learning for visual categorization: A survey". In: IEEE transactions on neural networks and learning systems 26.5 (2014), pp. 1019-1034.
[61] Paheding Sidike et al. "dPEN: deep Progressively Expanded Network for mapping heterogeneous agricultural landscape using WorldView-3 satellite imagery". In: Remote sensing of environment 221 (2019), pp. 756-772.
[62] Timothy F Slaper, Karter M Harmon, and Barry M Rubin. "Industry clusters and regional economic performance: A study across US metropolitan statistical areas". In: Economic Development Quarterly 32.1 (2018), pp. 44-59.
[63] Diana Suhardiman, Oulavanh Keovilignavong, and Miles Kenney-Lazar. "The territorial politics of land use planning in Laos". In: Land use policy 83 (2019), pp. 346-356.
[64] Christian Szegedy et al. "Inception-v4, inception-resnet and the impact of residual connections on learning". In: Thirty-first AAAI conference on artificial intelligence. 2017.
[65] Christian Szegedy et al. "Rethinking the inception architecture for computer vision". In: Proceedings of the IEEE conference on computer vision and pattern recognition. 2016, pp. 2818-2826.
[66] Chuanqi Tan et al. "A survey on deep transfer learning". In: International conference on artificial neural networks. Springer. 2018, pp. 270-279.
[67] JD Tarpley, SR Schneider, and RL Money. "Global vegetation indices from the NOAA-7 meteorological satellite". In: Journal ofClimate and Applied Meteorology 23.3 (1984), pp. 491-194. [ Links ]
[68] Grigorios Tsagkatakis et al. "Survey of deep-learning approaches for remote sensing observation enhancement". In: Sensors 19.18 (2019), p. 3929.
[69] Ernest Uwayezu and Walter T de Vries. "Access to Affordable Houses for the Low-Income Urban Dwellers in Kigali: Analysis Based on Sale Prices". In: Land 9.3 (2020), p. 85.
[70] Adam Van Etten. "You only look twice: Rapid multi-scale object detection in satellite imagery". In: arXiv preprint arXiv:1805.09512 (2018).
[71] Paul Viola and Michael Jones. "Rapid object detection using a boosted cascade of simple features". In: Proceedings ofthe 2001 IEEE computer society conference on computer vision and pattern recognition. CVPR 2001. Vol. 1. Ieee. 2001, pp. I-I.
[72] Athanasios Voulodimos et al. "Deep learning for computer vision: A brief review". In: Computational intelligence and neuroscience 2018 (2018).
[73] Shidong Wang, Yu Guan, and Ling Shao. "Multi-granularity canonical appearance pooling for remote sensing scene classification". In: IEEE Transactions on Image Processing 29 (2020), pp. 5396-5407.
[74] Xin Wang et al. "Remote Sensing Scene Classification Using Heterogeneous Feature Extraction and Multi-Level Fusion". In: IEEE Access 8 (2020), pp. 217628217641.
[75] Ryan W Wolcott and Ryan M Eustice. "Visual localization within lidar maps for automated urban driving". In: 2014 IEEE/RSJ International Conference on Intelligent Robots and Systems. IEEE. 2014, pp. 176-183.
[76] Jie Xie et al. "Scale-free convolutional neural network for remote sensing scene classification". In: IEEE Transactions on Geoscience and Remote Sensing 57.9 (2019), pp. 6916-6928. [ Links ]
[77] James Yoo and Richard Ready. "The impact of agricultural conservation easement on nearby house prices: Incorporating spatial autocorrelation and spatial heterogeneity". In: Journal of Forest Economics (2016), pp. 78-93.
[78] Wei Zhang, Ping Tang, and Lijun Zhao. "Remote sensing image scene classification using CNN-CapsNet". In: Remote Sensing 11.5 (2019), p. 494. [ Links ]
[79] Qi Zhao et al. "MGML: Multigranularity Multilevel Feature Ensemble Network for Remote Sensing Scene Classification". In: IEEE Transactions on Neural Networks and Learning Systems (2021).
All authors are with the African Center of Excellence in Data Science (ACE-DS), University of Rwanda.

Davy K. Uwizera is a Masters of Science in Information Technology graduate from Carnegie Mellon University, class of 2017, currently pursuing a dual PhD in data science at Africa Center of Excellence in Data Science and a PhD in Internet of Things at Africa Center of Excellence in Internet of Things. His current research interests include unstructured data mining, deep learning, machine learning edge and big data.

Charles Ruranga Received the B.Sc. degree in economics from National University of Rwanda, Rwanda, 2001, M.Sc. degree in economics, University of Montreal, Canada, 2007. He received his PhD in statistics from Makerere University, Uganda in 2017. His research interests include, but are not limited to, econometric spatial analysis, time series and multivariate signal processing. He is currently the director of the African Center of Excellence in Data Science (ACE-DS).

Patrick McSharry (Senior Member of the IEEE) He received the B.A. degree in theoretical physics in 1993 and the M.Sc. degree in electronic and electrical engineering in 1995 from Trinity College Dublin, Dublin, Ireland. He received the D.PHil. degree in mathematics from the university ofOxford, U.K., in 1999. He is currently visiting professor at Carnegie Mellon University Africa and a member of the Kigali Collaborative Research Center, Having served 22 years at Oxford University, McSharry remains affiliated with the Oxford Man Institute of Quantitative Finance, the Mathematical Institute, the Department of Computer Science, and the Oxford Internet Institute. He is a Fellow of the Royal Statistical Society, Senior Member of the IEEE and Senior Academic Member of the Willis Research Network.

