


Serviços Personalizados
Artigo
 Inglês (pdf)
 Artigo em XML
 Referências do artigo
Indicadores

Links relacionados
-
 Citado por Google
 -
 Similares em Google
Compartilhar

 Permalink
SAIEE Africa Research Journal
versão On-line ISSN 1991-1696
versão impressa ISSN 0038-2221
SAIEE ARJ vol.112 no.3 Observatory, Johannesburg Set. 2021
Reconfiguration of Uganda's Bulk Network to Accommodate a Wholesale Electricity Market
Jensen Nduhuura; Geofrey Bakkabulindi; Milton Edimu
The authors are with the Department of Electrical and Computer Engineering, College of Engineering, Design, Art and Technology, Makerere University, Kampala, Uganda (e-mail: induhuura@cedatmak.ac.ug geofrey.bakkabulindi@mak.ac.ug and milton.edimu@mak.ac.ug)
ABSTRACT
Countries that have restructured their electricity markets to wholesale markets have had significant benefits, including reduced generation costs, lower transmission losses and better consumer prices. In these markets, generators are dispatched in such a way that the financial benefits of both generator owners (producer surplus) and consumers (consumer surplus) are maximized. Retailers and large-scale consumers transact directly with power producers in a spot market or through contracts at wholesale level. Uganda's current single-buyer market (in which generation companies sell their power to a single entity that in turn transmits and sells it to distribution companies) was introduced in 2001 after the transition from a vertically integrated monopoly model. The market is expected to evolve into a wholesale market as the next restructuring step. This paper investigates the performance of the Uganda bulk network in a wholesale electricity market environment as modelled in Power World simulator. It considers different operation scenarios and possible infrastructure enhancements required for improved performance. Results showed that in the wholesale market model, transmission energy losses fell from an average of 4.3% to 3.8% compared to the single-buyer model due to more efficient network utilization. The economic analysis showed that off-peak and peak prices in the wholesale market system were 68.6% and 13.5% lower than in the current market respectively. However, old high loss transmission lines contributed to higher energy prices at receiving nodes. Transmission congestion, whose cost is embedded in a Location Marginal Price, caused sharp increases in the market's prices; this was addressed by using the network reconfiguration technique.
Index Terms: Power system restructuring; Electricity markets; Location Marginal Price; Transmission congestion
I. Introduction
POWER system restructuring is undertaken to stimulate competition within the electricity market; as is the case in other markets such as oil, telecommunications and aviation. To achieve this, the electricity market is transformed from a monopoly to an open market where private investors participate in the management and operation of generation and distribution entities. Due to the criticality of transmission function, it generally remains publicly managed to ensure network security and open access [1]. Deregulation, a product of market reforms, has the desirable effect of bringing down system losses, cost of electricity and providing choice to consumers [2]
Electricity markets have four classifications: monopoly markets, single-buyer markets (purchasing model), wholesale markets and retail markets [3]. Uganda's electricity market was transformed into a purchasing model in 2001 when the monopoly entity, Uganda Electricity Board (UEB), was unbundled into three successor companies: Uganda Electricity Generation Company Limited (UEGCL), Uganda Electricity Transmission Company Limited (UETCL) and Uganda Electricity Distribution Company Limited (UEDCL) [4]. UETCL is the entity responsible for bulk purchase of electricity from generators and subsequent sale and transmission of power to distribution companies.
The Government of Uganda has in the past made several efforts to lower electricity tariffs, among which is the construction of publicly financed hydro power plants [4]. The cost of electricity from the 250 MW Bujagali hydropower plant (HPP), developed and operated by Bujagali Energy Limited, was initially USD 0.11 per kWh [5], due to the high debt repayment obligations. In June 2018, the government secured debt refinancing for Bujagali HPP which resulted in a 15% reduction in the tariff applicable to the consumer category of extra-large industrialists, i.e. from an average of 10.1 to 8.3 US cents per kWh during peak hours and 5.0 US cents per kWh during off-peak hours [6]. However, a holistic solution involving all generators could deliver sustainable and long-term fairer prices.
Various countries have witnessed the transformative benefits of deregulation; in South Korea, generation net profit and costs experienced a 42% increase and 6% decrease respectively with a wholesale cost based pool market; energy losses reduced by 5% in Colombia and 13% in Chile within a decade; in the EU electricity prices fell by 6% on average between 1996 and 1999 with retail and wholesale markets [7].
Wholesale markets are designed to ensure stable and reliable electrical networks by supporting the financial constraints of generation, transmission, and distribution while addressing the problems of market power, inefficient pricing, and investment risk. In these markets, an Independent System Operator (ISO) administers the energy, ancillary services, financial transmission rights (FTR) and forward capacity markets that are in place to address the challenges of a wholesale market [8]-[10].
The restructuring of electricity markets begat a phenomenon known as transmission congestion, a technical problem that can severely affect an otherwise smoothly operating market. Transmission congestion occurs when the transmission network is unable to accommodate all the desired transactions due to a violation of operation limits. Congestion blocks the ability of power from the cheapest generating source(s) from reaching all the nodes of the power system [11]-[13]. Therefore, Location Marginal Prices (LMP) become higher at those nodes; this extra cost is known as the cost of security. LMP at a given location is the marginal cost to supply an extra unit of power to the location without violating any system constraints. LMPs are comprised of: a pure energy term, which is the marginal price under a lossless unconstrained network; a loss term, which accounts for power losses in the network; and a congestion term to account for network constraints [14], [15].
Various techniques have been fronted to tackle the transmission congestion challenge. Congestion management techniques were reviewed and classified as technical and nontechnical [16]. Non-technical techniques include: price area congestion management, that involves market splitting [17]; generation rescheduling by the ISO [18]-[20]; nodal pricing that involves solving an optimization problem at each node and generating LMPs at those nodes [14], [15], among others. Technical techniques include using Flexible Alternative Current Transmission System (FACTS) devices at optimal locations within the system [13], using transformer tap changers, disconnecting congested lines and network reconfiguration.
This paper investigates the performance of the Uganda bulk network in wholesale electricity market system and assesses the dynamics of nodal prices across the network. The network reconfiguration technique is applied to address the manifestation of transmission congestion. The associated benefits of operating this market system compared to the current single-buyer market are also presented.
The rest of this paper is organised as follows: section II presents the development of Uganda's bulk power network model in Power World software and validation of the model, section III presents the results of the wholesale market simulations, and section IV concludes the paper.
II. MODEL OF UGANDA'S BULK POWER NETWORK
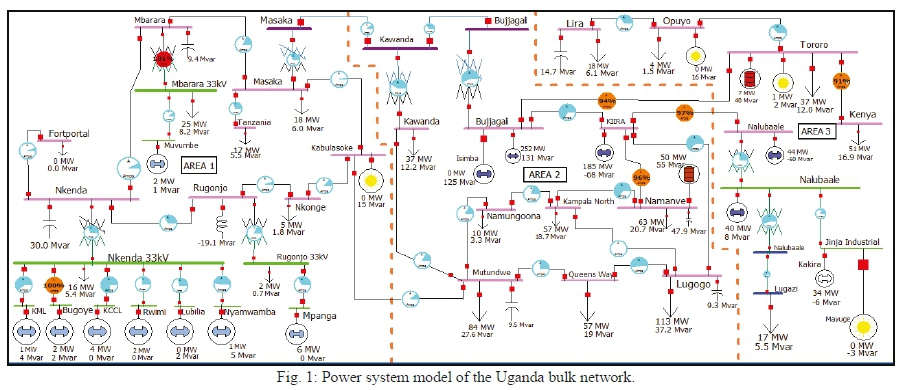
The Uganda bulk power network was modelled in Power World software as shown in Fig. 1. The model largely focused on high voltage (HV) transmission lines at and above 66 kV, but some medium voltage (MV) 33 kV lines were included to incorporate distributed generators. The 220 kV, 132 kV, 66 kV and 33 kV buses are colored purple, pink, blue, and green respectively.
A. Physical Network Equipment Data
The bulk network currently constitutes 18 substations and two (2) switching stations which are interconnected by just over 30 transmission line branches. The transmission grid currently comprises 150 km of 220 kV, 1443 km of 132 kV, 300 m of 132 kV underground cable and 32.5 km of 66 kV HV transmission lines [21].
Uganda's generation mix is dominated by hydro power plants at about 86%. According to a report by the Electricity Regulatory Authority (ERA), installed capacities as of 2019 were; large hydro - 855.0 MW, small hydro - 149.3 MW, thermal - 101.6 MW, cogeneration - 96.2 MW, and solar PV - 50.8 MW [22].
Network parameters like line capacities, conductor types and lengths, generator and substation data were obtained from the Energy GIS website [23] and UETCL.
B. Formulation of Generator Cost Functions
Generator cost functions are crucial for Optimal Power Flow (OPF) simulation of wholesale markets to generate LMPs across the network. The cost functions were developed based on historic generation tariffs set by the ERA; hence they are only indicative rather than absolute functions along which generating firms would choose to operate if the wholesale market were implemented.
ERA considers the Levelized Cost of Energy (LCOE) to set the tariffs; LCOE is the price ($/MWh) at which a plant must generate to break even. LCOE of a generating plant is computed using the general equation presented in (1) [24]:
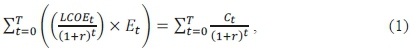
where T is the expected lifespan of the plant (years), r is the discount rate (%), Et is energy generated (MWh), Ct is the net present value of costs ($), and t is an index of summation. The summation of the product of (Et) and present value LCOE should be equal to the net present value of costs (Ct) associated with the plant for the generation source to break even.
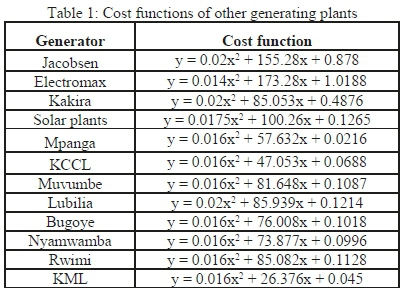
With the LCOE of a generation plant, the tariff is then set to provide a return (profit margin) on investment. According to ERA, the maximum allowable return of Solar PV power plants is 10% while the rest of generation technologies have a maximum return of 13.5% [25]. The LCOE of each generator was calculated and incorporated in the generator's historic cost data availed from ERA. Cost functions were then obtained by carrying out non-linear regression on the data in Microsoft Excel software as seen in Fig. 2. More generator cost functions are presented in Table 1.
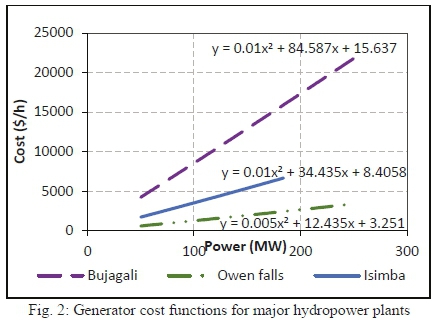
The LCOE price was included, even though generators produce at significantly higher prices in the current single-buyer market, because with the competition of a wholesale market, generators could be forced to cut back on prices. Solar PV power plants currently have uniform feed-in tariffs therefore one cost function was developed.
C. Stochastic Load Modelling
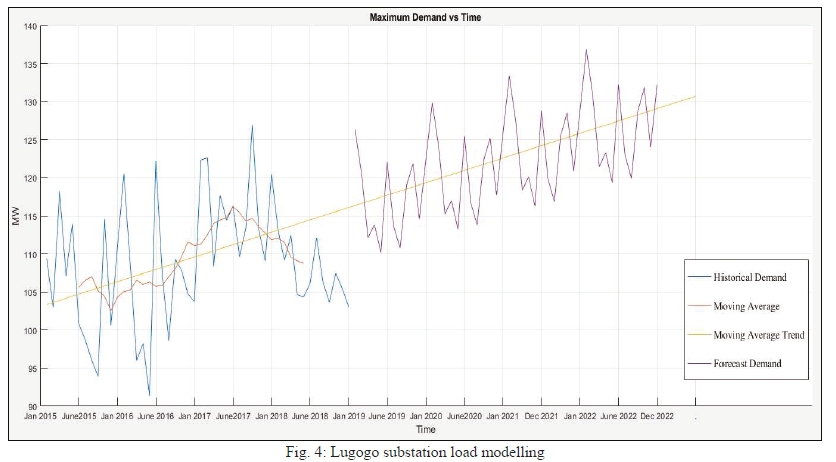
Electricity consumption is heavily dependent on factors like weather, demographics, and socio-economic variables. Therefore, electricity demand data are nonstationary in nature and their mean and/or variance vary with time [26], [27]. The future values of an electricity demand dataset are thus described by its probability distribution and not by mathematical formulae since it is not deterministic. In this study, modelling of future electricity demand (2019-2022) at substations was based on the historical power consumption data for the period 2015-2018 obtained from UETCL.
The moving average technique was used to obtain a trend of the historic dataset from which future demands were forecasted as follows [28]:
i. A 12-month moving average was calculated for a substation's historic dataset. A moving average is a succession of averages obtained from sequential subsets of the full data set.
ii. A monthly demand index (MDI) was calculated for each of the months whose moving average was calculated in the previous step as follows:
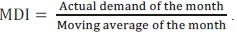
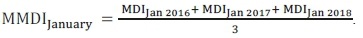
iii. The mean monthly index of demand (MMDI) for each month was calculated. Given the four-year data set, three monthly indices were averaged for each month as follows:
iv. The moving averages obtained in step 1 were used to obtain the graphical trend of the historic dataset. The trend was then projected four years into the future.
v. The future monthly demands were then calculated using a month's MMDI calculated in step 3, and the projected moving averages obtained in step 4.
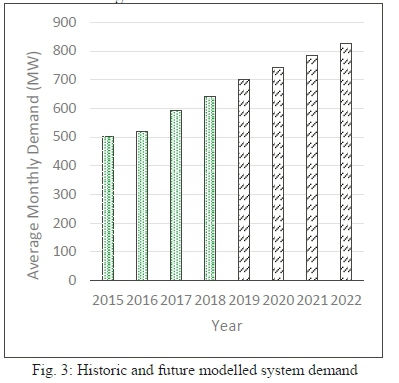
The demands of each substation were then modelled. Fig. 4 presents graphical results for one of the substations. The aggregated maximum system demand for historic and forecast years is shown in Fig. 3.
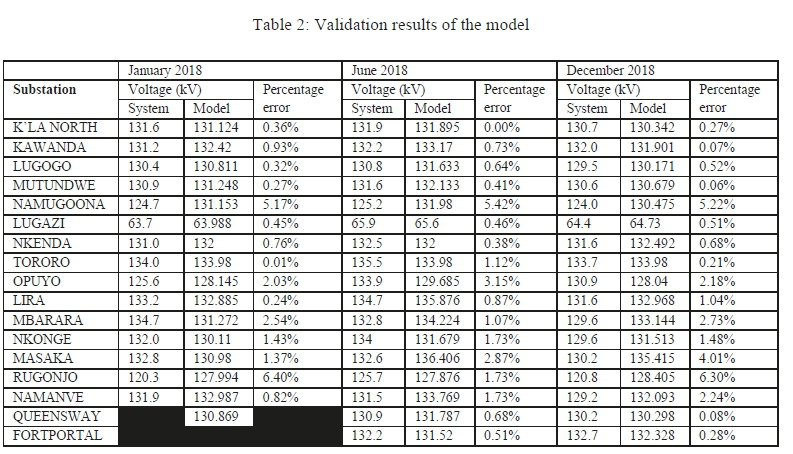
D. Validation of Bulk Network Model
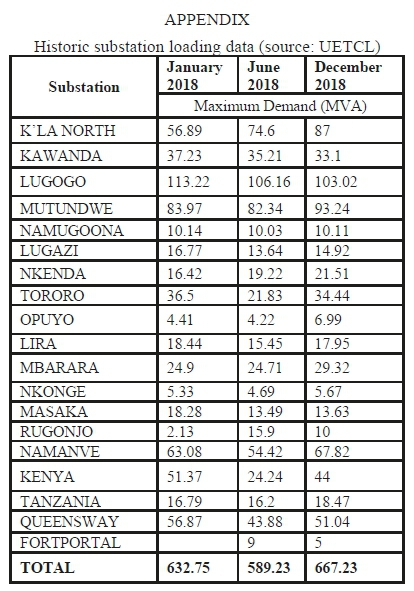
Load flow analyses were carried out on the model using load data for the months of January, June and December 2018 provided in the Appendix. The substation bus voltage results were compared against historic system values contained in UETCL reports.
The percentage errors of voltages at the modelled substations are presented in Table 2. It is seen that the errors range from 0.01% to 6.4% while the average of the percentage errors for months of January, June and December 2018 were calculated as 1.54%, 1.38%, and 1.64% respectively, which are well within the allowable 5% error margin.
It should be noted that Fort Portal substation was not in operation in January 2018 thus its data for that month is not shown in the Appendix and Table 2. Queensway substation's real data for average voltage was missing in the control report for that month, so its voltage percentage error could not be calculated. However, its maximum demand was obtained.
III. RESULTS AND DISCUSSION
The results presented in this section illustrate the performance of the Uganda bulk power network in different demand scenarios under wholesale market conditions, rather than the prevailing single-buyer model. A contingency analysis is also undertaken to establish the network's sensitivity to different extreme conditions.
The bulk network was split into three zones, as seen in Fig. 1. Area 1 covers the southern and western regions of Uganda; Area 2 covers central Uganda, the largest load center consisting of the capital city and major industries; Area 3 covers the northern and eastern regions of Uganda.
The performance of the bulk network in a wholesale market system was analyzed using different scenarios. The simulated operation scenarios were based on 2022 loads which were modelled based on historic demand data.
Scenario 1 was simulated and analyzed using the average projected maximum demand of 202 i.e., 824.95 MW. All other scenarios were compared against scenario 1. Scenario 2 was simulated with the highest maximum demand of 2022 (868.63 MW) which occurred in December 2022. Scenario 3 was carried out with projected lowest off-peak demand of 2022 (305.2 MW). Scenarios 2 and 3 were carried out to observe the market's performance at both demand extremes.
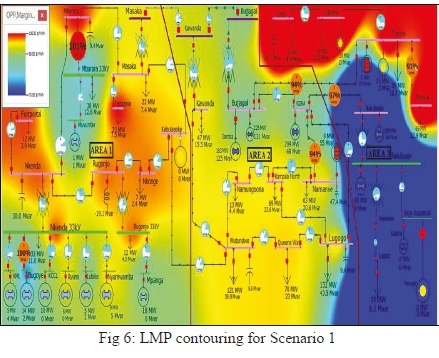
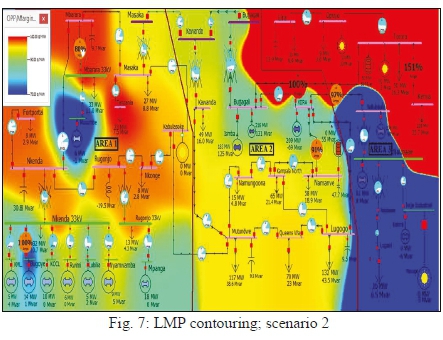
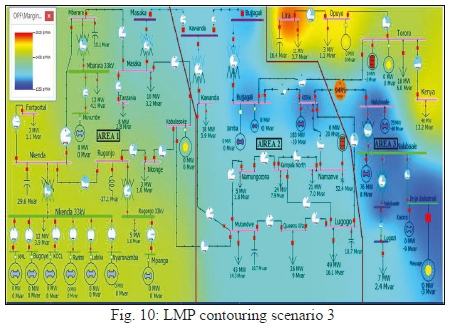
In the LMP contour illustrations (Fig. 7, Fig. 8, and Fig. 11), red contours indicate highest electricity price regions; Blue contours indicate cheapest electricity areas, whereas yellow or green contours indicate areas with mid-range prices. A transition of color between two buses indicates existence of a constraint on their interconnecting line(s).
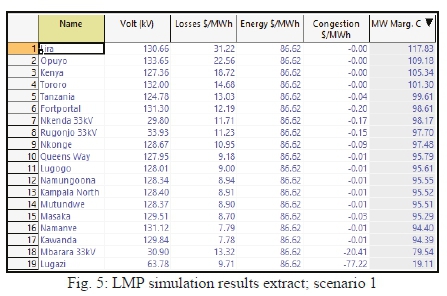
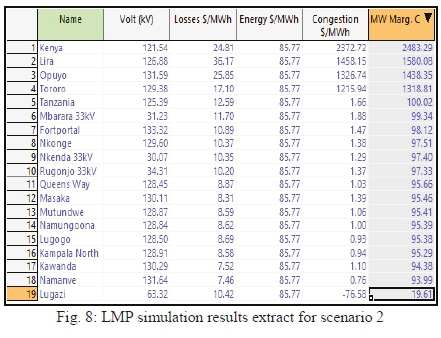
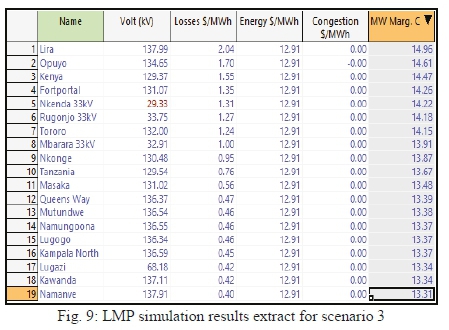
A screenshot of tabulated LMP simulation results at load buses is provided for each scenario (Fig. 6, Fig. 9, and Fig. 10); "MW Marg. C" represents the LMP, "Losses $/MWh" represents the loss term, "Energy $/MWh" represents the pure energy term, "Congestion $/MWh" represents the congestion term.
A. Scenario 1 Results
In this scenario, negligible congestion manifested on the network hence LMPs at the different substations varied only due to transmission losses encountered in delivering power to that node, as seen in Fig. 6. Lugazi substation had the lowest LMP because of its proximity to the cheapest generators i.e., Kiira and Nalubaale. The LMPs at Lira, Opuyo and Kenya buses are high because the energy losses component at these buses are much higher than the average of 12.55 $/MWh; 31.22, 22.56, and 18.72 $/MWh respectively. This is attributed to the high I2R losses on the old transmission lines feeding these buses with conductor type ACSR 125. Fig. 7 illustrates the spread of LMPs across various nodes in the network.
B. Scenario 2 Results
Significant congestion manifested on the Tororo, Kenya, Lira and Opuyo buses which drastically increased the nodal prices at these buses. This congestion is attributed to the Bujagali-Tororo line that is loaded to capacity in this scenario, see Fig. 8. Kenya bus price shoots even higher because of overloading of the Tororo-Kenya line.
The system losses component of electricity price in this scenario rises by 3.6% to an average of 13 $/MWh as seen in Fig. 9, compared to 12.55 $/MWh of scenario 1. This is because of the higher system demand which increases current on the lines and hence the I2R losses. The losses component on the Lira, Opuyo and Kenya bus remains significantly high because of the nature of conductor, as explained in scenario 1.
The average zonal electricity prices in Area 1 and Area 2 remain relatively unchanged in comparison to scenario 1 while in Area 3 average prices rose by 93.1%. This steep rise is attributed to the Bujagali-Tororo line transmission congestion.
C. Scenario 3 Results
In this scenario, no transmission congestion occurs, average cost of system losses falls to 0.91$/MWh from 12.55$/MWh in scenario 1, as shown in Fig. 10. The LMP contouring portrays low prices throughout the network (Fig. 11). Electricity prices in zonal areas 1, 2 and 3 drop significantly by 84.89%, 85.73%, and 75.2% respectively. This is because the low system demand can be met by dispatch of the cheapest generating units only.
D. Sensitivity Analysis of Contingency Scenarios
A sensitivity analysis of different contingencies for scenario 1 was undertaken to establish the network's behavior under different extreme operating conditions. The contingencies were comprised of disturbances arising from the disconnection of selected elements from the network, e.g., due to faults or maintenance activities. Infrastructure modifications are proposed to rectify negative performance issues observed.
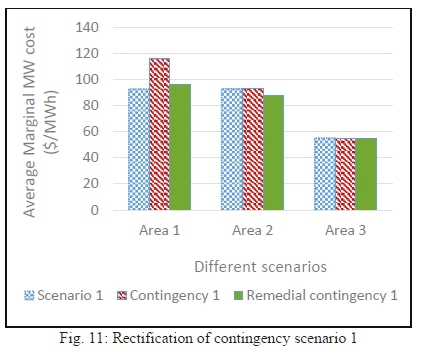
Contingency scenario 1 was setup by disconnecting a major line, Kawanda-Masaka 220 kV (AAAC 200), connecting Area 2 to Area 1. This contingency caused a 20% increase in the prices of Area 1. This price increase can be attributed to the system loss charges incurred in delivering power from Area 2 to Area 1 through the alternative higher loss Mutundwe-Kabulasoke 132kV (ACSR 125) line. In addition, the previously un-dispatched high cost Kabulasoke solar plant was dispatched to meet Area 1 demand, increasing the area's prices.
The problem noted in contingency scenario 1 was rectified by replacing the old high loss wooden pole Mutundwe-Kabulasoke 132 kV (ACSR 125) transmission line with a 132 kV AAAC 200 low loss line. This modification caused prices in Area 1 to increase by only 3.6% as opposed to 20%. Area 2 prices reduced by 5.4% while Area 3 prices remained unchanged. The effect of this modification is shown in Fig. 12.
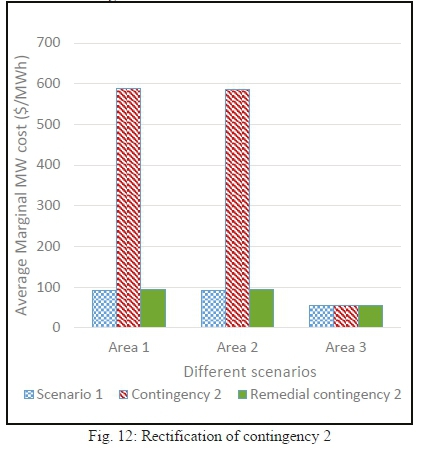
In contingency scenario 2, two major lines in Area 2 were independently taken out of service, that is: Kiira-Lugogo and Kawanda-Mutundwe 132 kV lines of capacity 320 MW and 915 MW, respectively. These lines are critical in supplying power within in Area 2 and subsequently into Area 1. In both cases, the Kiira-Namanve-Kampala North transmission link in Area 2 became loaded above to 110% hence causing transmission congestion that drove up prices in Area 2 and subsequently Area 1 . Electricity prices in Area 1 and Area 2 rose by 87.2% and 85.9% respectively with Kiira-Lugogo line out of service and 79.4% and 81.9% respectively with Kawanda-Mutundwe line out of service.
The constraint observed in contingency scenario 2 was rectified by remodeling the Kira-Namanve and Namanve-Kampala North lines as double circuits instead of single circuits. Currently only one circuit is strung on the double circuit pylon structures. The second circuit was modelled with same parameters as the existing circuit. With this modification, the sharp increase in prices in Areas 1 and 2 that was seen with contingency scenario 2 was prevented, see Fig 13. This is because the extra capacity provided by adding the second circuit ensures power is delivered within Area 2 and to Area 1 without overloading transmission lines thus eliminating transmission congestion manifestation.
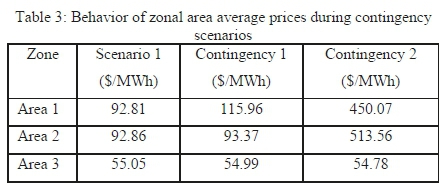
It was observed that electricity prices changed only in the zones affected by the contingency, provided that the unaffected zones can meet their local power demands without drawing power from the affected zone. Table 3 shows that prices in Areas 2 and 3 remain relatively unchanged in contingency 1, while a spike in average price is seen in Area 1 whose main supply line was disconnected. During contingency 2, the price in Area 3 remained relatively unchanged, while the transmission congestion that manifested in Area 2 caused a spike in the latter's prices which cascaded into Area 1 that draws electricity from Area 2.
E. Comparison of Bulk Network Performance in the Wholesale and Single Buyer Markets
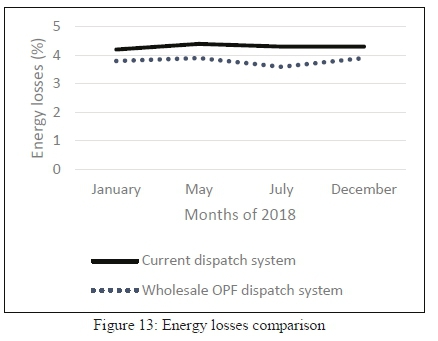
The dispatch of generators in the wholesale market simulations using the OPF technique led to a fall in energy losses from an average of 4.3% with the current dispatch system to 3.8%, as seen in Figure 13. This 0.5% reduction in energy loses represents an annual energy saving of about 6 GWh, according to UETCL's energy purchases data [29].
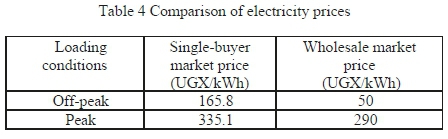
A comparison of electricity prices in the two markets was carried out. The 2019 bulk supply tariffs set by ERA [30] represented the single-buyer market prices while the average of LMPs for scenario 1 and Scenario 3 were used to represent peak and off-peak prices in the wholesale market respectively. The LMPs were converted from $/MWh to UGX/kWh using a dollar rate of 3614. From Table 4, a 68.6% and 13.5% reduction in off-peak and peak electricity prices respectively is noted with a transition from the current single-buyer market to wholesale market.
The intrinsic physical nature of conductors constituting a transmission network and its topology have a direct impact on the market performance, in terms of energy losses price and transmission congestion price. These are directly infused in the LMPs at different nodes in the system[15]. This was observed in the scenario results discussed.
Network constraints were identified with contingency 1 and 2 due to lack of good alternative electricity routes. These constraints were seen to impact electricity prices.
Old transmission lines strung on wooden poles present high system losses that impact electricity prices at nodes serviced by these lines. These lines were commissioned in 1954 and 1963 to evacuate power from the country' s first electricity generation station (Nalubaale hydro power plant) commissioned in 1954. The lines have ACSR 125 and ACSR 132 conductors which have relatively high resistances and low current-carrying capacities. Scenario 1 was remodeled with parameters of the new Tororo-Opuyo-Lira line (currently under construction to replace the old line) and the loss component of LMPs at Lira and Opuyo substations dropped by 38.2% and 25.5% respectively. Refurbishment of such old transmission lines on the bulk network is needed to ensure fair pricing across the market.
IV. CONCLUSION
This paper set out to investigate the performance of the Uganda bulk network in a wholesale electricity market system. A model of Uganda's bulk network was built in Power World simulation software and validated. Generator cost functions were then developed and incorporated into the model to enable wholesale market simulations.
The nodal wholesale market simulation results showed that energy losses on the bulk network could fall to 3.8% from an average of 4.3% in the current dispatch system. It was noted that off-peak and peak electricity prices could fall by 68.6% and 13.5% respectively with a transition to wholesale market. It was also observed that the southern and western, central, eastern and northern regions of the country would exhibit a level of price independence during contingencies.
This next restructuring step in Uganda's electricity market would require proper planning to address technical issues that have been exposed by this work. Among such issues is transmission congestion management. In this paper, the network reconfiguration technique has been applied to address manifestations of congestion. High loss old transmission lines were seen to negatively impact market prices. It was noted that refurbishment of these wooden pole construction lines with new pylon structures and superior low loss conductors would ensure fair pricing at the respective nodes.
REFERENCES
[1] P. Cramton, "Electricity market design," Oxford Rev. Econ. Policy, vol. 33, no. 4, pp. 589-612, Nov. 2017, doi: 10.1093/oxrep/grx041. [ Links ]
[2] A. J. Wood, B. F. Wollenberg, and S. B. Gerald, Power Generation Operation And Control, 3rd ed. Wiley-Interscience, 2013.
[3] S. Hunt, MAKING COMPETITION WORK IN ELECTRICITY, 1st ed. New York: John Wiley & Sons, 2002. [ Links ]
[4] C. Godinho and A. Eberhard, "Learning from Power Sector Reform Experiences: The Case of Uganda," Policy Research Working Paper; No. 8820, 2019, World Bank, Washington, DC. © World Bank. https://openknowledge.worldbank.org/handle/10986/31562
[5] Electricity Regulatory Authority, "Tariff Review Report for 2018 December 2017," Kampala, Uganda, 2018. [Online]. Available: https://www.era.go.ug/index.php/tariffs/tariff-reviews.
[6] Electricity Regulatory Authority, "ERA Reduces Electricity Tariffs for the Extra-Large Industrial Consumers," 2018. https://www.era.go.ug/index.php/media-centre/what-s-new/235-era-reduces-electricity-tariffs-for-the-extra-large-industrial-consumers (accessed Feb. 22, 2019).
[7] P. Yangdon, "Modeling and Analysis of Competitive Electricity Market in Bhutan.," Chalmers University of Technology, 2009.
[8] E. Ela, M. Milligan, A. Bloom, A. Botterud, A. Townsend, and T. Levin, "Evolution of Wholesale Electricity Market Design with Increasing Levels of Renewable Generation," Denver, 2014. doi: 10.1007/978-0-387-78171-6.
[9] M. Shahidehpour, "Power System Economics: Designing Markets for Electricity," IEEE Power Energy Mag., vol. 99, no. 1, pp. 63-64, 2003, doi: 10.1109/MPAE.2003.1180363. [ Links ]
[10] E. Ela, B. Kirby, N. Navid, and J. Smith, "Effective Ancillary Services Market Designs on High Wind Power Penetration Systems," Conf. Pap. NREL/CP, pp. 5500-53514, Jul. 2012, doi: 10.1109/PESGM.2012.6345361.
[11] C. Barbulescu and S. Kilyeni, "Congestion Management. Transmission expansion planning considering large wind power plants," in SACI 2011 -6th IEEE International Symposium on Applied Computational Intelligence and Informatics, Proceedings, 2011, pp. 559-564, doi: 10.1109/SACI.2011.5873066.
[12] R. Guguloth and T. K. S. Kumar, "LMP calculation and OPF based congestion management in deregulated power systems," in 2016 ELEKTRO, 2016, pp. 299304, doi: 10.1109/ELEKTRO.2016.7512085.
[13] L.Rajalakshmi, M. . Suganyadevi, and S. Parameswari, "Congestion Management in Deregulated Power System by locating Series FACTS devices," Int. J. Comput. Appl., vol. 13, no. 8, pp. 19-22, Jan. 2011, doi: 10.5120/1801-2404. [ Links ]
[14] B. K. Panigrahi, "Locational Marginal Pricing ( LMP ) in Deregulated Electricity Market," Int. J. Res. Advent Technol., vol. 4, no. 2231, pp. 101-105, 2012, [Online]. Available: www.ijrat.org. [ Links ]
[15] T. Orfanogianni and G. Gross, "A general formulation for LMP evaluation," IEEE Transactions on Power Systems, vol. 22, no. 3. pp. 1163-1173, 2007, doi: 10.1109/TPWRS.2007.901297. [ Links ]
[16] S. Gumpu, B. Pamulaparthy, and A. Sharma, "Review of Congestion Management Methods from Conventional to Smart Grid Scenario," Int. J. Emerg. Electr. Power Syst., vol. 20, no. 3, pp. 1-24, 2019, doi: 10.1515/ijeeps-2018-0265. [ Links ]
[17] S. Balamurugan, "Congestion Management for Multi Area Deregulated Power System Using Price Area Concept," 2017 Int. Conf. Technol. Adv. Power Energy ( TAP Energy), pp. 1-6, 2017.
[18] S. Bhattacharya and B. Ranjan, "Transmission Congestion Management in Restructured Power System by Rescheduling of Generators Using TLBO," 2017.
[19] M. S. Kumar and C. P. Gupta, "Congestion management in a pool model with bilateral contract by generation rescheduling based on PSO," in 2012 International Conference on Advances in Power Conversion and Energy Technologies (APCET), 2012, pp. 1-6, doi: 10.1109/APCET.2012.6302007.
[20] T. Nireekshana, J. Bhavani, and G. K. Rao, "Optimal Rescheduling of Generation for Congestion Relief in Deregulated Power Systems," 2017 IEEE Int. Conf. Power, Control. Signals Instrum. Eng., pp. 1823-1829, 2017.
[21] UETCL, "Grid Development Plan 2018-2040," Kampala, 2018. [Online]. Available: https://uetcl.go.ug/grid-development-plan-2018-2040/.
[22] Electricity Regulatory Authority, "Installed Capacity," Electricity Regulatory Authority, 2019. https://www.era.go.ug/index.php/stats/generation-statistics/installed-capacity (accessed Jan. 19, 2021).
[23] Energy Sector GIS Working Group 2019, "Energy Utilities of Uganda," 2019. https://www.arcgis.com/apps/View/index.html?appid=42680a3d3e0f4ce3ab408adf1a2c5c57.
[24] K. Branker, M. J. M. Pathak, and J. M. Pearce, "A review of solar photovoltaic levelized cost of electricity," Renew. Sustain. Energy Rev., vol. 15, no. 9, pp. 4470-4482, 2011, doi: 10.1016/j.rser.2011.07.104. [ Links ]
[25] Electricity Regulatory Authority, "Feed-In-Tariff," 2019. https://www.era.go.ug/index.php/tariffs/generation-tariffs/feed-in-tariff (accessed Jan. 02, 2020).
[26] J. Steinbuks, "Assessing the accuracy of electricity production forecasts in developing countries," Int. J. Forecast., vol. 35, no. 3, pp. 1175-1185, 2019, doi: 10.1016/j.ijforecast.2019.04.009. [ Links ]
[27] J. Ringwood, D. Bofelli, and F. T. Murray, "Forecasting Electricity Demand on Short, Medium and Long Time Scales Using Neural Networks," J. Intell. Robot. Syst., vol. 31, pp. 129-147, May 2001, doi: 10.1023/A:1012046824237. [ Links ]
[28] P. Boonkham and S. Surapatpichai, "A New Method for Electric Consumption Forecasting in a Semiconductor Plant," Int. J. Adv. Res. Comput. Commun. Eng., vol. 2, no. 10, pp. 4085-4090, 2013. [ Links ]
[29] Electricity Regulatory Authority, "Energy Purchases, Sales and Losses," 2019. https://www.era.go.ug/index.php/stats/transmission-stats/energy-purchases-sales-and-losses (accessed Dec. 05, 2019).
[30] Electricity Regulatory Authority, "Umeme BST," Electricity Regulatory Authority, 2019. https://www.era.go.ug/index.php/tariffs/bulk-supply-tariffs/umeme-bst (accessed Jan. 23, 2021).

Jensen Nduhuura was born in Mitooma district, Uganda in 1993. He attained a Bachelor of Science degree in Electrical Engineering from Makerere University in 2016 and is currently finalizing a Master of Science degree in Power Systems Engineering at Makerere University. He is currently employed at Umeme Limited, an electricity distribution company in Uganda, as an Investments Planning Engineer.

Dr. Geofrey Bakkabulindi attained a Master of Engineering (MEng) degree in Electronic and Communications Engineering from the University of Leeds in 2006 and a PhD in Electrical Engineering from KTH Royal Institute of Technology (Sweden) and Makerere University (Uganda) in 2014. He is currently a Lecturer at the Department of Electrical and Computer Engineering, Makerere University in Kampala, Uganda.

Dr. Milton Edimu completed his undergraduate and graduate studies from Makerere University and the University of Cape Town respectively. He has significant experience in power systems modelling and design, renewable energy, sustainable energy, policy, and regulation. He has worked in both private sector and academia.

