


Services on Demand
Article
 English (pdf)
 Article in xml format
 Article references
Indicators

Related links
-
 Cited by Google
 -
 Similars in Google
Share

 Permalink
SAIEE Africa Research Journal
On-line version ISSN 1991-1696
Print version ISSN 0038-2221
SAIEE ARJ vol.112 n.1 Observatory, Johannesburg Mar. 2021
ARTICLES
Detection of Bryde's Whale Short Pulse Calls using Time Domain Features with Hidden Markov Models
Oluwaseyi P. BabalolaI; Ayinde M. UsmanII; Olayinka O. OgundileIII; Daniel J. J. VersfeldIV
IDepartment of Electrical and Electronic Engineering, Stellenbosch University, Stellenbosch, 7600 South Africa e-mail: seyi852002@gmail.com
IIDepartment of Electrical and Electronic Engineering, Stellenbosch University, Stellenbosch, 7600 South Africa e-mail: 23172908@sun.ac.za
IIIDepartment of Electrical and Electronic Engineering, Stellenbosch University, Stellenbosch, 7600, and Department of Computer Science, Tai Solarin University of Education, Ijebu Ode 2118, Nigeria e-mail: ogundileoo@gmail.com
IVDepartment of Electrical and Electronic Engineering, Stellenbosch University, Stellenbosch, 7600 South Africa e-mail: djjversfeld@sun.ac.za
ABSTRACT
Passive acoustic monitoring (PAM) is generally used to extract acoustic signals produced by cetaceans. However, the large data volume from the PAM process is better analyzed using an automated technique such as the hidden Markov models (HMM). In this paper, the HMM is used as a detection and classification technique due to its robustness and low time complexity. Nonetheless, certain parameters, such as the choice of features to be extracted from the signal, the frame duration, and the number of states affect the performance of the model. The results show that HMM exhibits best performances as the number of states increases with short frame duration. However, increasing the number of states creates more computational complexity in the model. The inshore Bryde's whales produce short pulse calls with distinct signal features, which are observable in the time-domain. Hence, a time-domain feature vector is utilized to reduce the complexity of the HMM. Simulation results also show that average power as a time-domain feature vector provides the best performance compared to other feature vectors for detecting the short pulse call of inshore Bryde's whales based on the HMM technique. More so, the extracted features such as the average power, mean, and zero-crossing rate, are combined to form a single 3-dimensional vector (PaMZ). The PaMZ-HMM shows improved performance and reduced complexity over existing feature extraction techniques such as Mel-scale frequency cepstral coefficients (MFCC) and linear predictive coding (LPC). Thus, making the PaMZ-HMM suitable for real-time detection.
Index Terms: Acoustic signal, Bryde's whales, hidden Markov models, passive acoustic monitoring, time-domain features.
I. Introduction
MARINE mammal populations are threatened by a number of factors, including but not limited to climate change and human activities. Nevertheless, effective monitoring and management of marine living resources, where these organisms live in a vast, largely inaccessible and hostile environment, requires innovation and the use of best available technologies and methods [1]. Specifically, the monitoring of cetacean populations proves to be very difficult due to the many challenges such as weather, limited daylight, ocean conditions, and the cost of observing animals at sea. For instance, electromagnetic signals such as light waves and radio waves are quickly dispersed underwater, and therefore systems employing these signals have an effective range of a few meters. Moreover, systems that rely on acoustic signals have an effective reach, which can exceed thousands of meters.
A unique characteristic of cetaceans is that they utilize sound, both passively and actively, to navigate and find resources. Therefore, studies such as [2], [3] have implemented passive acoustic monitoring (PAM) and found that these techniques were effective, while not causing any significant environmental damage to aquatic animals and their environment. The PAM systems passively acquires acoustic signals from the surrounding environment and are analyzed in order to extract information (features) from the received signals.
PAM algorithms perform three main functions, namely detection, classification and tracking. Formally, signal detection and classification can be seen as the implementation of a statistical hypothesis test. On the basis of observations, the aim of the detection theory is to accept or reject a hypothesis. Within the field of PAM, the objective therefore is to detect whether a signal or vocalization from a marine mammal of interest can be found in the data recording. Classification is the more general case, where a given number of hypotheses, say M are tested, that is, the detected signal is classified as belonging to one of these M possible classes.
Signal detection can be performed manually [4]-[6]. However, this approach is inefficient and impractical, as it is likely to involve human error, particularly when acoustic recordings are made over a long duration. Thus, the detection and classification of signals using algorithms implemented on computer devices is an important field of research, since it yields more accurate detection.
In the literature, automated detection and classification of cetaceans is performed using borrowed techniques from communication theory, such as correlation and matched filters [7], [8]. Other methods include energy summation in a certain band together with statistical classification [8]-[11], image-processing techniques in the frequency domain [12], spectrogram-based template matching [13] as well as wavelet decomposition [14] and Neural networks [15]. More so, the classification of cetacean signals is implemented using various optimal classifiers such as dynamic time warping (DTW) [16]-[18], artificial neural networks (ANN) [15], [19], support vector machine (SVM) [20], hidden Markov model (HMM) [21], [22], and so on. However, the choice of the detector and classifier, together with its performance depends on the feature vector, the species involved, the volume of data, and the location of recordings among others [23].
Bryde's whales are members of the Balaenopteridae family in the cetaceans class, which are usually classified into two main allopatric forms: Balaenoptera edeni edeni (inshore form), and Balaenoptera edeni brydei (large offshore form) [24]-[27]. The population and geographical distribution of the Bryde's whale species was discussed in [24], [26], [28], while other literature considered the classification of the Bryde's whale in terms of genetic and vocal repository [25], [29]-[31]. It is important to distinguish the vocal characterization of the Bryde's whales from other species such as the Sei whale, since they are similar in physical appearance [31], [32]. Although HMMs are already in use for vocalizations of other whale species, such as blue whales (for example, see [33], [34]), not many authors have discussed the automated detection of Bryde's whale acoustics. The HMM was employed to automatically detect Bryde's whale call using the MatlabHTK toolbox in [32]. In this case, default parameters (that is, sound signal, window size, and number of cepstral parameters) were used for feature extraction.
In this paper, a reduced complexity and enhanced performance time-domain feature extraction technique (PaMZ) that can be used with the HMM (PaMZ-HMM) to automatically detect short pulse calls of inshore Bryde's whales is developed. The proposed algorithm utilizes three key features: average power, mean, and zero-crossing rate, of the acquired Bryde's whale sound. The statistical-based approach has shown to be the most suitable detection technique given its robustness, efficiency and reduced computational time [35], [36]. Hence, the HMM is used in this study to predict a sequence of unknown (hidden) variables given the set of acoustic characteristics, known as the observations. The outcome of this study is inventive and yields high sensitivity, high accuracy, and low false positive rate compared to existing MFCC-HMM and LPC-HMM. In addition, the proposed PaMZ-HMM algorithm can be applied to other class of cetaceans with similar characteristic calls.
II. Data collection and Processing
Inshore Bryde's whales with short pulse call are considered in this study as they are one of the most endangered marine mammals in the world. The population growth of Bryde's whales is relatively small, although not enough information is provided as to their estimated population size. The vocalization of Bryde's whales from Eastern Tropical Pacific, Southern Caribbean, and Northwest Pacific have a frequency range of 21 -207 Hz and a time span of 0.35 -2.8 s [37]. Other Bryde's whales call from Southeast Brazil reveal more call types with a duration of 0.8 - 1.5 s within a frequency range of 9 - 670 Hz [38]. Moreover, for a case study of Bryde's whales in the Gulf of California, the sound of the whales is described as having fundamental values ranging from 90 - 900 Hz and a duration range from 25 ms to 1.4 s [39]. Thus, it is important to develop an automated detection method that precisely detects this particular short pulse call of the inshore Bryde's whales' in the presence of many other sounds.
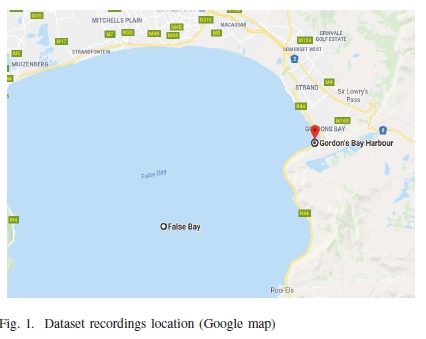
The raw sound data was collected using PAM within a few of days of January 2019. The dataset consists of short pulse calls of inshore Bryde's whales along with dissimilar sounds like those of other marine mammals and noise of various forms. This dataset is obtained from four separate recordings with a total of 44 hr and 26 mins. In terms of the geographical location, the data was recorded close to Gordon's bay harbor situated at 34°8'57.5"S, 18°51'26.7"E and in False bay situated at 34°12'38.9"S, 18°38'27.3"£, South Africa, as seen in Figure 1.
Standard guidelines have been strictly followed during recording, as stipulated by the South African Department of Environmental Affairs [40], [41]. Among other items, the recommended minimum distance of 300 m away from the animal was observed. Recordings were made on sighting the inshore Bryde's whale that corresponds to the physical appearance descriptions in [42]. Also, to verify the test, recordings were performed in the absence of Bryde's whale from the vicinity. In this case, no short pulse call was reported. Short pulse call of inshore Bryde's whales was recorded by attaching a hydrophone to a Zoom H1N recorder. Specifically, Aquarian Audio H2A-XLR hydrophone with sensitivity of -180dB re1V at a frequency interval of 10 Hz - 100 kHz and the recorder operating at 24 bit resolution at a sampling frequency Ψψof 96000 Hz. The hydrophone was submerged from a 8 m long inboard motor sailboat, under varying conditions of sailing (2 - 4 kts/h), dropping sails (< 1 kt/h), and heaving (< 2 kts/h). The raw data was stored as a .wav file, that is, in an uncompressed and lossless format, to retain its original property.
Furthermore, the raw data was filtered to remove unwanted signal frequencies, that is, background noise and DC components. This is achieved by using the MATLAB 3rd order Butterworth bandpass filter due to its smooth frequency response in the passband. The passband frequency was chosen between 90 Hz and 46000 Hz since the basic call frequency of Bryde's whale is generally greater than 90 Hz [37], while the upper band frequency is half the sampling rate of the data. Thus, a pre-processed data is obtained with less attenuation.
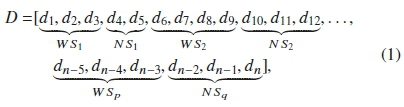
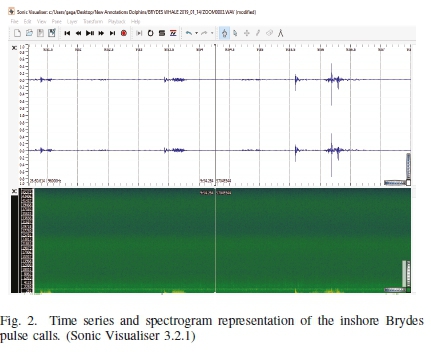
The pre-processed sound dataset is analyzed by visual and auditory inspection using the Sonic Visualiser - version 3.2.1 software as shown in Figure 2. This dataset is annotated as the Bryde's whale vocalization segment known as the Whale snippet WS, and any other sound segment (produced either by anthropogenic activities or other marine mammals), known as the Noise snippet NS. For instance, let D be the pre-processed dataset containing n-sampling points. D can be visually annotated as:
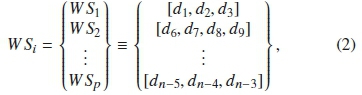
where d represents the n-sampling points. p and q are the total numbers of whale and noise snippets respectively. Each snippet has a different length or call duration and thus, each categorized snippet is stored in the corresponding sets WSi and NSj as:
where i = 1,2,... p, and
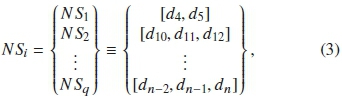
where i = 1,2,...q.
The HMM is a stochastic process with non-observable underlying mechanism. This hidden mechanism can only be observed by a different set of stochastic processes that generate the observed sequence symbols [43]. For a continuous signal, HMM performs the processes of training, decoding, and detecting for a given set of extracted vectors as shown in Figure 3. The HMM training process involves estimating three important parameters: initial start probability π, transition probability matrix Γ, and emission distribution matrix e. The Γ matrix represents the probabilities γ of transiting from one state to another, while e = {μ, σ} is directly associated with the observation symbols, where μ is the mean, σ is the standard variation matrix. Thus, the maximum-likelihood of HMM parameters λ = (π, r,e) is estimated in order to maximize the occurrence of a sequence of extracted signal features using the Expectation-Maximization (E-M) algorithm [44], [45].
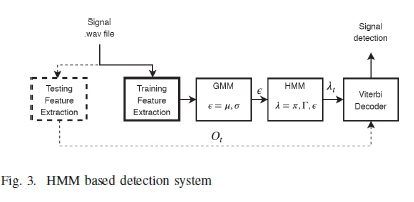
During decoding, the most probable hidden state of the models is obtained using the Viterbi algorithm [46], [47]. The algorithm utilizes the estimated parameters λt and the testing feature vector Otto generate the best state sequence ω. Subsequently, detection is performed on ω to determine whether or not the signal is received correctly. The performance of the HMM depends on the extracted features, which are typically determined during the detection process. Therefore, the focus of this study is to determine the best time domain feature vector. Here, the performance is measured based on the following [48]:
1) Sensitivity (S),
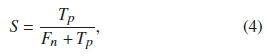
where Tpis the true positives, which is the number of times the output of the automated sound detector corresponds to the manually identified sound. On the other hand, Fnis the false negatives, which is the number of times the automated sound detector does not correspond to the manually identified sound.
2) Accuracy (Acc),
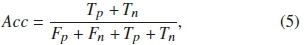
where Tn is the true negative, which evaluates the number of correctly rejected sounds. That is, the number of times the automated model predicts the wrong signal just as the wrongly identified signal. Also, the Fpis the false positives, which is the number of times the automated detector identifies a wrong signal as the call to be detected.
3) False Positive Rate (FPR),
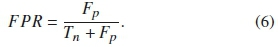
The FPR is computed as the ratio between the number of times the automated detector categorizes a wrong signal as the call to be detected ( Fp) and the total number of times the detector categorizes the actual rejected sounds (Tn + Fp).
IV. Feature Extraction for HMMs
The feature extraction process can be performed in time or frequency domains. The Mel Frequency Cepstral Coefficients (MFCC) and Linear Predictive Coefficients (LPC) are often used as frequency domain techniques in speech recognition and other applications [49], [50]. More so, both the MFCC and LPC are popular feature extraction algorithms used with the HMM [32], [51]. The MFCC derives feature coefficients by converting the signal from time domain to the Mel frequency scale, which represents the short-term power spectrum of the sound. The scale compares the recognized frequency of a raw sound with its original measured frequency. The steps for feature extraction using the MFCC entails: pre-emphasis, framing, windowing, fast Fourier transform (FFT), mel-scale filter bank, logarithm operation, and discrete cosine transform (DCT) [52]. The MFCC computes the coefficients as [53]:
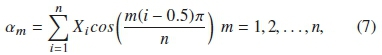
where n is the total number of cepstral coefficients and X,· is the logarithmic energy of the ithMel spectrum band.
In the case of LPC, the technique utilizes a linear combination of initial established ζth signal to predict a value for the actual sound signal H(ζ) as described by [43], [54]:
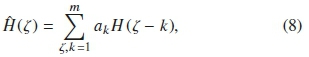
where H(ζ - k) is the initial ζ signal. Also, akis the filter coefficients of order m, which values are derived from the prediction error:

using the autocorrelation approach.
In this paper, inshore Bryde's whale produces short pulse calls with unique signal characteristics such as observable and limited call duration, mean, and average power. Also, the amplitude of the signal is observable, and can be used to compute the zero-crossing rate of this pulse call. Thus, three important time-domain features: average power P, mean μ, and zero-crossing rate Z, are employed independently as feature vectors with respect to the frame duration and number of states. Consequently, the features are combined, in no specific order, to obtain a single vector known as (PaMZ).
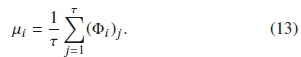
These features are obtained by first framing each snippet of the pre-processed signal. The frame length ρ is given as:
where Fψand Fδare the sampling frequency and frame duration respectively. Suppose υ is the number of sampling points in a given snippet, say WS¡. The number of frames η in the snippet is computed as:
such that the x-sampling points in WS¡ are framed as:
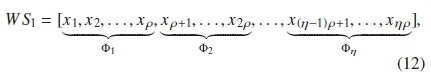
where Φ,·, i = 1,2,..., η are the frames, and each frame contains τ number of sampling points.
Consequently, the feature formulas are applied on Φ,· to yield a scalar value, signifying the value of that particular feature over the length of the ith frame. The mean μ of the ith framed signal is obtained as:
This generates a mean vector for the complete η as:

Similarly, average power P of the ith framed signal is computed as:
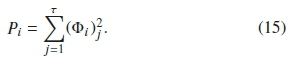
Thus, the P vector is obtained for all the η as:
The P is a good measuring tool to differentiate detectable and silent sounds with a high signal-to-noise ratio [49]. More so, the Z measures the rate at which the framed signal changes its sign at the ith frame as:
where sgn[Φi)j] is a signum function such that,
The Z values are within a relatively small range compared to the absolute range of the frequency distribution. Therefore, the Z vector is formed as:

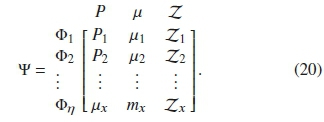
For every snippet, the set of extracted features is represented as:
V. Results and Discussion
A. Training
All the recordings (44 hr 26 min long) collected during PAM were aurally and visually analyzed using the spectrogram in the Sonic Visualiser. Several 2 hrs recordings were extracted from the accumulated dataset (recordings), where each of the
2 hrs recordings were divided into two sections. A part is used for training the model, while the remaining part is used as a sequence of observation or test data, to evaluate the model. The test data is annotated into two segments: 1.) Inshore Bryde's whale vocalization (Whale snippet, WS), and 2.) other sounds apart from the whale pulse call (Noise snippet (NS)). Hence, two HMM's were obtained as λw = (π1 Γ1,e1) and λ N = (π2, Γ2,e 2). During training of each model, the number of states N is varied from 3, 5, and 10 states. Also, the frame duration Fgof the snippets are varied from 1, 5, and 10 ms to obtain varying sets of feature vectors in Ψ. Performance analysis are implemented for the varying parameters N and Fgsince they are known to influence the HMM.
Furthermore, the trained λ w and λ n are combined into a single model before being fed into the decoder. The initial state probability distributions are concatenated as π = [π1,π2], while the transition probability matrices are represented as a block diagonal matrix:
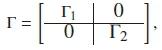
where Γ1 is an N χN matrix with states {W1, W2,... WN}, and Γ2 is an N χN matrix with states {N1, N2,... NN}. Likewise, the combined emission distribution becomes e = [e 1,e2], where e 1 = (and e2 = (μ2,σ2). Therefore, the decoder operates on these estimated parameters, with equal switching probability for Γ, and the testing feature vector to determine the best state sequence ω. The ω eventually detects whether the test signal is either the whale pulse call or noise.
B. Performance comparison of each extracted feature
Performance of the automated HMM detector is executed by varying N and Fg using standard of measurement in the literature [21]. Of importance, the time domain features (average power, mean, and zero-crossing rate) are computed depending on the frame duration of a snippet.
1) Frame duration - 1 ms: Table I shows the performances of the P, μ, and Z extracted features using different states with a frame duration of 1 ms. It is observed in Table I that the three extracted features have the highest percentage of sensitivity when 10 states are used compared to when 3 and 5 states are used. Likewise, the extracted features are mostly accurate when 10 states are used by a model in comparison to 3 and 5 states. Moreover, the FPR performances of P, μ and Z indicate that using 10 states produce the best performance as compared to the model with 3 and 5 states. Consequently, the performances of each extracted feature are analyzed using 10 number of states.
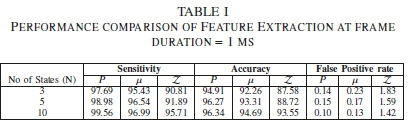
In this case, the P is the most sensitive (99.56%) feature compared to 96.99% and 95.71% sensitivity for μ and Z accordingly. Furthermore, Table I shows that P feature is most accurate since it yields 96.34% as compared with the μ and Z that produce 94.69% and 93.55% respectively. In addition, the P continues to show the best performance as it exhibits the lowest FPR of 0. 10 in comparison to the μ with 0. 13 FPR, and Z with 1 .42 FPR. By implication, Z will produce the least performance, followed by the μ. But, the P has the best performance with regard to Table I, and could be considered as a time domain feature for an HMM.
2) Frame duration - 5 ms: Table II indicates the performance comparison of each feature extraction with an increased frame duration from 1 ms to 5 ms. This implies that fewer number of frames are used and thus, reducing the computational time to train and detect the dataset. Similar to the frame duration of 1 ms, the features exhibit the best performances in terms of sensitivity, accuracy and FPR when 10 states are used in a model as compared to using 3 and 5 states. As a result, we analyze each extracted feature based on the sensitivity, accuracy and FPR measures when N = 10. The percentage of correctly identified sounds being the sensitivity, presents a P feature of 3.32% and 8.09% more than the μ and Z respectively. More so, the P exhibits 3.43% and 8.24% accuracy gain over the μ and Z respectively. In addition, the P shows a low FPR of 0.11 in comparison to 0.16 and 1.59 FPR produced by the μ and Z respectively. This result indicates that extracting the P as a feature enhances the performance of the model compared to the μ and Z features.
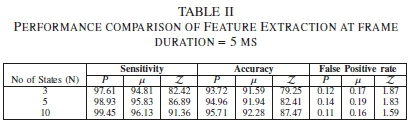
However, a trade off occurs between the computational time and all the three performance parameters (sensitivity, accuracy and FPR) considered for the model. For sensitivity; P, μ and Z yield a performance loss of 0.11%, 0.86%, and 4.35% respectively in Table II. A similar performance loss of 0.63%, 2.41%, and 6.08% is obtained for P, μ and Z respectively, with regard to accuracy in Table II. Also, considering the FPR, the extracted features in Table II produce 0.01%, 0.03%, and 0. 17% performance less than Table I. The performance loss is due to the use of less amount of data (as feature vectors) during the training and detection phases.
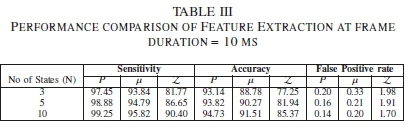
3) Frame duration - 10 ms: Table III shows a further ncrease in the frame length. This is to verify the performance of the extracted features based on an increase in the frame duration from 5 ms to 10 ms. Similar to Tables I and II, the model exhibits the best performance when 10 states are used. Here, P yields a 99.25% sensitivity measure as compared with μ and Z that produce 95.82% and 90.40% respectively. In addition, the P has an accuracy performance of 94.73% compared to 91.51% of the μ and 85.37% of the Z. Therewithal, the P exhibits the least FPR of 0.14 as compared to 0.20 and 1.70 of the μ and Z respectively. Hence, the P exhibits an overall performance gain compared to the μ and Z, making it the most competent time domain feature for the automated model.
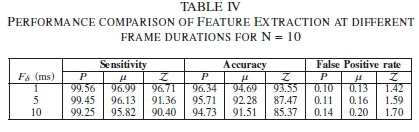
C. Different frame durations forN=10
Table IV illustrates that increasing the frame duration from 5 ms to 10 ms results in a reduced sensitivity of 0.2%, 0.31%, 0.96% for P, μ, Z respectively. Comparing the sensitivity measure of Tables I and III shows an ample difference of 0.31%, 1.17%, 5.31%, for P, μ, Z respectively. Likewise, the accuracy performance of each extracted feature is reduced by 0.98%, 0.77%, 2.1% and 1.61%, 3.18%, 8.18%, when the frame length increases from 5 ms to 10 ms and 1 to 10 ms respectively. Furthermore, the FPR measure shows a decrease in P, μ, Z of 0.03, 0.04, 0.11 and 0.04, 0.07, 0.28 as a result of an increase in the frame duration from 5 ms to 10 ms and 1 ms to 10 ms respectively.
D. Performance comparison of the proposed PaMZ-HMM with LPC-HMM and MFCC-HMM
The performance of the proposed PaMZ-HMM detector at N = 5 is compared to conventional LPC-HMM and MFCC-HMM in Table V. Tables I to IV indicate that Fs= 1 ms yields the best performance as compared to increasing the frame duration, that is, Fs= 5 ms, and Fs= 10 ms. Thus, the frame duration is fixed as Fs= 1 ms, while the number of samples used to train the HMM is varied as k = 6,12,18. Here, the PaMZ-HMM yields improved performance compared to LPC-HMM and MFCC-HMM for all k values.
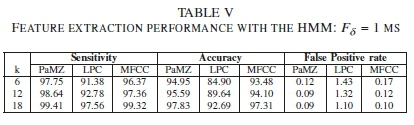
The MFCC typically uses a total number of cepstral coefficients n ranging from 10 to 14 [23], [32], which has been shown to produce low computational complexity compared to other HMM based feature extraction methods [53]. Here, the 12-dimensional MFCC-HMM and LPC-HMM models are used compared to the 3-dimensional PaMZ-HMM. The result in Table V shows that the PaMZ-HMM exhibits improved performance with low computational time complexity. For instance, at k = 18, the PaMZ-HMM has a sensitivity performance gain of 1 .85% and 0.09%, an accuracy performance gain of 5.14% and 0.52%, and an FPR performance gain of 1.01% and 0.01% over LPC-HMM and MFCC-HMM respectively.
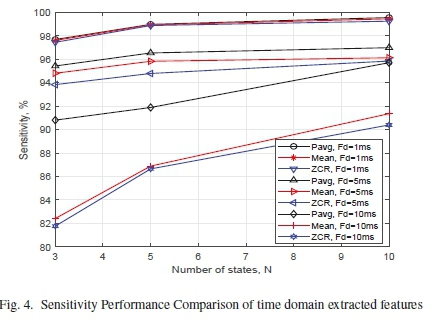
A more in-depth analysis of the performance parameters is shown in Figures 4 to 7. In Figure 4, the sensitivity performance of the time domain features are compared based on the frame duration. As the number of states used increases, P is slightly more sensitive compared to the μ and Z at frame duration of 1 ms. In the same way, P presents the highest sensitivity performance as compared with the μ and Z at frame durations of 5 ms and 10 ms. Moreover, the P offers the general best performance in all the three frame durations. Hence, the P is the most sensitive time domain feature for the automated model.
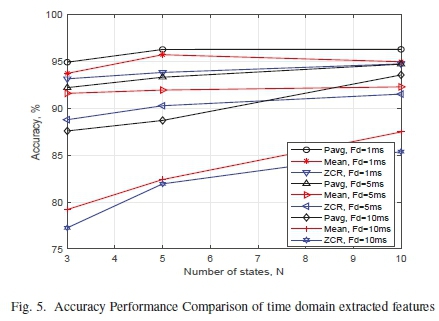
In addition, Figure 5 shows the accuracy performance comparison of the time domain features according to the frame durations. The figure shows that P offers the highest accuracy performance compared to the μ and Z at 1 ms frame duration. Also, the accuracy of P at frame duration of 1 ms approaches the Z at 1 ms when the model constitutes 10 states. Even more, P at 10 ms frame duration exhibits an accuracy which is greater than the accuracy of the μ and Z at the frame duration of 5 ms. This implies that P yields a more accurate model as compared to μ and Z, despite the increase in the frame duration of the model.
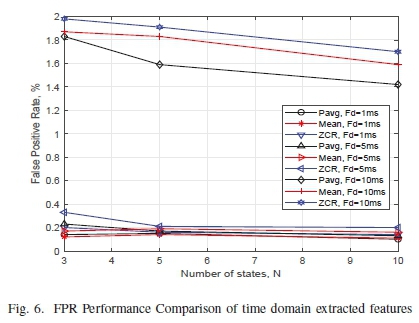
Furthermore, the time domain features at a frame duration of 10 ms demonstrate the least FPR in Figure 6 since the features with the lowest FPR is an indication of a model with best performance. The P at frame duration of 1 ms has approximately the same performance in comparison to the μ and Z when 5 and 10 states are used in the model. Nevertheless, P yields the least FPR at 5 and 10 when the model constitutes any of the three number of states.
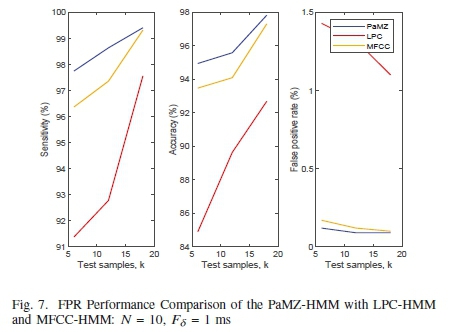
Moreover, Figure 7 shows the comparative parameters; the sensitivity, accuracy, and false positive rate performance of the integrated PaMZ-HMM compared to the LPC-HMM and MFCC-HMM using the frame duration of Fs = 1 ms. The LPC yields the least performance, while the PaMZ produces the best performance.
VI. Conclusion
In this paper, an automated acoustic detector for Bryde's whale vocalizations, based on time-domain features, average power P, mean μ, zero-crossing rate Z, and the hidden Markov model technique is developed. The number of states used in a model during the training process was varied as either 3, 5 or 10 states. On a general observation, the model exhibits best performances when 10 states are used. Also, with regard to the frame duration of the snippets, the model yields an overall best performance when a short frame duration of 1 ms is considered, in comparison to 5 ms and 10 ms.
Moreover, the model offers the best performance while using the P as the extracted feature, in comparison to the μ and Z extracted features. However, the μ presents a similar low FPR with the P when the model has 5 and 10 states, at 1 ms frame duration. Also, with respect to these three time-domain features, the model shows to be sensitive and dependable as it yields a low FPR in the overall performance. From the analysis and discussion of the results obtained in this study, average power proves to be the best time domain feature for the detection of short pulse call of inshore Bryde's whales based on the hidden Markov model technique. More so, combining the feature vectors produces better performance compared to MFCC and LPC. Also, the combined PaMZ exhibits a reduced computational time complexity with the HMM process, and can be utilized in real-time acoustic detection.
References
[1] N. Funke, M. Claassen, R. Meissner, and K. Nortje, Reflections on the state of research and technology in South Africa's marine and maritime sectors, 01 2014.
[2] R. Odom, "An introduction to underwater acoustics: Principles and applications," Eos, Transactions American Geophysical Union, vol. 84, 01 2003. [ Links ]
[3] D. M. John Simmonds, Fisheries Acoustics: Theory and Practice (Fish and Aquatic Resources), 2nd ed., 2006.
[4] C. Clark, R. Charif, S. Mitchell, and J. Colby, "Distribution and behavior of the bowhead whale, balaena mysticetus, based on analysis of acoustic data collected during the 1993 spring migration off point barrow, alaska," Report for the International Whaling Commission, vol. 46, 01 1996. [ Links ]
[5] K. Stafford, S. Nieukirk, and C. Fox, "Low-frequency whale sounds recorded on hydrophones moored in the eastern tropical pacific," The Journal of the Acoustical Society of America, vol. 106, pp. 3687-98, 12 1999. [ Links ]
[6]--, "Geographic and seasonal variation of blue whale calls in the north pacific," Journal of Cetacean Research and Management, vol. 3, 01 2001. [ Links ]
[7] K. M. Stafford, "Characterization of blue whale calls from the northeast pacific and development of a matched filter to locate blue whales on the u.s. navy sosus (sound surveillance system) arrays," Master's thesis, Oregon State University. Master's Thesis (Wildlife Science), Corvallis, Oregon, 1995 1995. [Online]. Available: http://hdl.handle.net/1957/15875 [ Links ]
[8] S. Nanaware, R. Shastri, Y. Joshi, and A. Das, "Passive acoustic detection and classification of marine mammal vocalizations," in 2014 International Conference on Communication and Signal Processing, April 2014, pp. 493-497.
[9] K. Fristrup and W. Watkins, "Marine animal sound classification," The Journal of the Acoustical Society of America, vol. 97, 05 1995. [ Links ]
[10] J. Oswald, S. Rankin, and J. Barlow, "The effect of recording and analysis bandwidth on acoustic identification of delphinid species," The Journal of the Acoustical Society of America, vol. 116, pp. 3178-85, 12 2004. [ Links ]
[11] T. Lin, H. Yu, L. Chou, and C. Chen, "Passive acoustic monitoring on the seasonal species composition of cetaceans from the marine cable hosted observatory," in OCEANS 2014 - TAIPEI, April 2014, pp. 1-6.
[12] D. Gillespie, "Detection and classification of right whale calls using an edge detector operating on a smoothed spectrogram," Canadian Acoustics, vol. 32, no. 2, pp. 39-47, Jun. 2004. [Online]. Available: //jcaa.caa-aca.ca/index.php/jcaa/article/view/1586 [ Links ]
[13] D. Mellinger and C. Clark, "Recognizing transient low-frequency whale sounds by spectrogram correlation," The Journal of the Acoustical Society of America, vol. 107, pp. 3518-29, 07 2000. [ Links ]
[14] M. Lopatka, O. Adam, C. Laplanche, J. Zarzycki, and J.-F. Motsch, "An attractive alternative for sperm whale click detection using the wavelet transform in comparison to the fourier spectrogram," Aquatic Mammals, vol. 31, pp. 463-467, 12 2005. [ Links ]
[15] J. R. Potter, D. K. Mellinger, and C. W. Clark, "Marine mammal call discrimination using artificial neural networks," The Journal of the Acoustical Society ofAmerica, vol. 96, no. 3, pp. 1255-1262, 1994. [Online]. Available: https://doi.org/10.1121/1.410274 [ Links ]
[16] S. Salvador and P. Chan, "Toward accurate dynamic time warping in linear time and space," Intelligent Data Analysis, vol. 11, no. 5, pp. 561-580, 2007. [ Links ]
[17] J. C. Brown, A. Hodgins-Davis, and P. J. Miller, "Classification of vocalizations of killer whales using dynamic time warping," The Journal of the Acoustical Society of America, vol. 119, no. 3, pp. EL34-EL40, 2006. [ Links ]
[18] J. C. Brown and P. J. Miller, "Automatic classification of killer whale vocalizations using dynamic time warping," The Journal ofthe Acoustical Society of America, vol. 122, no. 2, pp. 1201-1207, 2007. [ Links ]
[19] M. Bahoura and Y. Simard, "Blue whale calls classification using short-time fourier and wavelet packet transforms and artificial neural network," Digital Signal Processing, vol. 20, no. 4, pp. 1256 - 1263, 2010. [Online]. Available: http://www.sciencedirect.com/science/article/pii/S1051200409002024 [ Links ]
[20] S. Mazhar, T. Ura, and R. Bahl, "Vocalization based individual classification of humpback whales using support vector machine," 11 2007, pp. 1 - 9.
[21] D. Jurafsky and J. Martin, Speech and Language Processing: An Introduction to Natural Language Processing, Computational Linguistics, and Speech Recognition, 02 2008, vol. 2.
[22] J. Brown and P. Smaragdis, "Hidden markov and gaussian mixture models for automatic call classification," The Journal of the Acoustical Society of America, vol. 125, pp. EL221-4, 07 2009. [ Links ]
[23] A. M. Usman, O. O. Ogundile, and D. J. J. Versfeld, "Review of automatic detection and classification techniques for cetacean vocalization," IEEE Access, vol. 8, pp. 105 181-105 206, 2020. [ Links ]
[24] R. Constantine, T. Iwata, S. L. Nieukirk, and G. S. Penry, "Future directions in research on Bryde's whales," Frontiers in Marine Science, vol. 5, p. 333, 2018. [ Links ]
[25] E. R. Patricia and A. W. Lynsey, "Genetic evidence reveals a unique lineage of Bryde's whales in the northern Gulf of Mexico," Endang Species Res, vol. 25, pp. 19-34, 2014. [ Links ]
[26] F. Kershaw, M. Leslie, T. Collins, R. Mansur, B. Smith, G. Minton, . Baldwin, R. LeDuc, R. Anderson, R. Brownell, and H. Rosenbaum, "Population differentiation of 2 forms of Bryde's Whales in the Indian and Pacific Oceans," Journal of Heredity, vol. 104, no. 6, pp. 755-764. [ Links ]
[27] J. Anderson, Anatomical and zoological researches: comprising an account of the zoological results of the two expeditions to western Yunnan in 1868 and 1875; and a monograph of the two cetacean genera, Platanista and Orcella. London,B. Quaritch„ 1878, vol. v.1 (1878) [Text]. [Online]. Available: https://www.biodiversitylibrary.org/item/106457
[28] S. M. Kerosky, A. Sirovic, L. K. Roche, S. Baumann-Pickering, S. M. Wiggins, and J. A. Hildebrand, "Bryde's whale seasonal range expansion and increasing presence in the Southern California Bight from 2000 to 2010," Deep Sea Research Part I: Oceanographic Research Papers, vol. 65, pp. 125 - 132, 2012. [Online]. Available: ttp://www.sciencedirect.com/science/article/pii/S0967063712000805 [ Links ]
[29] A. N. Rice, K. J. Palmer, J. T. Tielens, C. A. Muirhead, and C. W. lark, "Potential Bryde's whale (Balaenoptera edeni) calls recorded in the northern Gulf of Mexico," The Journal ofthe Acoustical Society of merica, vol. 135, no. 5, pp. 3066-3076, 2014. [Online]. Available: ttps://doi.org/10.1121/1.4870057 [ Links ]
[30] A. Sirovic, H. R. Bassett, S. C. Johnson, S. M. Wiggins, and J. A. Hildebrand, "Bryde's whale calls recorded in the Gulf of Mexico," Marine Mammal Science, vol. 30, no. 1, pp. 399-409, 2014. [Online]. Available: https://onlinelibrary.wiley.com/doi/abs/10.1111/mms.12036 [ Links ]
[31] L. Viloria-Gomora, E. Romero-Vivas, and J. Urban R., "Calls of bryde's whale (balaenoptera edeni) recorded in the gulf of california," The Journal ofthe Acoustical Society ofAmerica, vol. 138, no. 5, pp. 27222725, 2015. [Online]. Available: https://doi.org/10.1121/1.4932032 [ Links ]
[32] R. Putland, L. Ranjard, R. Constantine, and C. Radford, "A hidden markov model approach to indicate brydeäAZs whale acoustics," Ecological Indicators, vol. 84, pp. 479 - 487, 2018. [Online]. Available: http://www.sciencedirect.com/science/article/pii/S1470160X17305939 [ Links ]
[33] S. Buchan, R. Mahu, J. Wuth, N. Balcazar-Cabrera, L. GutiÄl'rrez, S. Neira, and N. Yoma, "An unsupervised hidden markov model-based system for the detection and classification of blue whale vocalizations off chile," Bioacoustics, pp. 1-28, 01 2019.
[34] S. L. DeRuiter, R. Langrock, T. Skirbutas, J. A. Goldbogen, . Calambokidis, A. S. Friedlaender, and B. L. Southall, "A multivariate ixed hidden markov model for blue whale behaviour and responses o sound exposure," Ann. Appl. Stat., vol. 11, no. 1, pp. 362-392, 03 2017. [Online]. Available: https://doi.org/10.1214/16-AOAS1008 [ Links ]
[35] N. Shaikh and R. Deshmukh, "Speech recognition system - a review," IOSR Journal ofComputer Engineering, vol. 18, pp. 01-09, 04 2016. [ Links ]
[36] K. Singh, "Speech recognition: A review of literature," 2016.
[37] E. Oleson, J. Barlow, J. Gordon, S. Rankin, and J. Hildebrand, "Low frequency calls of bryde's whales," Marine Mammal Science - MAR MAMMAL SCI, vol. 19, pp. 407-419, 04 2003. [ Links ]
[38] L. Figueiredo and S. Simao, "Bryde's whale (balaenoptera edeni) vocalizations from southeast brazil," Aquatic Mammals, vol. 40, pp. 225-231225, 09 2014. [ Links ]
[39] P. L. Edds, D. K. Odell, and B. R. Tershy, "Vocalizations of a captive juvenile and free ranging adult calf pairs of bryde's whales, balaenoptera edeni," 1993.
[40] "Dolphin action protection group: Policy on boat based Whale watching (BBWW)," Dapg.org.za, 2007. [Online]. Available: http://www.dapg.org.za/policies.htm
[41] M. Schalkwyk, "Department of Environment Affairs and Tourism branch Marine and Coastal Management: Policy on Boat-based Whale and Dolphin watching," Government Gazette, no. 31209, 07 2008.
[42] G. S. Penry, P. S. Hammond, V. G. Cockcroft, P. Best, M. Thornton, and J. Graves, "Phylogenetic relationships in southern African Bry-deâĂŹs whales inferred from mitochondrial DNA: further support for subspecies delineation between the two allopatric populations," IEEE Access, vol. 19, p. 1349âĂŞ 1365, 2018.
[43] L. Rabiner and B. Juang, "An introduction to hidden markov models," IEEEASSP Magazine, vol. 3, no. 1, pp. 4-16, Jan 1986. [ Links ]
[44] T. K. Moon, "The expectation-maximization algorithm," IEEE Signal Processing Magazine, vol. 13, no. 6, pp. 47-60, Nov 1996. [ Links ]
[45] F. Dellaert, "The expectation maximization algorithm," Georgia Institute of Technology, Tech. Rep., 2002.
[46] A. Viterbi, "Error bounds for convolutional codes and an asymptotically optimum decoding algorithm," IEEE Transactions on Information Theory, vol. 13, no. 2, pp. 260-269, April 1967. [ Links ]
[47] G. D. Forney, "The viterbi algorithm," Proceedings ofthe IEEE, vol. 61, no. 3, pp. 268-278, 1973. [ Links ]
[48] F. Provost and R. Kohavi, "Glossary of terms," Journal ofMachine Learning, vol. 30, no. 2-3, pp. 271-274, 1998. [ Links ]
[49] T. Zhang and C. . J. Kuo, "Audio content analysis for online audiovisual data segmentation and classification," IEEE Transactions on Speech and Audio Processing, vol. 9, no. 4, pp. 441-457, May 2001. [ Links ]
[50] D. Li, I. Sethi, N. Dimitrova, and T. McGee, "Classification of general audio data for content-based retrieval," Pattern Recognition Letters, vol. 22, pp. 533-544, 04 2001. [ Links ]
[51] O. O. Ogundile, A. M. Usman, and D. J. Versfeld, "An empirical mode decomposition based hidden markov model approach for detection of bryde's whale pulse calls," The Journal of the Acoustical Society of America, vol. 147, no. 2, pp. EL125-EL131, 2020. [ Links ]
[52] L. Shi, I. Ahmad, Y. He, and K. Chang, "Hidden markov model based drone sound recognition using mfcc technique in practical noisy environments," Journal ofCommunications and Networks, vol. 20, no. 5, pp. 509-518, Oct 2018. [ Links ]
[53] F. Zheng, G. Zhang, and Z. Song, "Comparison of different implementations of mfcc." J. Comput. Sci. Technol., vol. 16, pp. 582-589, 11 2001. [ Links ]
[54] C.-H. Min and A. Tewfik, "Automatic characterization and detection of behavioral patterns using linear predictive coding of accelerometer sensor data," Conference proceedings : ... Annual International Conference ofthe IEEE Engineering in Medicine and Biology Society. IEEE Engineering in Medicine and Biology Society. Conference, vol. 2010, pp. 220-3, 08 2010. [ Links ]

Oluwaseyi P. Babalola (Member, IEEE) received the BSc. degree in mathematics from the University of Ibadan, Nigeria, in 2009, the MSc. degree in electrical engineering from University of the Wit-watersrand, Johannesburg, South Africa, in 2017, and the PhD. degree in electronic engineering from Stellenbosch University, South Africa, in 2020. He is currently a Postdoctoral Research Fellow with the department of electrical, electronics, and computer science engineering, Cape Peninsula University of Technology, Bellville, South Africa. His research interests include advanced error-correcting coding, IoT, machine learning/artificial intelligence, digital signal processing techniques with applications to wireless communications, acoustic communications, and storage systems.

Ayinde M. Usman received his B.Eng degree in Electrical Engineering from the University of Ilorin, Kwara state, Nigeria in 2007, and his M.Eng degree in Electrical and Electronics Engineering from the University of Ilorin, Kwara State, Nigeria in 2014. He is currently a Ph.D. student in the Department of Electrical and Electronic Engineering, Stellenbosch University, Stellenbosch, South Africa. He lectures at the Department of Electrical and Electronics Engineering, University of Ilorin, Kwara State, Nigeria. He is also a registered Engineer by the council for the regulation of Engineering in Nigeria (COREN). He is a member of the Nigeria Society of Engineers (NSE) and Institute of Electrical and Electronics Engineers (IEEE). His research interests include machine learning, digital communication and signal processing and Internet of Things.

Olayinka O. Ogundile (Member, IEEE) received the B.Eng. degree in electrical engineering from the University of Ilorin, Kwara, Nigeria, in 2007, the M.Sc. degree in communication engineering from The University of Manchester, U.K., in 2010, and the Ph.D. degree from the University of the Witwa-tersrand, Johannesburg, South Africa, in 2016. He is currently a Lecturer with the department of computer science, Tai Solarin University of Education, Nigeria. He is also a Postdoctoral Research Fellow with the department of electrical and electronic engineering, Stellenbosch University, South Africa. His research interests include digital communication, digital transmission techniques, digital signal processing/machine learning, channel estimation, forward error correction, and wireless sensor networks.

Daniel J.J. Versfeld (Member, IEEE) received the BEng. degree in electronic engineering and the MEng. degree in electronic engineering from NorthWest University, South Africa, in 1999 and 2001, respectively, and the PhD. degree from the University of Johannesburg, South Africa, in 2011. He is currently a Professor with the department of electrical and electronic engineering, Stellenbosch University. His research interests include algebraic coding for digital communication and Signal Processing Algorithms.

