


Services on Demand
Article
 English (pdf)
 Article in xml format
 Article references
Indicators

Related links
-
 Cited by Google
 -
 Similars in Google
Share

 Permalink
SAIEE Africa Research Journal
On-line version ISSN 1991-1696
Print version ISSN 0038-2221
SAIEE ARJ vol.111 n.2 Observatory, Johannesburg Jun. 2020
ARTICLES
Economic impact of electricity supply interruptions in South Africa
Kingsley O. AkpejiI; Azeez O. OlasojiI; CT GauntII; David T. O. OyedokunIII; Kehinde O. AwodeleIII; Komla A. FollyIV
IDepartment of Electrical Engineering, University of Cape Town, Rondebosch 7701, South Africa
IIFellow, SAIEE; Department of Electrical Engineering, University of Cape Town, Rondebosch 7701, South Africa
IIIMember, IEEE; Department of Electrical Engineering, University of Cape Town, Rondebosch 7701, South Africa
IVSenior Member, IEEE; Department of Electrical Engineering, University of Cape Town, Rondebosch 7701, South Africa
ABSTRACT
In past studies on the costs of interruptions of electricity supply in South Africa, the concepts of sporadic and chronic interruptions were introduced. Cost was modelled using different parameters, and the measurement of customer interruption cost (CIC) was acquired through surveys. Rotational load shedding, as experienced during more than a decade in South Africa, shares many characteristics with chronic interruptions and large system collapse scenarios. Since CIC data are based on electricity customers' valuations of their impacts from electricity interruptions, and allow only for a bottom-up estimation of the economic cost of large electricity interruption events (without considering sectoral interdependencies), an alternative assessment of the cost using a suitable macroeconomic model that employs less subjective data allows for a validation of CIC-based results and a determination of a plausible range of estimates of the cost of large electricity interruptions. We test this proposition using a combination of a time-dependent probabilistic CIC model based on CIC survey data, and a dynamic inoperability input-output model (DIIM) that accounts for sectoral interdependencies, economic resilience and the temporal variation of electricity interruption impacts. The results lead to estimates of the costs of large interruptions of electricity supply in South Africa.
Index Terms: customer interruption cost, cost of unserved energy, customer survey, dynamic inoperability input-output model, rolling blackouts.
I. Introduction
ELECTRICITY supply reliability indices and customer interruption costs, as commonly used in power system planning and investment approval, are usually based on infrequent short duration interruptions. High impact, low frequency events like power system collapse affect large numbers of customers, often for extended periods. Internationally, there have been several studies of the economic impact that might arise from blackouts such as those initiated by severe solar storms [1], [2].
The advent of rotational load shedding, also called rolling blackouts, in South Africa (SA) in 2005, repeated in 2007/8, 2014/15 and 2018/19 has provided the incentive and opportunity to examine the costs of large disturbances. In the past, some authors [3]-[8] have assessed the costs to some of SA's electricity customer segments using customer surveys. These surveys typically assume chronic electricity interruption scenarios. Other authors have preferred the use of macroeconomic models for assessing the cost of unserved energy [9], [10] and the economy-wide cost of hypothetical sporadic nation-wide blackouts [11]. The relationship between the economic impact of large disturbances and the costs of electricity interruptions at the utility and customer level have not been investigated widely.
Since rotational load shedding as experienced during more than a decade in South Africa shares many characteristics with chronic electricity interruptions and large system collapse scenarios, we propose that a dual-level assessment of the economic cost of electricity interruptions using a robust bottom-up modelling approach based on customer interruption cost (CIC) survey data and a suitable macroeconomic model allows for leveraging the relative merits of each approach to derive plausible estimates of the cost. Accordingly, we describe a load survey in 2018 to highlight the significance of survey data in providing low-level qualitative and quantitative indications of the impacts of unreliability from the electricity customer's viewpoint. Also, we show that certain caveats must be borne in mind when analysing CIC estimates provided by survey respondents. Subsequently, parallel estimations of the economic cost of electricity interruptions in SA using a time-dependent probabilistic CIC model and a dynamic inoperability input-output model (DIIM) are discussed. Rigorous comparison of the results of each approach and those published in similar studies allowed for an identification of plausible ranges of the cost of large electricity interruptions in SA. Further, we show that many days of widespread rotational load shedding could have a cumulative effect like that of a large blackout.
The layout of the rest of the paper is as follows: section II is a comprehensive review of the literature on the cost of electricity interruptions; section III discusses the protocol of our 2018 customer level survey, some descriptive statistics on the survey data and a quantitative assessment of the CIC data from the survey; section IV presents a brief formulation of the input-output (IO) model, its variants for assessing the economy-wide cost of disasters or economic shocks, and the application of the dynamic input inoperability model (DIIM) for electricity interruption impact assessment; section V discusses the procedure and the results of the estimation of the cost of load shedding using survey data and an adapted DIIM (A-DIIM), and a comparison of the results of the estimated weekly economy-wide cost of load shedding using the A-DIIM and the most recent national cost of unserved energy published in [10]. Relevant conclusions are drawn in section VI.
II. RELEVANT LITERATURE
The electric power system may be classified into three hierarchical levels (HLs) for system appraisal or analysis [12]. HL I consists of only generating facilities. HL II refers to the bulk power system consisting of generation and transmission facilities. HL III connotes the complete system including generation, transmission and distribution facilities. Various risks may affect one or a combination of the power system's facilities resulting in sustained electricity supply interruptions. These interruptions may be chronic or sporadic [4]. Sporadic interruptions are often caused by severe weather conditions and other high impact low frequency (HILF) risks like geomagnetic storms, cyber-attacks, pandemics, and massive industrial strike actions. These are initiated mainly at HL II and III and are prevalent in countries in the 'global north' [13], [14]. Chronic interruptions occur more frequently than sporadic ones, resulting in higher system average interruption duration index (SAIDI) and system average interruption frequency index (SAIFI). Chronic interruptions are prevalent in developing countries with less robust power systems and are mostly due to load shedding caused by generation inadequacy (HL I), and other technical and maintenance problems at HL II and HL III. The costs of sustained electricity interruptions have been assessed at the customer and macroeconomic levels using different approaches.
A. Electricity interruption cost assessment at customer level.
Customer surveys became the predominant approach for assessing the cost of electricity interruptions to electricity customers after the success of Canadian seminal CIC surveys [15]-[17]. In CIC surveys, the impacts of electricity interruption are monetized by:
• Direct Costing. Respondents are given worksheets to estimate the costs of impacts due to electricity interruptions in actual or hypothetical scenarios [4], [6], [7], [18], [19]. The validity and accuracy of respondents' CIC estimates are influenced by the time since actual interruptions or the similarity of hypothetical interruptions with actual ones that respondents might recall from the past. Generally, this valuation approach is applied to commercial and industrial customers whose economic activities are linked with financial returns.
• Contingent valuation. In this case, respondents are asked about their willingness to pay (WTP) to avoid an electricity interruption or their willingness to accept (WTA) a certain amount of money as compensation for electricity interruption impacts [3], [4], [8], [20]. Alternatively, respondents may be presented with a set of electricity interruption options, each accompanied with a rate increase or decrease.
CIC estimates for different electricity customer segments are typically expressed as a function of interruption duration and applied for reliability planning [21]-[24] and regulation [25], [26]. However, these CIC estimates are subjective as they are based on electricity customers' perception of their cost in electricity interruption scenarios. Since conciseness is required for effective customer surveys, only a limited number of electricity interruption scenarios can be studied. Also, most CIC studies assume infrequent stochastic interruptions. The impacts of chronic interruptions prevalent in Sub-Saharan Africa (SSA) can be ascertained more accurately by extending typical surveys to include questions on backup power systems [6], [7], [18], [27]-[29]. This reveals the actual market behaviour of electricity customers to electricity interruptions. Other authors [1] have resorted to an assessment of insurance claims due to damages incurred from electricity interruptions as an alternative indicator of the cost of these interruptions to electricity customers.
B. Electricity interruption cost assessment at macroeconomic level.
Some Canadian studies [30], [31] proposed the sector customer damage function (SCDF) and composite customer damage functions (CCDF) to describe electricity interruption cost at the sectoral and bulk power system levels respectively. However, SCDF and CCDF are derived using CIC data from customer surveys.
Seeking a more objective, reliable, repeatable and low-cost approach to assessing electricity interruption cost at sectoral, regional, and national levels, many recent studies have applied the macroeconomic production function (MPF) approach [32]- [38]. Value of lost load (VoLL), cost of unserved energy (Co UE), and cost of energy not supplied (CENS) are the typical descriptors of electricity interruption cost in these studies. Since data on sectoral GDP/GVA and electricity use are usually publicly available, a sector's CoUE/VoLL/CENS is derived as a ratio of its gross domestic product (GDP) or gross value added (GVA) to its electricity consumption (kWh) or peak or average load (kW) for a given period (usually a year). The main drawback of this simple approach is that key customer and interruption parameters that influence electricity interruption cost are often neglected. Also, sectoral interdependencies are usually neglected.
To account for sectoral interdependencies and the ripple effects of localized or wide-area sporadic electricity interruption on the value chain of a modern economy, economy-wide simulation models can be used [39]. These models use flow measures (i.e. the output of stock or services over time) to assess electricity interruption cost. This is advantageous because flow measures are readily linked to higher order effects and give insights on the short-run impacts of large blackouts. Economy-wide simulation models applied for electricity interruption cost assessment include the econometric model [40], [41], input-output (IO) model [2], [9], [42], [43] and computable general equilibrium (CGE) model [40], [44].
The econometric model or long run model, is a model with statistically estimated simultaneous equations that represent the aggregated workings of an economy [39]. Econometric model analyses are typically concerned with the effects of disasters on economic growth rather than overall economic output. The model's inability to distinguish between higher order effects and direct effects reduces its application in electricity interruption cost analysis.
The IO model is a widely utilized tool for modeling inter-sectoral linkages and the cascading effects of disasters. The IO tables used in IO analysis provide comprehensive detail on the inter-sectoral trading relationships between sectors of an economy. A significant benefit of the IO model is its ability to capture indirect or higher-order effects that are not easily captured using other models. However, there is an assumption of fixed coefficients to determine input-output relationships between industries. This notion creates a set of weaknesses, rigidity, and linearity with respect to the application of the IO model for electricity interruption cost assessment [45], [46].
The computable General Equilibrium (CGE) model is an advanced extension of the IO model. It presents a complete view of an economy, considering market prices and exogenous interventions following a disaster, and how the economy may respond to changes in demands and supply. The CGE model incorporates input/import substitutions and has finite supply constraints. However, the complexity of the model's formulation and the extensive data it requires pose a challenge for electricity interruption cost analysis especially for regions where such data are not available.
The economy-wide simulation models discussed above do not normally include temporal parameters, they need to be modified to allow for a more refined analysis that considers the influence of temporal parameters on the economic cost of electricity interruptions.
III. CUSTOMER LEVEL SURVEY
Past surveys conducted in SA [4], [5], [7] and other SSA countries [27], [47] provided methodical insights for the survey in this study. The survey was administered to commercial and manufacturing businesses in the City of Cape Town by face-to-face interviews, telephone interviews, web survey, and survey form drop off and collection between August - mid-October 2018. The survey form included questions on a business' experience with electricity interruptions, backup/parallel electricity supply, electricity interruption cost estimation, and some demographics. Out of 475 businesses contacted for participation in the study, 227 responses (partial and complete) were retrieved. 54% of these contained usable data. Face-to-face interviews accounted for about 87% of retrieved responses. In subsequent discussions, a respondent implies each business unit represented in the useful sample data.
A. Electricity supply interruption frequency and satisfaction level with reliability
The average annual number of electricity interruptions as perceived by respondents was three interruptions per year in the 2 years preceding the survey (i.e. 2016 and 2017). Accordingly, about 88% of respondents were either very satisfied or satisfied with their electricity supply reliability. In [6], after severe interruptions in 2008, over 45% of businesses surveyed in Cape Town in 2009 were either dissatisfied or very dissatisfied with experiencing more than five interruptions per year, on average. Thus, customer satisfaction level with electricity supply reliability decreases with increasing frequency of electricity interruptions.
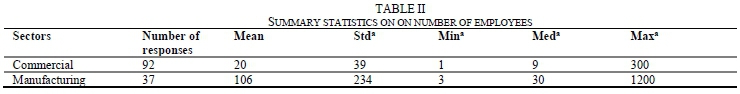
B. Business size parameters and dependence on electricity The business size parameters investigated in the survey were electrical size and number of employees, shown in Table I and II respectively. Most respondents could only report their electrical size in monetary value (Rands), not in kW or kWh. The medians of the average monthly electricity bill (Table I) and number of employees (Table II) indicate that most of the businesses in the sample were small - medium scale, and that the manufacturing sector has a higher electrical and labour size than the commercial sector. In both sectors, on average, over 90% of business activities depended on electricity, as illustrated in Fig. 1. The need for reliable supply is very high.

C. Backup/parallel electricity supply
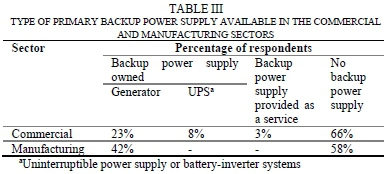
Most respondents indicated that they do not own a backup/parallel electricity supply, nor have it provided as a service (Table III). Backup electricity supply ownership is higher in the manufacturing sector than the commercial sector. This could be due to the sensitivity of the processes of the manufacturing businesses; about 24% of the surveyed manufacturing businesses ran continuous processes.
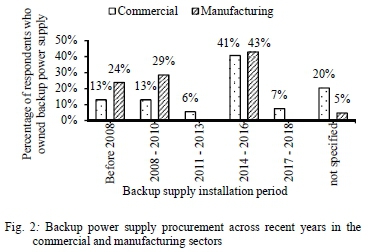
The cumulative percentage of respondents who indicated ownership of backup power supply rose from 13% and 24% before 2008 in the commercial and manufacturing sectors respectively to 72% and 95% between 2014 - 2016 (Fig. 2). Dzobo [6], also observed increased purchase and installation of backup/parallel electricity supply by businesses in Cape Town between 2007 - 2009 i.e. during and immediately after periods of load shedding events. The trends in both studies indicate that: following the improvement in electricity supply after the 2008 load shedding events in SA, the rate of backup power supply procurement among respondents in the commercial and manufacturing sectors dropped significantly but increased again during the 2014/2015 load shedding events. Thus, the experience or expectations of chronic electricity interruption encourages procurement of backup power supply, especially diesel/petrol generators.
However, a seemingly counterintuitive but interesting and plausible observation in this study is that: chronic interruption might have some non-negative outcomes. The increase in purchase and installation of backup power supply indicates increased economic activity for the backup power supply industry, which might translate to some positive outcomes to other associated industries in the economic chain (e.g. the petroleum products industry). Also, it is plausible that respondents who owned a backup generator during the load shedding period gained competitive advantage by satisfying more customers than their competitors who didn't own one.
D. CIC assessment for businesses without backup power supply
The potential worst-case CIC of businesses can be ascertained by considering electricity interruption scenarios where there is no backup power supply [5], which characterizes most respondents in this study (Table III). Their CIC was estimated using a direct costing approach. Generally, CIC is affected by the interruption duration, economic sector and size of the business. It is useful to normalize CIC estimates based on an electrical size parameter, such as monthly energy consumption or maximum demand, to allow for easy application in power system management [48]. Since most respondents in this survey could report their electrical size only in terms of their average monthly electricity bill, it was used as the normalization parameter. The relationship between average monthly electricity bill and CIC for each duration was tested by linear regression analysis using (1).

Where CICnbd is the customer interruption cost estimates for businesses with no backup power supply for an interruption of duration d occurring in the reference interruption context - the busiest operating time and season of a business; E is average monthly electricity bill; b0and b1are intercept and slope parameters respectively for the fitted regression line.
For each electricity interruption duration, the CIC and average monthly electricity bill data pair in each sector contained significant number of zero, near-zero, and extreme CIC values, as observed also in [5], [19], [49]. To assess the effect of these outliers on the linear regression results, two types of linear fits were considered i.e. a regular linear fit and a bisquare fit. The bisquare linear fitting technique in MATLAB's 2017 Curve Fitting Toolbox [50] was used in this study. Compared with simple linear regression, it reduces the weight of each data point according to the distance from the fitted line.
The coefficient of determination, R2, of the bisquare fit was higher than that of the regular fit across the different electricity interruption scenarios in each sector (Table A-1 in Appendix A). With the regular linear fit, average monthly electricity bill could explain less than 50% of the variation of CIC for most of the electricity interruption scenarios in each sector. With the bisquare fit, it could explain 54% to 97% of the variation of CIC because the bisquare fit reduces the effects of outliers. The approximately linear relationship between CIC and the average monthly electricity bill with the bisquare fit corroborates observations in [6] and improves previous approaches based on a simple ratio of CIC divided by the business size [51], [52].
The CIC estimated by each respondent was normalized (by the business size) according to the bisquare linear relation. The normalized CIC (CIC*) is a unitless multiplier of the average monthly electricity bill of the customer and the values for all customers are distributed about a mean value for each sector and interruption duration. The statistics of the distribution of CIC* for customers without backup supply are shown in Table IV. In deriving these statistics, values greater than three standard deviations (3 c) from the mean were considered as outliers and excluded. The shape parameters (a, ß) of the beta probability distribution function (pdf) of the CIC* data reflect the high skewness of the data. Past research [23], [24], [53]-[55] has shown the use of the beta pdf for characterizing CIC and reliability indices data since it provides estimates from the distribution based on a defined confidence level, as applied in Section V-A.
The CIC data for the 8-hour electricity interruption scenario in the 'hospitality' and 'other commercial services' sectors were insufficient for meaningful statistical analyses, and they were not included in Table IV. The variation of the interruption cost according to the duration is depicted in a customer damage function (CDF). The CDFs for the trade and manufacturing sectors were derived as interpolants between each sector's mean CIC* (with and without outliers) for each interruption duration (Fig. 3). In both sectors, CIC* increases with electricity interruption duration, albeit at different rates for the two sectors.
The CIC* for the trade sector is generally higher than that of the manufacturing sector, but this does not directly imply that the trade sector respondents have higher CIC. This observation could be due to the greater electrical size of the manufacturing sector respondents i.e. a manufacturing sector respondent with similar CIC as a trade sector respondent, but higher average monthly electricity bill will have lower CIC*. Furthermore, it is plausible that manufacturing sector respondents were more conservative when estimating their CIC. Trade sector respondents mostly estimated their CIC in terms of 'volumes of sales' they would have made in the presented electricity interruption context (i.e. busiest time-of-day, day-of-week, and season of the year). It is possible that they were quite optimistic about their potential sales in such a period, for example around midday on a 'Black Friday'.
E. Case studies on the cost of using backup generator
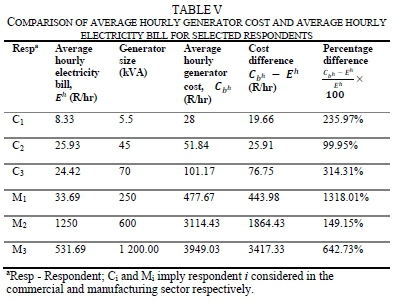
The cost of using a backup generator to mitigate the impacts of electricity interruption includes its purchase and installation cost depreciated over the duration of use, its maintenance cost, and running cost for the duration of use. Case studies assessed the difference in the cost of using a backup generator to provide full electricity interruption mitigation and the corresponding cost of the electric utility's supply. The respondents considered in these case studies reported that their backup generators powered all their facility and reported usable data on their backup generators.
The results of the case studies indicate that local businesses (especially those of large electrical size) experience significant increase in operating cost if they were to use backup generators providing full electricity interruption impact mitigation, The average hourly cost of using a backup generator was 100% to 300% higher than the average hourly electricity bill for the respondents in the commercial sector; and 149% - 1320% higher for the manufacturing sector respondents (Table V). The hourly cost difference observed for each business is an unbiased indicator of its willingness to pay to avoid electricity interruptions.
F. Summary
Generally, from the results of a multiple regression analysis that included all usable CIC datasets for businesses with and without backup power supply, it was observed that average monthly electricity bill, electricity interruption duration, backup power supply ownership and the percentage of a business facility powered by its power supply are statistically significant predictors of its CIC (or unmitigated loss) at the 5% significance level (Appendix B). The model coefficients for average monthly electricity bill and electricity interruption duration were positive, but negative for the percentage of business facility powered by backup power supply. Thus, for the businesses in this study, CIC tends to increase as average monthly electricity bill and electricity interruption duration increase and decrease as the coverage of business facility by backup power supply increases.
IV. ECONOMY-WIDE COST ASSESSMENT USING INPUT-OUTPUT (IO) MODEL
A. The Leontief IO model formulation
The general form of the Leontief IO model [56] is shown by

Where xiis the total output of sector i, A refers to the technical coefficient matrix with technical coefficient aiji.e. the ratio of the input requirement of sector j from sector i (xij) to the total output of sector j i.e. Xj, and fiis the amount of sector t's output sold to final demand. In (2), the economy is assumed to be static, in competitive equilibrium, and has constant production coefficients for a fixed unit of time, usually a year. Miller and Blair [56] discuss extensively the IO model and its variants.
B. Inoperability IO model (IIM)
The IIM is an extended form of the IO model. It improves the modelling of the extent to which extreme conditions make economic sectors inoperable [57]. Inoperability can be caused by internal or external perturbations, which have a negative effect on sectors' intended output. The IIM assesses sectoral inoperability through matrix manipulations. An inoperability index is derived as a measure of the level of an economic system's dysfunction. In the case of electricity interruptions, it complements the economic loss obtained from the traditional IO model. The basic formulation of the IIM as shown in (3) has been discussed extensively [58], [59].

Where: q is the inoperability vector, which is a dimensionless quantity with values ranging from 0 (i.e. normal state of system) to 1 ( i.e. system collapse) indicating varying degrees of system failure; A* is the interdependency matrix (orthogonalized technical coefficient matrix) which states how much additional inoperability is contributed by a column sector to the row sector, thus indicating the varying degree of interconnectedness between sectors; and c* is the demand side perturbation vector expressed in terms of normalized degraded final demand, i.e. planned final demand minus actual final demand relative to the planned production level.
C. Dynamic Inoperability Input-Output Model (DIIM)
The DIIM is an extension of the IIM. It allows for modelling the dynamic recovery, behaviour and interactions caused by a perturbation on economic sectors [60], [61]. The DIIM takes into consideration the resilience of sectors to model their recovery over time. The resilience coefficient reflects the output response of each individual sector to an imbalance of supply and demand. A general form is shown in (4).

The term K is the industry resilience coefficient matrix. It refers to the ability of a sector to recover to a nominal level of inoperability. Eq. (4) indicates that the inoperability in time t is equivalent to the inoperability in the previous period plus a partial adjustment of inoperability due to resilience K. It is assumed that all off-diagonal entries of matrix K are zero, depicting that the resilience of each sector comes from the inherent characteristic of the sector itself. Eq. (5) shows the computation of the individual elements kiof the resilience matrix K based on the diagonal elements of the interdependence? matrix A* (i.e. a*ii), and the time Tiit takes each sector to return to a predefined level of inoperability (qi(Ti)) from an initial level of inoperability (qi(0)).

The numerator of (5) describes the recovery rate of each sector and the denominator indicates the reliance of the sector on itself. Using the DIIM, the continuous form of the cumulative economic loss for each sector i by time t is given by (6).
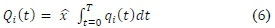
Where: x is the planned output of sector i (Rands/time unit); and qi(t) is the inoperability of sector i at time t.
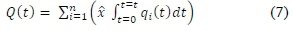
The total economic loss for all sectors of the economy by time t is shown in (7).
D. Electricity interruption impact assessment using the DIIM
The data source for the assessment was South Africa's 2014 IO table [62]. It was the latest publicly available IO table published by StatsSA at the time of this study. The table consists of fifty sectors at the 2-digit level of SA's standard industrial classification code (SIC). In the IO table, it was observed that the electricity sector was lumped with the gas and water sectors, thus it was required that these interactions be separated, for which the 2013 summary statistics on the lumped electricity, water and gas sector [63] were used. The average percentage contributions to sales and expenditure of the lumped sector (83.7% for electricity sector and 16.3% for gas and water sector combined) were used to weight the rows and columns of the lumped sectors to derive a revised a 50-sector IO table with the electricity sector separated from the gas and water sectors.
1) Scenario formulation
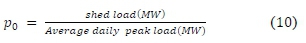
The DIIM requires the initial inoperability level vector for all the sectors present in the economy of interest, the desired recovery period for the analysis (7) and a predefined final inoperability level for each sector (qi(T)). For consistency, (qi(T)) can be the same for all sectors. To determine the initial inoperability vector for each sector (qi(0)), we use (8) as defined in [64].
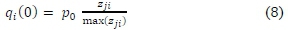
Where qi (0) is the initial perturbation to the ithsector due to a single perturbation p0to the electricity sector (taken as sector j); and Zjiis the transaction between sector i and the electricity sector, i.e. the amount of electricity (in Rands) sold to sector i. The denominator is the amount of electricity purchased by the maximum consuming sector of electricity (i.e. the metal ores mining sector). For illustration, p0is arbitrarily set at 5%, qi(T) at 0.1% to ensure a positive kifor each sector (see (5)) and T at 12 hours, as most single electricity interruption event do not exceed 12-hours [65]. The bi-directional relationship in the IO model implies that a sector becomes somewhat inoperable if there is an interruption of electricity supply and electricity is a major component of its production [11]. In the DIIM, if a given sector is dependent on the perturbed sector, it will follow the same recovery path as that of the initially perturbed sector.
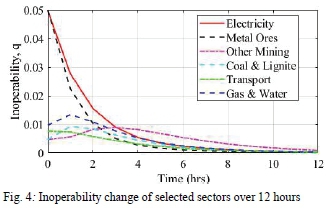
2) Some illustrative results
The inoperability experienced due to a 5% perturbation to the electricity sector is shown in Fig. 4 for select sectors. The effects of electricity interruption are more apparent in sectors with a high level of dependence on the electricity sector. After 12 hours, the inoperability level of all sectors considered was below 0.5%. Metal ores mining sector is most affected because it has the highest dependence on the electricity sector. Gas & Water sectors are also significantly affected because of the dependence of their production processes on electricity.
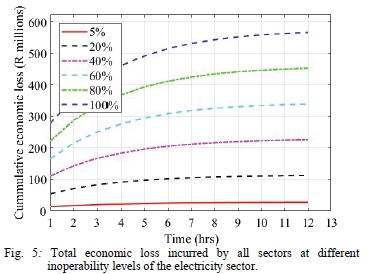
The corresponding total economic losses incurred over a 12hour period is obtained for different levels of inoperability of the electricity sector i.e. 5%, 20%, 40%, 60%, 80% and 100%, illustrated in Fig. 5. In each case, the profile of economic loss stems from the assumed exponential recovery trajectory of the electricity sector. The result in Fig. 5 conforms with the inherent characteristics of the Leontief model, i.e. higher levels of inoperability of the electricity sector result in decrease in production of dependent sectors and higher economic losses.
V. ESTIMATION OF THE COST OF LOAD SHEDDING
Prior to South Africa's democratic dispensation in 1994, a significant portion of residential customers were unelectrified. The introduction of the national electrification programme led to a rapid increase in new connections. However, insufficient attention was given to generation and transmission capacity expansion which require long lead times [4]. This led to supply constraints and the introduction of load shedding in 2005 [66], [67]. Since then, the problems have not been resolved fully, leading to recurrence of load shedding around periods of annual peak in 2007/08, 2014/15 and 2018/19.
Generally, the national electric utility, Eskom, and municipal electric utilities implement load shedding in stages depending on the prevailing network contingency [68]. Up to 1000 MW of load is shed from the network at each stage i.e. 1000 MW, 2000 MW, 3000 MW and 4000 MW at stage 1, 2, 3 and 4 respectively. The duration of interruption at each stage can be 2.5-hours or 4.5-hours at a time. The frequency of load shedding groups of customers increases for higher stages of load shedding, according to the shortage of generation adequacy and to avoid a system collapse.
These rotational load shedding events have similar characteristics as chronic interruptions whose economic impacts are typically assessed using a CIC model based on customer survey data [3]-[8], and large blackouts whose economic impacts are better assessed using a macroeconomic model [2], [9], [11], [69]. Accordingly, we assess the potential cost of load shedding using both customer-level survey CIC data and an adapted DIIM (A-DIIM). The CIC data are applied in a time-dependent probabilistic CIC model and the results are scaled up to macroeconomic sectoral levels to allow for comparison with the A-DIIM estimations. The assumptions and estimation procedure in each case differ according to the respective models used.
A. Load shedding cost estimation using survey results
The weekly costs incurred by the trade and manufacturing sectors due to stages 1 - 4 load shedding were estimated using the following assumptions:
1. During a stage 1 load shedding, an individual customer will experience load shedding three (3) times for 2 hours each over a 4-day period [68]. For stages 2, 3, and 4, the frequency increases to six, nine, and twelve times respectively.
2. From 1, in a 168-hour week, electricity supply to a customer in each sector will be interrupted for approximately 6%, 13%, 19%, and 25% of the time for stage 1, 2, 3, and 4 load shedding respectively. Thus, it is assumed that 6%, 13%, 19%, and 25% of the electricity customers in each sector experience electricity interruption during each stage 1, 2, 3, and 4 load shedding event respectively.
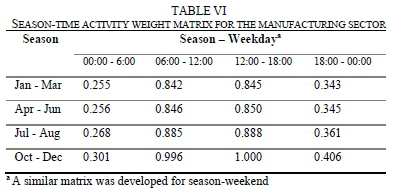
3. There are twenty-four possible hours of load shedding in a day. Thus, in each time interval of a given row of the season-time activity weight matrix for a sector (e.g. Table VI for the manufacturing sector), there are three load shedding events. The season-time activity weight matrices for the sectors were derived from the survey data on business' activity levels.
4. The reference season is January - March. Past load shedding events have occurred in this period [70].
5. Businesses do not use backup power supply.
The normalized 2-hour CIC data for the trade and manufacturing sectors were applied in a time-dependent probabilistic CIC model (9) for the estimation.
Where: TlCidis the total interruption cost of sector i, due to electricity interruption events of duration d, occurring over a given period; in this case, a week; Ned is the number of electricity interruption events of duration d in the considered period; CIC*(i)nb (Tref, d) is the probabilistic normalized CIC estimate for an electricity interruption event of duration d in a reference season - time-of-day interval Tref; CIC*(i)nb (Tref, d) is obtained using the parameters of the beta distribution of the normalized CIC data for electricity customers without backup power supply; Eiis average monthly electricity bill (in Rands); Pi(t) is the proportion of electricity customers affected by an electricity interruption event in season - time-of-day interval t; and Wi(T) is the season - time-of-day activity weight corresponding to t.
For comparison purposes, estimations were done using results in studies that are similar to ours both in sector description and the form of published CIC data. The estimation for the trade sector was done using both the normalized 2-hour CIC data from our 2018 survey and that reported by Dzobo [5] from a 2009 CIC survey of commercial and industrial electricity customers in Cape Town. Normalized 2-hour CIC data for the manufacturing sector was not specifically reported in the 2009 study.
The estimation results for the trade and manufacturing sectors are shown in Tables VII and VIII respectively. The estimates obtained for the trade sector using the 2018 CIC data were significantly higher than those obtained using the CIC data in 2009 (Table VII). To confirm whether the trade sector respondents in the 2018 survey largely overestimated their CICs, a further comparison was made with Goldberg's estimate of the cost of load shedding to SA's retail trade sector in 2015 [7].
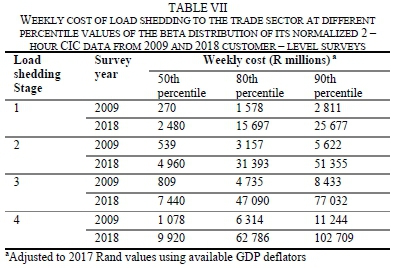

Goldberg used average CIC estimates from a 2015 survey conducted for the retail trade sector in Pretoria and an extrapolation procedure quite different from the one in this study and [5]. The cost of 99 days of load shedding between January - June 2015 was estimated to be R13.72 billion. In this period, the implemented load shedding stages were mainly stages 1, 2 and 3, but the estimate was not differentiated across load shedding stages. Adjusting Goldberg's 2015 estimate to 2017 values using available GDP deflators results in an average of R0.57 billion per week over the 6-month period or R1 billion per week of continuous load shedding. The latter figure lies in the range of the 50th percentile weekly cost of stages 1 - 4 load shedding estimated using the trade sector's 2009 CIC data [5], but it is smaller than the estimates for all the load shedding stages using the trade sector's 2018 CIC data. The corroborations observed in the load shedding cost estimates for the trade sector using the CIC data from surveys in 2009 and in 2015 might be because these studies were conducted near periods of chronic load shedding, thus respondents would have been more likely to accurately recall the impacts of load shedding on their business activities. The 2018 survey was conducted during a period of high electricity supply reliability; the average number of electricity interruptions as perceived by respondents in the survey area (Cape Town) between 2016 - 2018 was three interruptions per year (section III-A). Thus, it is plausible that when CIC surveys are not conducted near nor during periods of electricity interruptions, respondents might not give reliable CIC estimates.
B. Load shedding cost estimation using DIIM
The fundamental DIIM discussed in section IV does not fully capture some aspects of rotational load shedding as implemented in SA. For a sector, it takes only a single input inoperability vector - which corresponds to the sectors inoperability profile for a single event. Since the DIIM assumes a monotonically decreasing function to represent the recovery of directly affected sectors, the rollover effects of rotational load shedding events are not fully accounted for. The implementation of load shedding in continuous successions over several days results in an accumulation of impacts, hence sectoral recovery will take longer than is required for a single event. To adapt the DIIM to the context of load shedding in SA, we leverage on the methodology in [71] and make the following assumptions and formulations:
1. The shock to the electricity sector that results in load shedding and cascaded effects throughout the economy can be described as:
2. Each load shedding event creates its own unique inoperability profile in each sector. Thus, the inoperability of a sector at a given time t should be derived from the combination of the direct inoperability due to the load shedding event at t, and the residual inoperabilities from period 1, 2, t-I Accordingly, we adopt the following notations and relations for the ithsector:
qic (t): cumulative total inoperability at t.
qdi(t): direct inoperability from event occurring at t.
qri(t): combined residual inoperabilities from events preceding t, derived using (11).

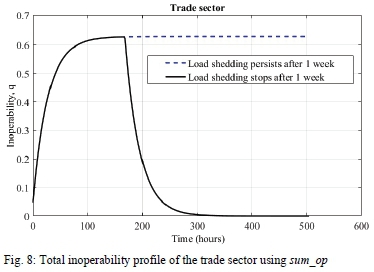
In (11), qi1 (t) implies the residual inoperability at period t from the event at period 1, and qti-1(t) implies the residual inoperability at period t from the event at period t-1. Op is a mathematical operator chosen to combine the residual inoperabilities. Two operators were considered i.e. max_op which takes the maximum of the set of residual inoperabilities and sum_op - which takes the sum of residual inoperabilities.
The cumulative total inoperability at t is derived using (12).

3. The simulation time step is bihourly to account for the fact that each load shedding event lasts about 2 hours, and for consistency with the use of 2-hour CIC data in section V-A. Thus, there are 12-time steps per day corresponding to twelve events per day.
4. The period of load shedding implementation is one week. However, a simulation period of three weeks was considered (i.e. 504 hours) to observe the decline in sectoral inoperabilities after load shedding ceases.
For the calculation of sectoral resilience coefficients (5) and vectors of inoperability profiles at the start of the simulation, a desired final inoperability level of 0.01% was used. This pre-set value of final inoperability ensures that the resilience coefficient computed for all sectors using (5) are positive.
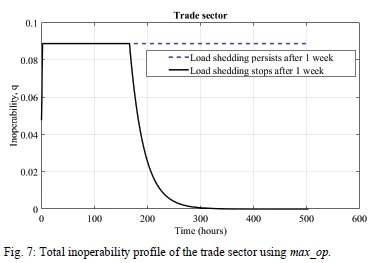
For a fixed load shedding stage throughout the week of load shedding, the direct inoperability profiles created in a sector are similar as depicted for the trade sector in Fig. 6. The effect of combining residual sectoral inoperabilities with the maxop is such that, after the first load shedding event, a sector remains inoperable at the same level throughout the period of load shedding (Fig. 7). When residual sectoral inoperabilities are combined with the sum_op, sectoral inoperability increases steadily and tends to plateau as load shedding becomes protracted (Fig. 8).

Using the adapted DIIM's (A-DIIM) max_op and sum_op, the weekly cost of stages 1 - 4 load shedding were computed (using (6)) for SA's fifty sectors at the 2-digit level of its SIC, however we present only the results for the trade and manufacturing sectors at the 1 -digit level of SA's SIC to allow for comparison with survey-based estimations in section V-A. Generally, the results obtained using the max_op were significantly less than those obtained using the sum_op (Table IX). This is in line with observations in Fig. 7 and 8.

C. Comparison of survey and A-DIIM results
A comparison of the survey and A-DIIM estimates of the weekly cost of each stage of load shedding to the trade sector (i.e. Table VII and Table IX respectively) shows that the 50th percentile estimate derived using the 2009 CIC survey data and the estimate derived using the A-DIIM sum_op establish a conservative lower bound (CLB) and a conservative upper bound (CUB) of the cost respectively. While the 50th percentile estimates derived using the 2018 CIC data falls within this CUB and CLB, the corresponding 80th and 90th percentile estimates are significantly higher than the defined CUB and are unlikely when compared with the trade sector's 2017 annual GDP of approximately R625 147 million.
A similar comparison of the survey and A-DIIM estimates of the weekly cost of load shedding to the manufacturing sector (i.e. Table VIII and Table IX respectively) shows that the CLB and CUB estimates of its weekly cost of load shedding are defined by the estimates derived using the A-DIIM's max_op and sum_op respectively. As observed for the trade sector, the 50th percentile estimates derived using the 2018 CIC data falls within this CUB and CLB. The corresponding 80th and 90th percentile estimates are unlikely, especially when compared with the manufacturing sector's 2017 annual GDP of approximately R559 000 million.
D. Total economy-wide cost of load shedding
The total weekly economy-wide cost of load shedding estimated using the A-DIIM were also compared with that using a national CoUE of R84.16/kWh, which is currently approved by the National Energy Regulator of South Africa (NERSA) [10]. Across all load shedding stages, the average of the percentage difference between the estimates derived using the A-DIIM sumop and NERSA's CoUE (Table X) is approximately 12%. This indicates significant corroboration of the findings in these studies.

Using NERSA's CoUE, the economy-wide wide cost of a full day blackout is approximately R54 536 million. This implies that 27 days of continuous stage 1 load shedding has a similar economic cost as a day-long nation-wide blackout. Similarly, fourteen (14), nine (9) and seven (7) days of stage 2, 3, and 4 load shedding respectively, have a similar economic cost as a day-long nation-wide blackout.
VI. CONCLUSIONS
Customer-level surveys provide qualitative and quantitative indications of the impact of electricity interruptions to electricity customers. For instance, information on the proliferation and cost of using backup generators to mitigate the impact of chronic electricity interruptions can be readily obtained from such surveys. However, CIC estimations by survey respondents might be biased or affected by measurement errors, especially when surveys are not conducted during or near period of electricity interruptions. Event chasing surveys should be adopted if it is needful to estimate electricity interruption cost using surveys. Further, conducting representative customer surveys by electric utilities across the country or in carefully selected provinces will allow for the development of a meta-database that will aid accurate evaluation of risk-based reliability worth indices expressed in Rands@Risk. Such indices could enhance value-based decision-making by electric utilities and regulators. Collaboration between electric utilities and academic researchers involved in researching the cost of electricity interruptions will improve the data collection process, as electric utilities can share ancillary customer data. For instance, using a utility's comprehensive data base as a sampling frame would allow a more representative, stratified random sampling of the customers. The ancillary data from an electric utility could also reduce the length of the survey questionnaire as questions pertaining to respondents' electrical size and economic activity may be omitted. For such region-wide or nation-wide customer surveys, it is necessary to maintain consistency in the survey design and execution protocol.
An analyst's or decision maker's confidence level (risk aversion level) can be reflected in a CIC-based estimation by the choice of percentile CIC values used for the estimation. The results in this study indicate that the choice of percentile CIC* values used in the time-dependent probabilistic CIC model and the operator used for combining residual inoperabilities in the A-DIIM influences the magnitude of the difference in the cost estimates obtained using each model. Conservative upper and lower bounds of the cost of electricity interruptions to economic sectors were established through a comparison of the estimates obtained using different percentile CIC* values and those obtained using the max_op and sum_op in the A-DIIM. Also, the comparison of the results in this study with those in other studies lends credibility to the findings presented herein. Furthermore, the electricity interruption cost estimation principles demonstrated here can be applied in countries other than SA.
Reliable estimates of the cost of electricity interruptions should aid power system reliability planning and operation, especially in very centralized power systems like SA's. However, to make optimal investments, the cost of investments to minimize electricity interruptions must be carefully weighed against the cost of the interruptions. Using infrequent extreme interruption scenarios as the basis for system planning and operation, and regulation might lead to ineffective decisions as discussed in [72]. In the long run, chronic electricity interruptions are costlier than sporadic ones due to the accumulation of residual sectoral inoperabilities.
Acknowledgement
The authors would like to thank the 2018 survey respondents and StatsSA for the publicly available macroeconomic data.
References
[1] C. J. Schrijver, R. Dobbbins, W. Murtagh, and S. M. Petrinec, "Assessing the impact of space weather on the electric power grid based on insurance claims for industrial electrical equipment.," Sp. Weather, vol. 12, no. 7, pp. 47-498, 2014. [ Links ]
[2] E. J. Oughton, A. Skelton, R. B. Horne, A. W. P. Thomson, and C. T. Gaunt, "Quantifying the daily economic impact of extreme space weather due to failure in electricity transmission infrastructure.," Sp. Weather, vol. 15, no. 1, pp. 65-83, 2017. [ Links ]
[3] R. Herman, C. T. Gaunt, U. Minaar, and R. Koch, "Direct and indirect estimation of domestic customer interruption costs: considerations and preliminary studies," presented at the Cigré SC-C6 Colloquium on electricity for rural socio-economic development. Langkawi, Malaysia, 2007.
[4] R. Herman and C. T. Gaunt, "Direct and indirect measurement of residential and commercial CIC: preliminary studies from South African Surveys," in 10th International Conference on Probabilistic Methods Applied to Power Systems (PMAPS), Puerto Rico, 2008.
[5] O. Dzobo, "Reliability cost and worth assessment of industrial and commercial customers in Cape Town," MSc dissertation, Dept. Elect. Eng., Univ. of Cape Town, Cape Town, South Africa, 2010. [ Links ]
[6] O. Dzobo, C. T. Gaunt, and R. Herman, "Reliability worth assessment of electricity consumers: a South African case study," J. Energy South. Africa, vol. 23, no. 3, pp. 31-39, 2012. [ Links ]
[7] A. Goldberg, "The economic impact of load shedding: the case of South African retailers," MBA thesis, Gordon Institute of Business, Univ. of Pretoria, Pretoria, South Africa, 2015. [ Links ]
[8] N. P. Nkosi and J. Dikgang, "Pricing electricity blackouts among South African households," J. Commod. Mark., vol. 11, pp. 37-47, 2018. [ Links ]
[9] U. J. Minnaar, W. Visser, and J. Crafford, "An economic model for the cost of electricity service interruption in South Africa," Util. Policy, vol. 48, pp. 41-50, 2017. [ Links ]
[10] U. J. Minnaar, "Cost of Unserved Energy in South Africa," presented at the CIGRE 8th Southern Africa Regional Conference. Cape Town, South Africa, 2017.
[11] A. O. Olasoji, K. O. Akpeji, C. T. Gaunt, D. T. O. Oyedokun, K. O. Awodele, and K. A. Folly, "Economy-Wide Assessment of the Impact of Electricity Supply Disruption Using Hypothetical Extraction," in Proc. IEEE PES/IAS PowerAfrica, Cape Town, South Africa, 2018, pp. 607612.
[12] R. Billinton and R. N. Allan, Reliability evaluation of power systems, Second edi. New York: Plenum Press, 1996.
[13] M. Bruch, V. Münch, M. Aichinge, M. Kuhn, M. Weyman, and G. Schmid, "Power blackout risks: risk management options," Emerging Risk Initiative (ERI). 2011.
[14] North Electricity American Reliability Corporation (NERC), "High-impact low-frequency event risk to the North American bulk power system," 2010.
[15] E. Wojczynski, R. Billinton, and G. Wacker, "Interruption cost methodology and results-A Canadian commercial and small industry survey," IEEE Trans. power Appar. Syst., no. 2, pp. 437-444, 1984.
[16] G. Wacker and R. Bilinton, "Customer cost of electric service interruptions," Proc. IEEE, vol. 77, no. 6, pp. 919-930, 1989. [ Links ]
[17] G. Wacker, E. Wojczynski, and R. Billinton, "Interruption cost methodology and results-a Canadian residential Survey," IEEE Trans. power Appar. Syst., no. 10, pp. 3385-3392, 1983.
[18] K. O. Akpeji, "Cost of electricity interruptions to commercial and industrial end-users," MSc dissertation, Dept. of Elect. Eng., Univ. of Cape Town, Cape Town, South Africa, 2019. [ Links ]
[19] S. Küfeoglu, "Evaluation of power outage costs for industrial and service sectors in Finland," M.S. thesis, Sch. Elect. Eng., Aalto Univ., Espoo, Finland, 2011. [ Links ]
[20] S. Abdullah and P. Mariel, "Choice experiment study on the willingness to pay to improve electricity services," Energy Policy, vol. 38, no. 8, pp. 4570-4581, 2010. [ Links ]
[21] G. H. Kjelle and A. T. Holen, "Reliability and interruption cost prediction using time-dependent failure rates and interruption costs," Qual. Reliab. Eng. Int., vol. 14, no. 3, pp. 159-165, 1998. [ Links ]
[22] R. Herman, C. T. Gaunt, M. Edimu, and O. Dzobo, "The development of a probabilistic reliability assessment process for decision-making in South Africa using CIC surveys," in 19th Southern African Universities' Power Engineering Conference (SAUPEC), Johannesburg, South Africa, 2010, pp. 114-118.
[23] O. Dzobo, C. T. Gaunt, and R. Herman, "Investigating the use of probability distribution functions in reliability-worth analysis of electric power systems," Electr. Power Energy Syst., vol. 37, pp. 110 - 116, 2012. [ Links ]
[24] R. Herman and C. T. Gaunt, "Probabilistic estimation of power system interruption impact using time element matrices," presented at the IEEE PES GM. Boston, 2016.
[25] G. H. Kjelle, I. B. Sperstad, and S. H. Jakobsen, "Interruption costs and time dependencies in quality of supply regulation," in 13th International Conference on Probabilistic Methods Applied to Power Systems (PMAPS), Durham, UK, 2014, doi: 10.1109/PMAPS.2014.6960620.
[26] K. O. Awodele, C. T. Gaunt, and R. Herman, "A review of customer interruption cost modelling for regulatory decision making," in 19th Southern Universities' Power Engineering Conference (SAUPEC), Johannesburg, South Africa, 2010.
[27] A. F. Adenikinju, "Electric infrastructure failures in Nigeria: a survey-based analysis of the costs and adjustment responses," Energy Policy, vol. 31, pp. 1519-1530, 2003. [ Links ]
[28] B. Bental and S. Ravid, "A simple method for evaluating the marginal cost of unsupplied electricity.," Bell J. Econ., vol. 13, pp. 249-253, 1982. [ Links ]
[29] J. Steinbuks and V. Foster, "When do firms generate? Evidence on in-house electricity supply in Africa," Energy Econ., vol. 32, pp. 505-514, 2010. [ Links ]
[30] R. Billinton and W. Wangdee, "Approximate methods for event-based customer interruption cost evaluation," IEEE Trans. Power Syst., vol. 20, no. 2, pp. 1103-1110, 2005. [ Links ]
[31] S. A. Ali, G. Wacker, and R. Billinton, "Determination and use of sector and composite customer damage functions," in Engineering Solutions for the Next Millennium. IEEE Canadian Conference on Electrical and Computer Engineering (Cat. No. 99TH8411), 1999, vol. 3, pp. 14831488.
[32] A. J. Praktiknjo, A. Hahnel, and G. Erdmann, "Assessing energy supply security: Outage costs in private households," Energy Policy, vol. 39, pp. 7825-7833, 2011. [ Links ]
[33] A. Shivakumar et al., "Valuing blackouts and lost leisure: Estimating electricity interruption costs for households across the European Union," Energy Res. Soc. Sci., vol. 34, pp. 39-48, 2017. [ Links ]
[34] E. Leahy and R. S. J. Tol, "An estimate of the value of lost load for Ireland," Energy Policy, vol. 39, pp. 1514-1520, 2011. [ Links ]
[35] J. Reichl, M. Schimdthaler, and F. Schneider, "The value of supply security: The costs of power outages to Austrian households, firms and the public sector," Energy Econ., vol. 36, pp. 256-261, 2012. [ Links ]
[36] M. de Nooij, C. Koopmans, and C. Bijvoet, "The value of supply security - The costs of power interruptions: Economic input for damage reduction and investment in networks," Energy Econ., vol. 29, pp. 277-295, 2007. [ Links ]
[37] P. Linares and L. Rey, "The costs of electricity interruptions in Spain. Are we sending the right signals?," Energy Policy, vol. 61, pp. 751-760, 2013. [ Links ]
[38] T. Zachariadis and A. Poullikkas, "The costs of power outages: A case study from Cyprus," Energy Policy, vol. 51, no. 2012, pp. 630-641, 2012. [ Links ]
[39] A. Rose, "Economic principles, issues, and research priorities in hazard loss estimation," in Modeling spatial and economic impacts of disasters, Springer, 2004, pp. 13-36.
[40] M. Greenberg, N. Mantell, M. Lahr, F. Felder, and R. Zimmerman, "Short and intermediate economic impacts of a terrorist-initiated loss of electric power: Case study of New Jersey," Energy Policy, vol. 35, no. 1, pp. 722733, 2007. [ Links ]
[41] Y. K. Cheng, W. K. Wong, and C. K. Woo, "How much have electricity shortages hampered China's GDP growth?," Energy Policy, vol. 55, pp. 369-373, 2013. [ Links ]
[42] Y. Okuyama, "Impact estimation methodology: Case studies." World Bank, mimeographed, 2009.
[43] C. W.Anderson, J. R. Santos, and Y. Y. Haimes, "A risk-based input-output methodology for measuring the effects of the August 2003 northeast blackout," Econ. Syst. Res., vol. 19, no. 2, pp. 183-204, 2007. [ Links ]
[44] G. Timilsina, P. Sapkota, and J. Steinbuks, "How much has Nepal lost in the last decade due to load shedding? an economic assessment using a CGE model," The World Bank, 2018.
[45] A. H. Sanstad, "Regional economic modeling of electricity supply disruptions: a review and recommendations for research," Lawrence Berkeley National Laboratory, 2016.
[46] K. O. Akpeji, A. Olasoji, C. T. Gaunt, K. A. Folly, K. O. Awodele, and D. T. Oyedokun., "A conceptual framework for assessing the economic costs of electricity disruptions," in 26th Southern African Universities Power Engineering Conference (SAUPEC), Johannesburg, South Africa, 2018.
[47] B. S. Diboma and T. T. Tatietse, "Diboma, B. S., and T. Tamo Tatietse. "Power interruption costs to industries in Cameroon," Energy Policy, vol. 62, pp. 582-592, 2013. [ Links ]
[48] O. Dzobo, "Risk-based interruption cost index based on customer and interruption parameter," Ph.D. thesis, Dept. Elect. Eng., Univ. of Cape Town, Cape Town, South Africa, 2014. [ Links ]
[49] K. Kivikko et al, "Comparison of reliability worth analysis methods: data analysis and elimination methods," IET Gener. Transm. Distrib., vol. 2, no. 3, pp. 321-329, 2008, doi: 10.1049/iet-gtd:20060532. [ Links ]
[50] MathWorks, "Curve fitting toolbox documentation (R2017b): Least-squares fitting." 2017.
[51] S. Küfeoglu and M. Lehtonen, "Evaluation of power outage costs for industrial sectors in Finland," 22nd International Conference on Electricity Distribution (CIRED). Stockholm, 2013.
[52] Q. Ahsan and A. C. Das, "Cost of electric service interruption: Awareness among consumers and utilities," in 4th International Conference on Electrical and Computer Engineering (ICECE), Dhaka, Bangladesh, 2006, pp. 128-131.
[53] M. Edimu, C. T. Gaunt, and R. Herman, "Using probability distribution functions in reliability analyses," Electr. power Syst. Res., vol. 81, pp. 915-921, 2011.
[54] N. Cross, R. Herman, and C. T. Gaunt, "Investigating the usefulness of the beta pdf to describe parameters in reliability analyses," in 9th International Conference Probabilistic Methods Applied to Power Systems (PMAPS), Stockholm, Sweden, 2006.
[55] R. Herman and C. T. Gaunt, "Probabilistic interpretation of customer interruption cost (CIC) applied to South African systems," in 11th International Conference on Probabilistic Methods Applied to Power Systems (PMAPS), Singapore, 2010, pp. 564-568.
[56] R. E. Miller and P. D. Blair, Input-output analysis: foundations and extensions, Second. Cambridge University Press, 2009.
[57] Y. Y. Haimes and P. Jiang, "Leontief-based model of risk in complex interconnected infrastructures," J. Infrastruct. Syst., vol. 7, no. 1, pp. 112, 2001. [ Links ]
[58] Y. Y. Haimes, B. M. Horowitz, J. H. Lambert, J. R. Santos, K. G. Crowther, and C. Lian, "Inoperability input-output model for interdependent infrastructure sectors. II: Case studies," J. Infrastruct. Syst., vol. 11, no. 2, pp. 80-92, 2005. [ Links ]
[59] Y. Y. Haimes, B. M. Horowitz, J. H. Lambert, J. R. Santos, C. Lian, and K. G. Crowther, "Inoperability input-output model for interdependent infrastructure sectors. I: Theory and methodology," J. Infrastruct. Syst., vol. 11, no. 2, pp. 67-79, 2005. [ Links ]
[60] C. Lian and Y. Y. Haimes, "Managing the risk of terrorism to interdependent infrastructure systems through the dynamic inoperability input-output model," Syst. Eng., vol. 9, no. 3, pp. 241-258, 2006. [ Links ]
[61] J. R. Santos, K. D. Yu, S. A. Pagsuyoin, and R. R. Tan, "Time-varying disaster recovery model for interdependent economic systems using hybrid input-output and event tree analysis," Econ. Syst. Res., vol. 26, no. 1, pp. 60-80, 2014. [ Links ]
[62] Statistics South Africa, "Final input-output tables for South Africa," 2014. http://www.statssa.gov.za/?page_id=1854&PPN=Report-04-04-02. [Accessed 01-Nov-2017].
[63] Statistics South Africa, "Electricity, gas and water supply industry, 2013. Statistical release P4001.," 2014.
[64] R. Poudineh and T. Jamasb, "Electricity supply interruptions: sectoral interdependencies and the cost of energy not served for the Scottish economy," Energy J., vol. 38, no. 1, 2017. [ Links ]
[65] D. Cheng and B. Venkatesh, "Literature survey and comparison of consumer interruption costs in North America and Europe.," in 27th Canadian Conference on Electrical and Computer Engineering (CCECE), Toronto, ON, Canada, 2014.
[66] H. Preuss, "Cape power cuts 'not Koeberg's fault,'" 2005. http://mg.co.za/article/2005-11-30-cape-power-cuts-not-koebergs-fault. [Accessed: 07-Nov-2019].
[67] Parliamentary monitoring group, "Power outages in the Western Cape: input from Eskom, Regional Electricity Distributor, Cosatu and Provincial Government," 2006. http://pmg.org.za/committee-meeting/6059. [Accessed: 07-Nov-2019].
[68] Eskom, "Interpreting Eskom load-shedding stages." http://loadshedding.eskom.co.za/LoadShedding/ScheduleInterpretation. [Accessed: 13-Apr-2019].
[69] A. Rose, G. Oladosu, and S. Liao, "Business interruption impacts of a terrorist attack on the electric power system of Los Angeles: Customer resilience to a blackout.," Risk Anal., vol. 27, no. 3, pp. 513-531, 2007. [ Links ]
[70] Financial Mail, South Africa's energy crisis: Eskom 2008 - 2015. South Africa: Time Media Books, 2015.
[71] J. M. Orsi and J. R. Santos, "Incorporating time-varying perturbations into the dynamic inoperability input-output model," IEEE Trans. Syst. Man, Cybern. A Syst. Humans, vol. 40, no. 1, pp. 100-106, 2009. [ Links ]
[72] M. J. Neidell, S. Uchida, and M. Veronesi, "Be Cautious with the Precautionary Principle: Evidence from Fukushima Daiichi Nuclear Accident," National Bureau of Economic Research, 2019.

Kingsley O. Akpeji received the BSc degree in electrical & electronic Engineering from the University of Ibadan, Nigeria in 2014, and the MSc degree in electrical Engineering from the University of Cape Town (UCT), South Africa, in 2019. He received the Open Philanthropy Project scholarship for his MSc degree. He is currently a teaching and research assistant at the Department of Electrical Engineering, UCT. His research interests include power system reliability and resilience evaluation and planning.

Azeez O. Olasoji received the B.Eng. degree in electrical & electronics engineering from the Federal University of Technology Akure, Nigeria in 2015. He is currently a graduate research student at the University of Cape Town, South Africa, and an awardee of the Open Philanthropy Project scholarship working towards his MSc degree in electrical engineering. His research interest includes power systems reliability worth evaluation.

C Trevor Gaunt BScEng(Elec) Natal, MBL South Africa, Ph.D. Cape Town is an Emeritus Professor and Senior Scholar in the Department of Electrical Engineering at the University of Cape Town. He is the principal investigator on a project funded by the Open Philanthropy Project to investigate the mitigation of the effects of geomagnetically induced currents that can introduce extreme distortion into power systems.

David Oyedokun received the BSc, MSc and Ph.D. degrees in electrical engineering from the University of Cape Town (UCT), South Africa, in 2007, 2010 and 2015 respectively. He obtained his postdoctoral experience at the South African National Space Agency (SANSA). He has published several peer-reviewed research papers and a book chapter. He is a currently a Senior Lecturer at the Department of Electrical Engineering, UCT. His area of specialization includes power system stability, geomagnetically induced currents, renewable energy, and power delivery optimization. Dr. Oyedokun has served on several IEEE committees and was a recipient of the IEEE MGA GOLD Achievement Award in 2011. He is currently the IEEE South Africa Section Chair.

Kehinde Awodele (M'07) received her BSc (honours) degree in electrical and electronic engineering in 1979 from University of Ife (now Obafemi Awolowo University), Ile-Ife, Nigeria and MSc (Eng.) degree in electrical power and machines in 1991 from Ahmadu Bello University, Zaria, Nigeria. She previously worked in the electricity meter manufacturing industry in Nigeria for several years during which she had series of training at the technical partners' facilities in Switzerland, Germany and Greece. She later lectured at the Namibian University of Science and Technology, Windhoek. She is currently a Senior Lecturer in the Department of Electrical Engineering, University of Cape Town, South Africa. Her research interests include power system reliability and resilience, power system protection, distributed generation, renewable energy, demand side management and smart grids. She is a member of the Nigerian Society of Engineers (NSE) and the IEEE.

Komla A. Folly (M'05, SM'10) received his BSc and MSc degrees in electrical engineering from Tsinghua University, Beijing, China, in 1989 and 1993, respectively. He received his Ph.D. in electrical engineering from Hiroshima University, Japan, in 1997. From 1997 to 2000, he worked at the Central Research Institute of Electric Power Industry (CRIEPI), Tokyo, Japan. He is currently a Professor in the Department of Electrical Engineering at the University of Cape Town, South Africa. In 2009, he received a Fulbright Scholarship and was Fulbright Scholar at the Missouri University of Science and Technology, Missouri, USA. His research interests include power system stability, control and optimization, HVDC modeling, grid integration of renewable energy, application of computational intelligence to power systems, smart grid, and power system resilience. He is a member of the Institute of Electrical Engineers of Japan (IEEJ) and a senior member of the IEEE.
The Open Philanthropy Project provided financial support for the research, including the customer survey in 2018.
Authors' email addresses: akpkin001@myct.ac.za (corresponding author); olsaze001@myuct.ac.za; ct.gaunt@uct.ac.za; davoyedokun@ieee.org; kehinde.awodele@uct.ac.za; komla.folly@uct.ac.za.
Appendix
A. Assessing linear relationship between CIC and average monthly electricity bill (Table A-I)
B. Multiple regression analysis of CIC
The multiple linear regression model for CIC assessment was specified for the reference electricity interruption scenario considered in the survey: an unplanned electricity interruption of a given duration occurring at the busiest operating time and season of a business. The generic form of the model is given by (1).

Customers without backup power supply are considered to have zero mitigation in place, hence their reported interruption cost is taken as their unmitigated loss. The interruption cost besides the cost of running a backup power supply is considered the unmitigated loss of customers who own backup power supply.
LU (unmitigated loss) is the response variable. The predictors are economic sector Sec; electricity interruption duration d; average monthly electricity bill, E; backup ownership Bo; percentage of business facility powered by backup power supply, BFC, backup power supply size BSZ. 0i's are the model's coefficients. Bois a logical variable; takes the value 1 if present, otherwise it is 0. Sec is a nominal variable, hence Secjis a dummy (indicator) variable for the jtheconomic sector in the dataset; its associated model coefficient is Olj. To evaluate (1) for the jtheconomic sector, SeCjtakes the value 1, otherwise it takes the value 0. The hospitality sector is the reference sector i.e. Sec1; to evaluate the model for this sector only, the second term of (1) i.e. Σnj=201jSecjis eliminated. The parameter estimates and goodness of fit of the multiple regression model are shown in Tables B-I and B-II respectively.


