


Services on Demand
Article
 English (pdf)
 Article in xml format
 Article references
Indicators

Related links
-
 Cited by Google
 -
 Similars in Google
Share

 Permalink
SAIEE Africa Research Journal
On-line version ISSN 1991-1696
Print version ISSN 0038-2221
SAIEE ARJ vol.111 n.1 Observatory, Johannesburg Mar. 2020
ARTICLES
Optimized Rain Drop Size Distribution Model for Microwave Propagation for Equatorial Africa1
Djuma SumbiriI; Thomas. J. O. AfulloII
IDiscipline of Electrical, Electronic & Computer Engineering, School of Engineering, Howard College Campus, University of KwaZulu-Natal, Durban 4041, South Africa (e-mail: sumbirdj@yahoo.fr)
IISenior Member, IEEE, Telkom Centre of Radio Access & Rural Technologies, Discipline of Electrical, Electronic & Computer Engineering, School of Engineering, Howard College Campus, University of KwaZulu-Natal, Durban 4041, South Africa (e-mail: afullot@ukzn.ac.za)
ABSTRACT
In radio propagation, modelling of rainfall rate, rain attenuation and drop size distribution is highly location-dependent and thus requires availability of reliable data from various locations. Models and mathematical predictions obtained based on data from one location often prove inadequate when applied to another location with either slightly or radically different rainfall pattern. In this paper, the focus is to develop a new rainfall drop size distribution model for equatorial Africa using disdrometer data obtained in Butare, Rwanda (2°35'53.88"S and 29° 44' 31.5" E). Rainfall data was classified into annual, monthly and rainfall regimes which are drizzle, widespread, shower and thunderstorm, based on their rainfall rates. The maximum likelihood estimation technique was applied to construct estimates of input Drop Size Distribution (DSD) fit parameters of the developed statistical distribution for rainfall DSD in Butare. The newly obtained distribution was compared to the existing rainfall DSD models, namely, Lognormal, Gamma, Marshall- Palmer and Weibull distributions, and found to be an improvement over the existing ones. The Mie Scattering technique is employed to derive the scattering parameters. Thereafter, the derived scattering parameters with DSD models are used for the estimation of rainfall attenuation for the Central African region.
Index Terms: Rainfall Rate and Drop Size Distribution, DSD Modelling for Central Africa, Improved Rainfall DSD Model, Radio climatic Modelling, Rainfall Specific Attenuation.
I. INTRODUCTION
THE problem of data availability for location-specific modelling has been tackled with good results in various regions of the world. The earliest of such models were based on data from temperate regions [1]. Other regions such as the subtropical regions of Southern Africa [2-3], the tropical regions of West Africa [4] and Ethiopia [5] have also amassed extensive data and have developed and tested fitting models based on their data. The primary motivation is to develop a reliable database of rainfall measurements and to utilize it to provide an empirical basis for modelling of rain drop size distribution fitted specifically to the equatorial region of Central Africa and its unique rainfall pattern. This work aims to explore the specific peculiarities that might appear when rain data from the Central Africa region is applied to implement the well-known models which were developed based on measurements carried out elsewhere, and to develop mathematical tools and methods that factor these peculiarities into the key radio propagation expressions employed in communication planning.
II. DATA MEASUREMENTS AND PROCESSING
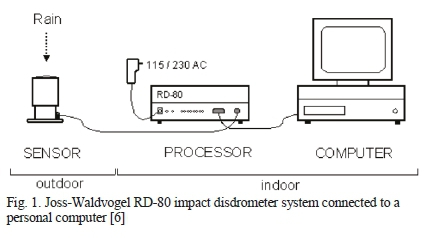
Rainfall measurement data was acquired using the JW RD-80 disdrometer installed at the roof of MSc-In-ICT building, University of Rwanda, Butare (2°35'53.88"S, 29°44'31.53"E at 1769 m a.s.l) over a period of 32 months between 2012 and 2015. The equipment has two main components: a sensor and a processor, as shown in Figure 1. The sensor is an outdoor equipment exposed to the rain drops to be measured, while the processor processes the signal pulses caused by drops hitting the sensor. The drop size measurements from the processor are recorded and evaluated on a personal computer by using disdrodata software. This software enables the user to record and evaluate drop size measurements with a windows-based personal computer or notebook [6]. The accuracy of this disdrometer is ±5%, and it can process the rainfall rate and rain drop statistics data into 20 different channels via the indoor unit. Each of the channels is related to rain drops with diameter, D, in the range 0.313 mm < D < 5.373 mm.
In the entire period of measurement, 1113707 rainfall samples were recorded and those with total sum of drops less than 10 were excluded from the data samples to compensate for the dead-time errors as they are considered to be within the noise level [7]. The maximum number of rain drops per sample in the measurement period is 3643 drops with a maximum rainfall rate of 118.5 mm/h, and a minimum of 0.0029 mm/h for a total of 56620 filtered rainfall samples. Then, the filtered samples were considered and regrouped based on monthly, annual and regime variations.
In a yearly cycle, Rwanda has four seasons which are determined by the variability of rainfall- two rainy seasons interspersed between two dry seasons as follows: the Short dry season (From January to February); the Long rainy season (March to the beginning of June); the Long dry season (from June to mid-September); and the Short rainy season (mid-September to December) [8].
The data was arranged and categorized into different rainfall regimes based on rainfall rates [3] as follows: drizzle (0 mm/h < R < 5mm/h); widespread (5 mm/h < R < 10 mm/h); shower (10 mm/h < R < 40 mm/h); and thunderstorm (R > 40 mm/h). For the RD-80 distrometer, the rain rate, R and the rain DSD, N(Di), are related to the mean drop diameter, Di, and are given by [6, 9]:
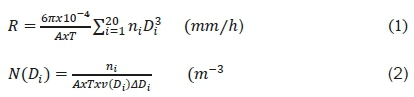
Where n represents the number of drops measured in the class i, T is the sampling time (one-minute sampling time) and A is the sampling area (0:005 m2); v(Di) is the terminal velocity and ΔDt is the diameter interval of the rain drops at the ith channel of the disdrometer. TABLE I gives the summary of rainfall data recorded for the period of measurement between 2012 and 2015.
III. RAINFALL RATE ANALYSIS FOR BUTARE
While designing a microwave link, it is recommended by the International Telecommunication Union (ITU-R) to target 99.99 % system availability; therefore the rainfall rate (R0.01) exceeded for 0.01% of the time in the region of interest has to be determined. The statistical information obtained is based on the cumulative distribution function (CDF) for rainfall rates in Butare, Rwanda. The analysis is done based on annual, monthly and regime rainfall rate using the above disdrometer data between 2012 and 2015.
A. Monthly Distribution of Rainfall Rate
Fig. 2(a) shows the monthly cumulative distribution of rainfall rate distributions for each of the months in Butare, Rwanda. The rainfall rate percentage exceedences at 10%, 1%, 0.1% and 0.01% taken from Figure 2(a) are presented in TABLE II.
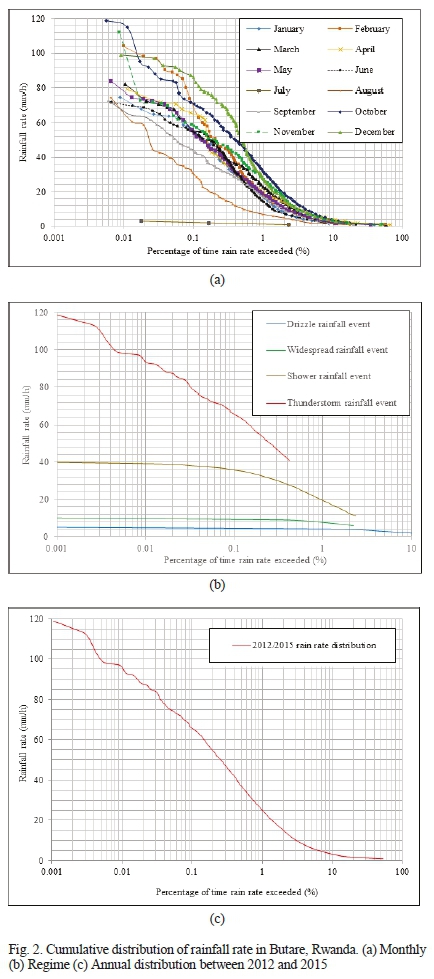
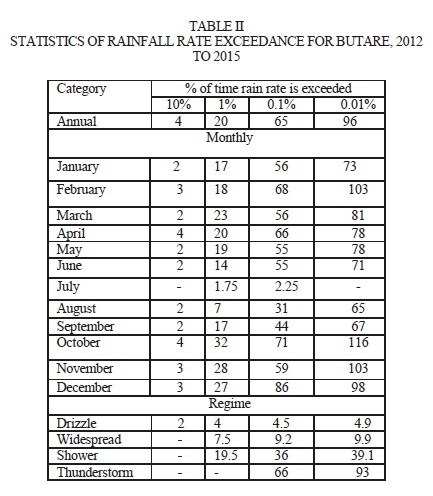
The month of the highest point rainfall rate is October with R0.01 = 116 mm/h, while July has the lowest point rainfall rate in the year. Generally, as shown in TABLE II, the monthly point rainfall rate values R0.01 are observed to be high from October to December and February to May in the short and long rainy season in Rwanda. A decrease in the values of R0.01 from
December to January in the short rainy season and other low R0.01 values are observed from June to September in the long dry season, noting that the point rainfall rate is close to zero in July because there is almost no rain in that period of the year. From the above analysis, it is evident that October to December and February to May are the wettest periods, hence intense microwave attenuation due to rainfall in Butare, Rwanda.
B.Regime Distribution of Rainfall Rate
In this section, the standard four rainfall regimes (drizzle, widespread, shower and thunderstorm) are analyzed. As shown in Table 1, in Butare 89.93 % of the total rainfall event in the period of measurement are in the drizzle band; followed by widespread, shower and thunderstorm at 4.79 %, 4.48 % and 0.8 %, respectively. Results are presented in Figure 2(b) and Therefore, it is found that the rainfall rate exceedences for drizzle events is R0.01 =4.9 mm/h, widespread events at R0.01 = 9.9 mm/h; shower events at R0.01 = 39.1 mm/h and thunderstorm events at R0.01 = 93 mm/h. Since microwave and millimeter wave links are mostly attenuated by rainfall droplets at high rainfall rate, therefore, Shower and Thunderstorm events are given highest consideration in rainfall design.
C.Annual Distribution of Rainfall Rate
The annual cumulative distribution of rainfall rate, exceeded for different percentages of time using measurements obtained from Butare, Rwanda between 2012 and 2015 is shown in Figure 2. From this plot, results show that, the measured value of the rainfall rate exceeded at 0.01% (R0.01 = 96 mm/h) for the entire period of measurement is much higher than the recommended value from ITU-R P.837 (R0.01 = 70 mm/h).
IV. RAIN DROP SIZE DISTRIBUTION MODELS
The raindrop size distribution (DSD), denoted by N(D), is the number of raindrops at a given diameter per unit volume. It varies with respect to the region, season, year and depends on factors such as rainfall rate wind and rainfall types [10]. Generally, according to Afullo [3], Marzuki et al. [11],
Owolawi [12], the measured rainfall DSD can be estimated as:

where Nt (m-3) is the raindrop concentration and f (D) is the probability density function of the raindrop distribution in mm-1. Many researchers such as Marshall and Palmer [13], Atlas and Ulbrich [14], Sekine and Lind [15], Ajayi and Olsen [1], Jiang et al. [16], have developed several DSD models in different climatic regions and their corresponding input fit-parameters are estimated by the method of moments and maximum likelihood estimation techniques [3,10]. Several DSD models have thus been proposed. These comprise the Negative exponential (Marshall-Palmer), Lognormal, Weibull and the modified Gamma drop size distributions.
The Lognormal rainfall DSD model is given in [1] as:

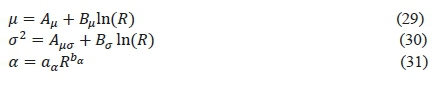
Where Nt is the drop concentration, μis the mean shape parameter, σis the standard deviation of the drop sizes and D is the mean drop diameter which is obtained directly from rainfall data. The three lognormal parameters Nt, μand σ are derived from the observed spectrum for rain event and they are related to rainfall rate, R, as given by [1]:
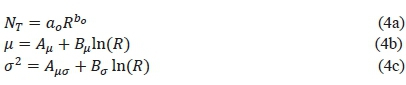
Where R is the rainfall rate, Αμ,Βμ, Ασand Βσare regression coefficients which depend on the region of interest.
The modified Gamma rainfall DSD model is given in [14, 17] as:
Where D is the mean drop diameter, Nm is the scaling parameter, μis the shape parameter, and Λis the slope parameter of the distribution. μis fixed to 2 or 3 in most cases and Λand Nm, are fitted against measured rainfall rate, R as:
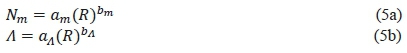
Where and bA are regression coefficients to be determined.
The Negative exponential rainfall DSD model given by

Where the inputs parameters for the Negative exponential rainfall DSD model are similar to those of the modified Gamma rainfall DSD model in (5) with μ fixed to zero.
The Weibull distribution is expressed as proposed by Sekine et al. [15, 16] by:
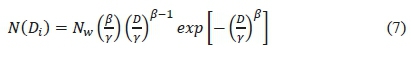
Where D (mm) is drop diameter, β is the shape parameter; γ is the scale parameter and Nw, the modified parameter. The power law regression coefficients of the Weibull DSD Model in (7) are given by:
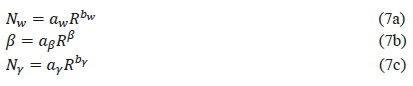
Where aw, bw, αβ, bβ, ayand byare regression coefficients of the model parameters.
Α. Variability of Drop Size Distribution Modelling for Butare, Rwanda
In this section, by using the method of moments estimation technique as explained [9], various input parameters for the four different rainfall DSD models applied in this work are estimated and results are presented in TABLE III and IV. By using the estimated parameters in TABLE III, different drop size distribution models for Butare are developed, and the results are presented in Figures 3 (a)-(d) at rainfall rates of 4.95 mm/h, 9.54 mm/h, 26.86 mm/h and 60.08 mm/h respectively. DSD models are fitted to the rain DSD as spectra observed from the disdrometer at Butare station. The rain drop diameters, the modelled drop size distribution and the measured data are compared for different models. From Figures 3 (a)-(d), one observes a progressive change in the shape of the DSD as rainfall rate increases. This means that as the rain rate increases, the diameter region of the DSD gets wider.
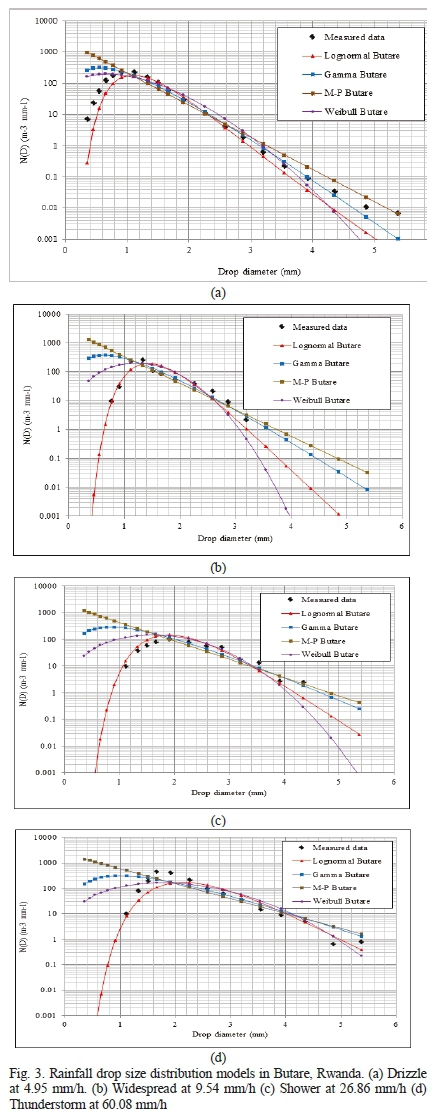
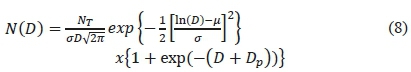
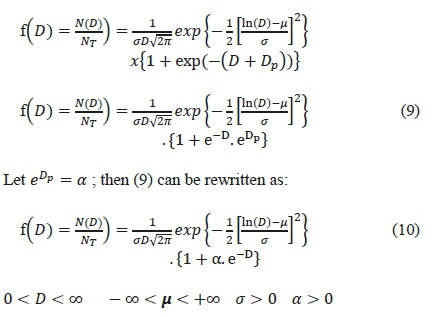
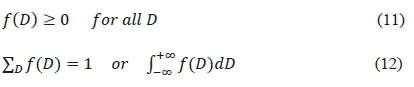
At the rainfall rate of 4.95 mm/h, in Figure 3(a), the lognormal model takes the shape of the measured DSD even though it underestimates it at drop size diameter region less than 1 mm. It is observed that the Gamma and Weibull models seem to coincide with the measured DSD, even though they overestimate it at drop size diameter regions less than 0.656 mm. Figure 3(b) shows that, at 9.54 mm/h, weibull, Gamma and the Negative Exponential (M-P) models overestimate the measured DSD in the diameter range of 0.359 to about 1 mm. At this rainfall rate, the lognormal model performs best because it takes the shape of the measurement data even if it slightly overestimates it between 1.331 and 2.259 mm. At the rainfall rate of 26.86 mm/h as shown on the graph of Figure 3(c), the lognormal model is seen as a good fit to the measured DSD compared to other models. The Gamma, M-P and Weibull models overestimate the measurement at drop diameter region below 1.665 mm. At high rainfall rates of 60.08 mm/h as shown in Figure 3(d), the lognormal model takes the shape of the measured DSD but neither it nor other statistical models fits measurements well.
B. Development of a New Rainfall Drop SizeDistribution
From plots of Figures 3 (a)-(d), it is seen that the diameter rain drop of the DSD gets wider as the rainfall rate increases and the Lognormal model tends to fit the measurement particularly at high rainfall rate. By analysing the results, the drizzle rainfall regime DSD reaches its peak at drop diameter of Dp = 0.913 mm, the widespread, shower and the thunderstorm reach their peaks at drop diameters of 1.116 mm, 1.665 mm and 1.912 mm, respectively. When D = Dp, the measured DSD is at its maximum and its variation with respect to the drop diameter is equal to zero. When D < Dp, the Lognormal model performs best because it takes the shape of the measurements even if it also slightly underestimates. When D > Dp, the Gamma model best coincides with the measured DSD. Therefore, there is need to develop a new rainfall DSD model to improve on the existing ones.
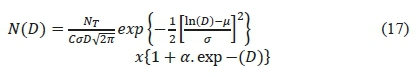
By modifying the Lognormal distribution for N(D), we propose the DSD model formulated as follows:
Where N(D) is the rain drop size distribution, NT is the drop concentration (inm-3), Dp is the peak diameter in(mm), D is the mean drop diameter (in mm), μ is the shape parameter, Nt , and σ is the scale parameter. As discussed in section 4, the measured rainfall drop size distribution can be estimated by (3); therefore,
But according to [19], for f(D) to be a valid probability density function of a random variable D, the following two conditions given in equations (11) and (12) have to be satisfied:
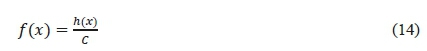
From a purely mathematical perspective, any non-negative function with a finite positive integral (sum) can be converted to a legitimate pdf. As an example, let the function h(x) be a non-negative function that is positive on the interval L < x < U, zero elsewhere, and C, a positive constant given by [19]:
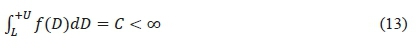
Therefore, the probability density function of a random variable x taking values on the interval L < x < U, will be given by:
By applying the approach in (13) and (14) from [19], the equation (10) has to be normalized so as to satisfy the two important conditions stated in (11) and (12) for a valid pdf. Therefore, the normalized form of (10) is given by:
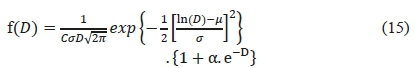
Where C is a normalizing constant given by:
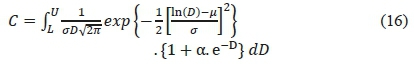
Where L and U are the lower and upper diameter ranges of the mean rain drop. Therefore, the mathematical expression of the proposed DSD model is:
C. Optimization using the Method of Maximum Likelihood Technique
To determine the input fit parameters for the proposed model, the maximum likelihood estimation technique has been used. This method, developed by R.A. Fisher in 1922, is the most popular technique for deriving estimators [21]. Remember that if Di, D2, D, Dn are an independent and identically distributed random sample from a population with probability density functionf denoted as f ((Di, D2, D3,Dn /μ, σ2, α), the likelihood function is defined by [21]:
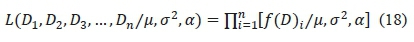
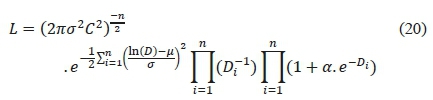
The maximum likelihood estimate of parameter μ(σ2, or ặ) is that value of μ(σ2or a) which maximises the likelihood function in (18): it is the value that makes the observed data the "most probable". Substituting (15) in (18), the likelihood function will be expressed as:
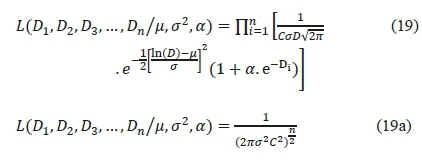
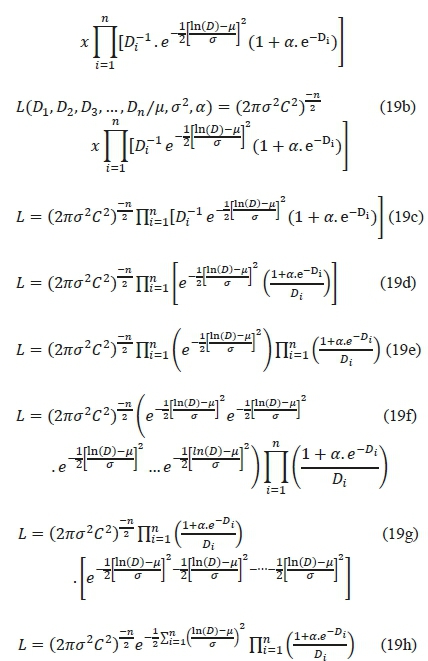
Then,
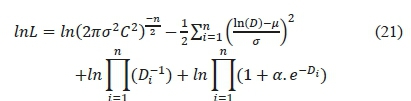
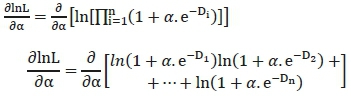
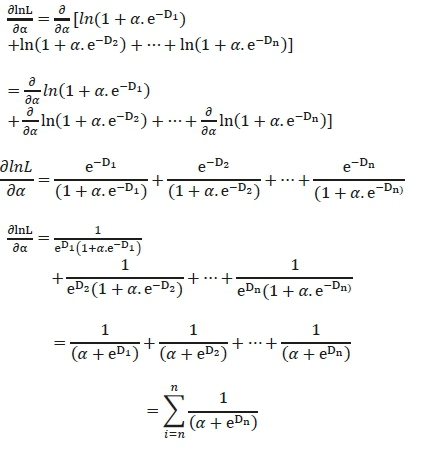
By finding the natural logarithm of the likelihood function expressed in (20), the log likelihood of the probability distribution function is developed and is given by:
Adopting partial differential of equation (21) and equating to zero, results in the following maximum likelihood estimation equations:
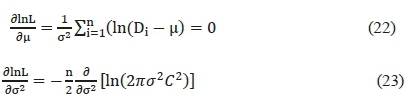
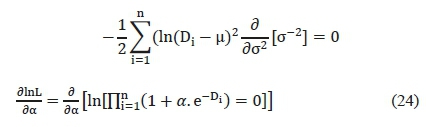
Solution of equations (22), (23) and (24) represent the maximum likelihood estimators of the probability distribution function in (15). From equation (22), the parameter μ that maximizes the likelihood function can be determined as follows:
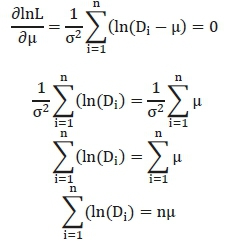
Therefore,

From (23), the parameter σ2, is obtained as following:
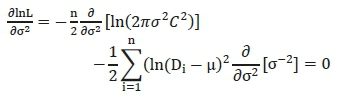
Let σ2 = y, then, the above expression becomes:
For y = σ2, then we have:
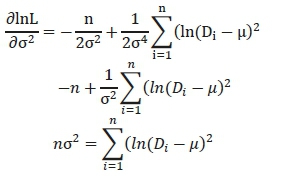
Therefore,
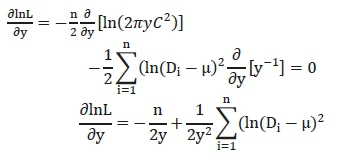
From (24), the parameter that maximizes the likelihood function can be determined as follows:
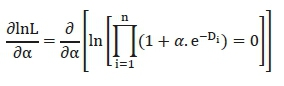
But, for 1, 2, 3... n,
Then,
Thus,
Therefore,
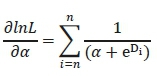
For

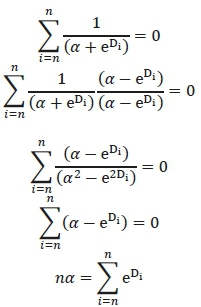
Therefore, α, is given by:

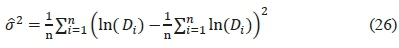
The method of maximum likelihood estimation technique is thus used to estimate the fit parameters of the new model in (17) and parameters μ, σ2 and α from measured data are determined using estimators given in equations (25), (26) and (27). The last parameter, Nt is optimized from the self-consistency rule of rainfall DSD such that:
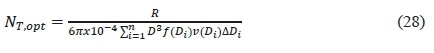
where R, is the rainfall rate, f (Di) is the probability density function, v(Di) is the terminal velocity and f(Di) is the diameter interval of the rain drops at the ith channel of the disdrometer. From (25) to (27), estimation of fit parameters by the method of maximum likelihood are presented as follows:
D. Comparison of the proposed DSD model with otherDSD models in Butare, Rwanda
Distribution parameters for different rainfall DSD statistical models were estimated using the methods earlier explained. The Lognormal (LGN), Modified Gamma (MGM), Marshal-Palmer (M-P) and Weibull (WBL) distributions were fitted to the measurement data using the method of moment (MoM) technique. The new DSD model was fitted using maximum likelihood (ML) estimation technique. Therefore, various input model parameters obtained by applying the above techniques (MoM or ML) are expressed as a function of rainfall rate via regression techniques and results are presented in the following subsections
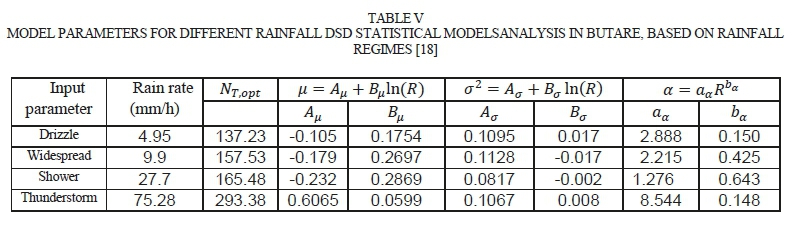
Regime Variation of Rainfall Drop Size Distribution: Using the MoM technique and ML estimation technique, various input parameters for different DSD models for Butare were estimated and results are presented in TABLE III and V for the existing DSD models (LGN, MGM, MP and WBL) and the new DSD model, respectively. In TABLE III and V we present the model parameters for different DSD statistical models in Butare based on rainfall regimes. The measured data was compared with different DSD models at selected rainfall rates. The comparison is done at rainfall rate of 4.95 mm/h for drizzle; 9.9 mm/h for widespread; 27.7 mm/h for shower; and 75.28 mm/h for thunderstorm regime; and results are shown in Figure 4(a)-(d).
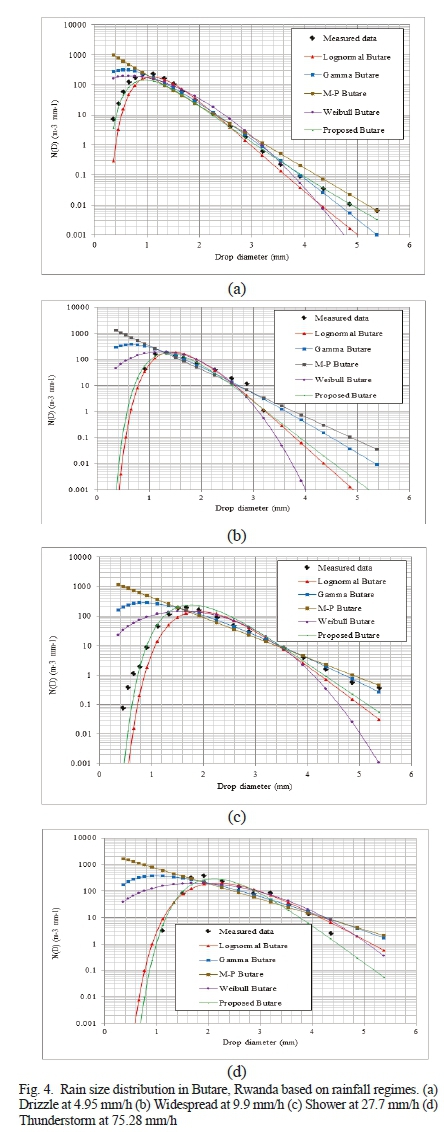
In Figure 4(a), at rainfall rate of 4.95 mm/h, the LGN model underestimates the measurement at drop diameter region between 0.359 and 0.913 mm. It is seen that, the MGM and WBL models seem to coincide with the measured DSD even though they overestimate it at lower raindrop diameter regions. Compared with other statistical models, the measured DSD is best fitted by the proposed DSD model. In Figure 4(b), for widespread at 9.9 mm/h, the WBL, MGM and the M-P models overestimate the measurement in the diameter range up to 1 mm, the LGN model seems to fit the measurement better. In Figure 4(c), for shower rainfall at 27.7 mm/h, the proposed DSD model best fits the measured DSD compared to other models. The MGM, M-P and WBL models all overestimate the measurement at drop diameter region less than 1.506 mm. For thunderstorm rain at 75.28 mm/h (as shown in Figure 4(d)), the proposed DSD model gives a better fit compared to other DSD models. From the plotted graphs of Figure 4, it is observed that the models have different performances as the rainfall rate changes. Therefore, there is need for proper error estimation between the measured DSD and the distribution models at various rainfall rates to establish the best model in the region.
In this regard, the various DSD models were tested using the root mean square error (RMSE) test given by [22]:
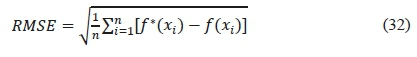
Where f*(xi) is the measured data from the disdrometer and f (xi) the modelled data, with n being the sample size.
Using equation (32), the results of the error estimation for different rainfall DSD models for Butare based on the four rainfall regimes are presented in TABLE VI.
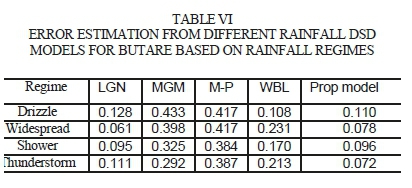
From TABLE VI, the DSD model giving the lowest RMSE will be the best fit to the measurements; therefore, by combining the information from Figure 4 and TABLE VI, the Weibull DSD model best fits the measured data with RMSE of 0.108 for drizzle rainfall events. The Lognormal best fits the measured data with RMSE of 0.061 for widespread rainfall events.
For the shower rainfall event, both Lognormal and the new DSD models best fit the measurement with RMSE of 0.095 for Lognormal and the RMSE of 0.096 for the new DSD model. Finally, the new proposed model best fits the measured data with RMSE of 0.072 for thunderstorm rainfall regime.
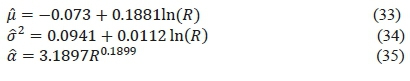
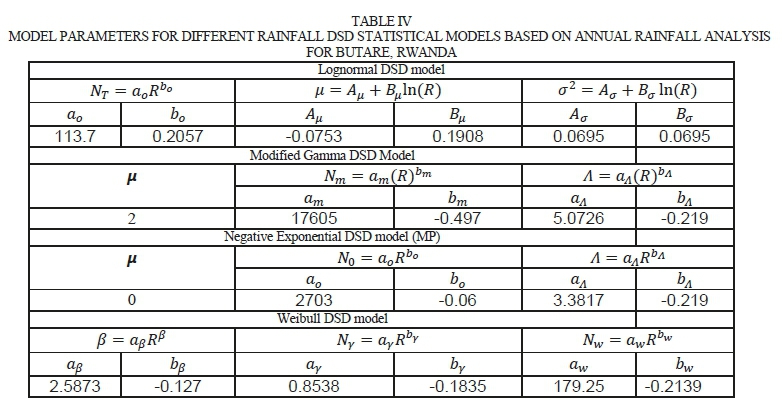
Annual Variation of Rainfall Drop Size Distribution: Estimation of annual fit parameters for different rainfall DSD statistical models was carried out using the MoM and ML techniques as earlier explained. The LGN, MGM, M-P and WBL drop size distribution models were fitted to the measured DSD by the MoM technique and results are presented in TABLE IV. For the proposed DSD model given in (17) and maximum likelihood estimators given in (25) to (27), the model parameters for the prediction of annual drop size distribution in Butare for rainfall rates between 0.0029 and 118.516 mm/h are given by:
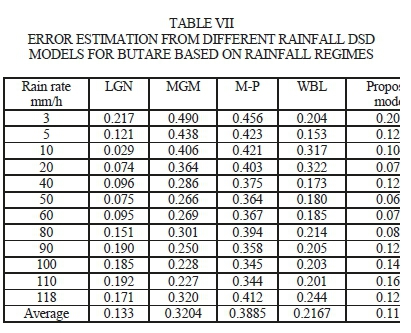
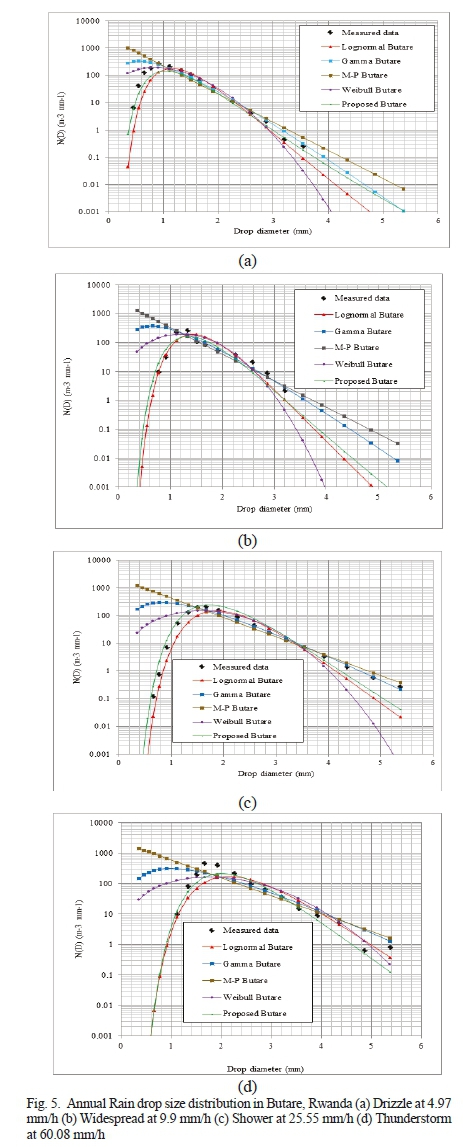
The measured data was compared against the different DSD models at selected rainfall rates. The selected rainfall rates are 4.97 mm/h for drizzle, 9.9 mm/h for widespread, 25.55 mm/h for shower and 60.08 mm/h for thunderstorm rainfall regimes, and results are shown in Figure 5. From the plotted graphs of Figure 5, it is observed that those models have different performances as the rainfall rate is varied. That is why there is need for quantitative analysis between the measured DSD and the distribution models so as to determine the most suitable annual DSD model. Using equations (32), the results of the error estimation are presented in TABLE VII. From TABLE VII, the annual RMSE values show that the WBL DSD model best fits the measurement with rainfall rate less than 5 mm/h. As the rainfall rate increases, results show that between 5 mm/h and 40 mm/h, the LGN DSD model best fits the measurement. Finally beyond 50 mm/h, the proposed model is seen to be the best as it gives the lowest RMSE values compared to other distributions and therefore it can be considered as the best annual model for Butare because it best fits the measured DSD at high rain rates that are most associated with microwave and millimetre wave fading.
V. SPECIFIC RAINFALL ATTENUATION PATTERNS OVER BUTARE, RWANDA
A. Introduction
The rainfall specific attenuation or attenuation per unit length over a fixed radio link is a fundamental quantity in the calculation of the attenuation due to rain statistics for both terrestrial and earth-space paths. The total value of specific rain attenuation can be computed by integrating each raindrop contribution as given by [23]:

where As is the specific rain attenuation, N(D) is the drop size distribution, N(D)dD is the number density of raindrops with diameter D in the interval dD and; Qext , the extinction cross-section, which is determined from classical scattering theory developed by Mie. Assuming that the raindrops, illuminated by a plane wave, are uniformly distributed in a rain-filled medium and the distance between raindrops is sufficiently large to avoid multiple scattering [24]. The extinction-cross-section depends on the complex refractive index of water, m, the wavelength, λ, and the shape and the size of the rainfall drop, and can be computed by the following expression [25]:
where, is the wave number and Re{S(0)} is the real part of the forward scattering amplitude for spherical raindrops which is the greater portion of the extinction cross-section coefficient. The forward scattering amplitude for spherical rain drops is expressed by [25]:

where an(m,a) and bn(m,a) are the Mie scattering coefficients which are functions of rain drop diameter, wavelength, and complex refractive index of water. Parameters m and α depends on the ambient temperature and the frequency of droplet. The extinction cross-section in (37) can be reduced to a power law relation as a function of raindrop diameter, D, as follows [24]:

where ā, is the radius of the assumed spherical droplet in millimetres, Kextand āζextare constants computed by Alonge at 20°C for frequency up to 1000 GHz [26].
Based on the Joss-Waldvogel disdrometer channels, equation (36) can be reduced to the following expression [27]:

where N(Di)ADi is the number density of the droplet with equivalent diameter Di in the diameter interval ADb
In the computation of the specific attenuation due to rain in Butare, equation (40) has been used and this estimation is based on raindrop size distribution models developed in section four.
B. Variability of Specific Attenuation Distribution
By using the expression given in (40), the specific rain attenuation for the four rainfall regimes are estimated over frequencies from 2 GHz to 60 GHz at 20°C in Butare, Rwanda, and the results are presented in Figures 6(a)-(d). These plots show comparisons between the specific rain attenuation for drizzle at 4.9 mm/h, widespread at 9.9 mm/h, shower at 39.1 mm/h, and thunderstorm at 96.02 mm/h using various DSD models including the ITU-R estimation for both horizontal and vertical polarization [28]. From the results, it is seen that the specific attenuation due to rain increases as the frequency increases where the lowest and highest values of rain attenuation are recorded in the drizzle and thunderstorm rainfall regimes, respectively.
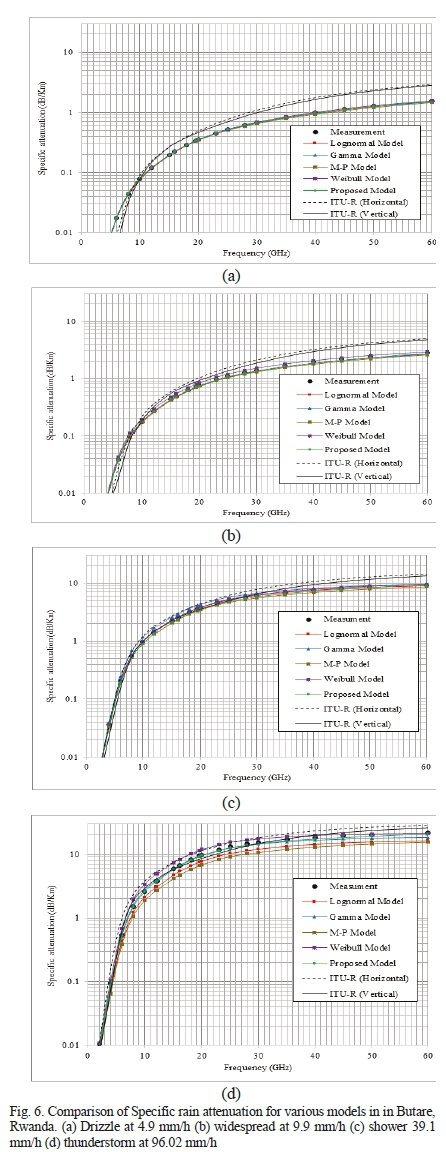
In Figure 6(a), for drizzle at 4.9 mm/h, the ITU-R models (horizontal and vertical polarization) underestimate the measurement for frequencies less than 10 GHz, while they overestimate beyond this frequency. In this regime, the other remaining models appear to match the measurement at all considered frequencies.
In Figure 6(b), for widespread at 9.9 mm/h, the Lognormal, Gamma and the new Model give the best fit to the measurement compared to other models.
For shower rainfall regime at 39.1 mm/h shown in Figure 6(c), the ITU-R model for horizontal polarization and Gamma models are seen to match the measurement for frequencies up to 8 GHz, while they overestimate the measurement for frequencies above 8 GHz.
It is also observed that, the Marshall-Palmer model underestimates the measurement in this rainfall regime for all the frequency ranges, while the ITU-R for vertical polarization coincides with the measurement for frequencies up to 33 GHz, and then overestimates it beyond this frequency. In this regime, the Lognormal, Weibull and the new model give better fits compared to other models.
For thunderstorm at 96.02 mm/h as shown in Figure 6(d), the ITU-R model for horizontal polarization overestimates the measurement, while the Marshall-Palmer model underestimates them. The ITU-R model for vertical polarization overestimates the measurement between 6 GHz and 10 GHz, then closely follows the measurement up to 45 GHz. The Weibull model predicts well for frequencies above 35 GHz. In this rainfall regime as seen on plot of Figure 6(d), the new model gives the best fit to the measurement compared to other models.
VI. CONCLUSION
In this paper, a new rainfall drop size distribution model for equatorial Africa has been developed using disdrometer data collected in Butare, Rwanda. The method of maximum likelihood estimation technique has been used to determine its corresponding input fit-parameters. Error analysis as well as comparisons with other models showed that the proposed model is a slightly better representation of the rainfall DSD in the region than any of the current models. It can be concluded from the results that as rainfall rate increases, the proposed model proves to be the best prediction model for DSD in Central Africa and other locations having similar climate and similar ranges of maximum rain rate. The Lognormal, Gamma and Weibull models give very mixed performances over rain regimes while the proposed model gives a more consistent performance when compared to measured data. Furthermore, results show conclusively that specific attenuation resulting from the proposed DSD model offers a greater fit to measured disdrometer data than the other models, while it also performs slightly better than the ITU model for specific attenuation.
REFERENCES
[1] G. O. Ajayi, and R. L. Olsen, "Modelling of a raindrop size distribution for microwave and millimetre wave applications," Radio Science, Vol.20, No. 2, 193-202, 1985 [ Links ]
[2] O. Adetan and T.J. Afullo, "Comparison of Two Methods to Evaluate the Lognormal Raindrop Size Distribution Model in Durban," In the Proceedings of the Southern Africa Telecommunications Networks Applications Conference, (SATNAC 2012), Fancourt, George, South Africa, September 2012.
[3] T. J. O. Afullo, "Raindrop size distribution modelling for radio link design along the eastern coast of South Africa," Progress In Electromagnetics Research B, Vol. 34, pp. 345-366, 2011. [ Links ]
[4] M. O. Ajewole: Scattering and attenuation of centimetre and millimeter radio signals by tropical rainfall. Ph.D. Thesis, Dept. of Physics, Fed. Uni. Of Tech., Akure, Nigeria, September 1997. [ Links ]
[5] F. D. Diba, T. J. O. Afullo. and A.A. Alonge, "Rainfall rate and attenuation performance analysis at microwave and millimeter bands for the design of terrestrial line-of-sight radio links in Ethiopia," SAIEE Africa Research Journal, Vol. 107, no. 3, pp. 177-186, 2016. [ Links ]
[6] Distromet Ltd., Distrometer RD-80 instructional manual, Basel, Switzerland, June 20, 2002.
[7] A. Tokay, A. Kruger, and W. F. Krajewski, "Comparison of drop size distribution measurements by impact and optical disdrometer," Journal of Applied Meteorology, vol. 40, pp. 2083-2097, 2001. [ Links ]
[8] UNEP: Rwanda from Post-Conflict to Environmentally Sustainable Development. Kigali-Rwanda. Nairobi: UNEP 2011.
[9] A. A Alonge. and T. J. Afullo, "Seasonal analysis and prediction of rainfall effects in eastern South Africa at Microwave Frequencies," Progress in Electromagnetics Research B, Vol. 40, pp. 279-303, 2012. [ Links ]
[10] S. Das, A. Maitra and A. K. Shukla, "Rain attenuation modelling in the 10-100 GHz frequency using drop size distributions for different climatic zones in Tropical India," Progress In Electromagnetics Research B, Vol. 25, pp. 211-224, 2010. [ Links ]
[11] M. Marzuki, W.L. Randeau, M. Schonhuber, V.N. Bringi, T. Kozu and T. Shimomai, "Raindrop size distribution parameters of disdrometer data with different bin sizes," IEEE Trans., Geosci., Remote Sens, vol. 48, pp. 3075-3080, 2010. [ Links ]
[12] P. Owolawi, "Derivation of one-minute rain rate from five-minute equivalent for the calculation of rain attenuation in South Africa," PIERS Online, Vol.7, No.6, pp 524-535, 2011. [ Links ]
[13] S. Marshall and W. Palmer, "The distributions of raindrop with size," Journal of Meteorology, 5, pp.165-166, 1948. [ Links ]
[14] C. W Ulbrich: "Natural variation in the analytical form of the raindrop size distribution," J. of Climate and Applied Meteor, vol. 23, pp. 1764-1775, 1983. [ Links ]
[15] M. Sekine and G. Lind, "Rain attenuation of centimeter, millimeter and submillimeter radio waves," Proc. of 12th European Microwave Conference, pp. 584-589, 1982.
[16] H. Jiang, M. Sano, and M. Sekine, "Weibull raindrop-size distribution and its application to rain attenuation," IEE Proc. Microw. Antennas Propag. Vol. 144, No. 3, 197-200, June 1997. [ Links ]
[17] O. Adetan and T.J. Afullo, "Three-parameter raindrop size distribution modeling for microwave propagation in South Africa," Proceedings of the International Association of Science and Technology for Development (IASTED), International Conference on Modeling and Simulation (Africa MS 2012), pp. 155-160, 2012.
[18] D. Sumbiri, Thomas J.O. Afullo and A. Alonge, "Modelling of Rain Drop Size Distribution for Microwave and Millimiter wave in Central Africa," Progress in Electromagnetic Research Symposium (PIERS), 2017 Singapore, pp. 2398-2404, 2017.
[19] G. Casella and R. L. Berger: Statistical inference. vol. 2, Duxbury Pacific Grove, CA, 2002.
[20] R. A. Fisher: On the mathematical foundations of theoretical statistics. Philosophical Transactions of the Royal Society of London. Series A, vol. 222, pp. 309-368, 1922. [ Links ]
[21] T. Tjelta, R.L. Olsen and A.L Martin, "Systematic Development of New Multivariable Techniques for Predicting the Distribution of Multipath Fading on Terrestrial Microwave Links," IEEE Transactions on Antennas and Propagation, Vol. 38, pp. 1650-1665 October 1990. [ Links ]
[22] D. C oko, I. Marinovic', "Experimental Verification of a Deterministic UWB Channel Model for Single Room Propagation Scenarios," International Journal on Communications Antenna and Propagation (IRECAP), Vol. 4, no. 2, pp. 37-43, 2004. [ Links ]
[23] G.O Ajayi, S. Feng, S. M. Radicella, B. M. Reddy: Handbook on Radiopropagation Related to Satellite communications in Tropical and Subtropical Countries (ICTP, Trieste, pp.7-14, Italy 1996).
[24] M. Odedina and T. Afullo, "Determination of rain attenuation from electromagnetic scattering by spherical raindrops: Theory and experiment," Radio Science, vol. 45, pp. 1-15, 2010. [ Links ]
[25] M.N.O. Sadiku, (2000): Numerical Techniques in Electromagnetics, 2nd edition, CRC press, pp. 96-103.
[26] A. A. Alonge: Correlation of rain dropsize distribution with rain rate derived from disdrometers and rain gauge networks in Southern Africa. M.Sc. Thesis, University of Kwa-Zulu Natal, South Africa, December 2011. [ Links ]
[27] A. Alonge and T. Afullo, "Rainfall Drop-Size Estimators for Weibull Probability Distribution Using Method of Moments Technique," SAIEE Africa Research Journal, 103(2), pp.83-93, 2012. [ Links ]
[28] ITU-R: Specific attenuation model for rain for use in prediction methods. ITU-R P.838-3, Geneva, 1992 - 1999 - 2003 - 2005.

Djuma Sumbiri received his Bachelor of Electronics and Communication Engineering and the M.Sc. degrees in Telecommunication Engineering from National University of Rwanda (now University of Rwanda), Butare, Rwanda, in 2009 and 2012, respectively. He obtained his PhD in Electronic Engineering from the University of KwaZulu-Natal in 2019. From 2012 to 2015, he was Lecturer and Head of Department of Electrical and Electronic Technology in the Integrated Polytechnics Regional Center (IPRC-SOUTH), Butare, Rwanda. He is currently a Post-Doctoral Research Fellow in the Discipline of Electrical, Electronic and Computer Engineering at University of KwaZulu-Natal, Durban, South Africa. His research interest includes digital and wireless communication, satellite communication, and microwave propagation.

Thomas J. O. Afullo (Student M'82-M'83-M'14-SM'18) received the B.Sc. (Hon) in Electrical Engineering from the University of Nairobi, Kenya (1979); the MSEE on a Fulbright-Hays Scholarship from West Virginia University, Morgantown, USA (1983); and the Bijzondre License in Technology and Ph.D. in Telecommunication Engineering from the Vrije Universiteit Brussel (VUB), Belgium (1989). From 1979 to 1986, he rose from rank of Pupil (Trainee) Engineer to Senior Executive Engineer in charge of transmission and radio planning with Kenya Posts and Telecommunication Corporation. From 1987 to 1994, he rose from the rank of Tutorial Fellow to Senior Lecturer and Head of Department of Electrical & Communications Engineering at Moi University, Eldoret, Kenya. From 1996 to 2002, he was Lecturer in Telecommunication at the Department of Electrical Engineering at the University of Bostwana, Gaborone. He joined the University of Durban-Westville as Associate Professor of Electrical Engineering in 2003. Since 2012, he has been Professor of Telecommunications Engineering in Discipline of Electrical, Electronic and Computer Engineering, University of KwaZulu-Natal (UKZN), Durban. He is also the Director of the Telkom Centre for Radio Access & Rural Technologies (CRART). He is a registered engineer with the Engineering Council of South Africa (ECSA), Fellow of the South African Institute of Electrical Engineering (SAIEE), and a rated researcher with the South African National Research Foundation (NRF). He was a member of Eta-Kappa Nu (Beta-Rho Chapter) in 1982; then became faculty advisor and member of IEEE-Eta-Kappa Nu (Mu Eta Chapter) from 2016. He has spent Sabbatical Leave with Prof. Emilio Matriciani and Prof. Carlo Riva at Politechnico di Milano (POLIMI), in 2017; with Prof. Rajarathnam Chandramouli at Stevens Institute of Technology, New Jersey, also in 2017; and at the Department of Electronics, University of Kaiserslautern, Germany, in 1996, on a DAAD Fellowship. He has successfully supervised 16 Ph.D. and 27 Masters students, as well as co-supervised 2 Ph.D. students. His research interests are in the area of Microwave and Millimeter-wave Propagation, Power Line Communications (PLC), and Free Space Optics (FSO).
1 This work was supported in part by the Telkom Centre of Radio Access & Rural Technologies (CRART), University of KwaZulu-Natal, Durban, South Africa.

