


Services on Demand
Article
 English (pdf)
 Article in xml format
 Article references
Indicators

Related links
-
 Cited by Google
 -
 Similars in Google
Share

 Permalink
SAIEE Africa Research Journal
On-line version ISSN 1991-1696
Print version ISSN 0038-2221
SAIEE ARJ vol.110 n.3 Observatory, Johannesburg Sep. 2019
ARTICLES
A Comparative Study on High-Voltage Spacer-Damper Performance and Assessment: Theory, Experiments and Analysis
Y.D. KubelwaI; A.G. SwansonII; D.G. DorrellIII; K.O. PapailiouIV
IIs with the FACTS/HVDC'VRTC Centre of the School of Engineering, University of KwaZulu-Natal, Private Bag X54001, Durban 4001. South Africa (e-mail:danielkubelwa2010@gmail.com)
IIIs with the FACTS/HVDC'VRTC Centre, School of Engineering, University of KwaZulu-Natal. Private Bag X54001, Durban 4001, South Africa (e-mail: swanson@ukzn.ac.za)
IIIIs with the FACTS/HVDC/VRTC Centre. School of Engineering, University of KwaZulu-Natal, Private Bag X54001, Durban 4001, South Africa (e-mail: dorrelld@ukzn.ac.za)
IVIs with the FACTS/HVDC/VRTC Centre, School of Engineering, University of KwaZulu-Natal, Private Bag X54001, Durban 4001. South Africa, (e-mail: konstantin@papailiou.ch)
ABSTRACT
This paper reports on the experimental analysis of commercially available spacer-dampers used to suppress wind induced Aeolian vibrations on transmission lines with bundle conductors. Three spacer-dampers w'ith different bushing-shaft designs, overall mass, and fabrication technology have been selected for this evaluation. Spacer-damper performances have been examined in a temperature-controlled testing facility by measuring their frequency and force-displacement response, in order to determine whether the bushing-shafting design meets the prerequisite to withstand the undesirable motions of the coupled sub-conductors. The tests showed that the hysteresis force-displacement test gives a better indication of an efficient spacer-damper and its energy absorption but is not consistent enough to describe the entire list of needed features against wind induced vibrations, i.e., its mobility or impedance, admittance and receptance vs. frequency. However, to investigate the working range of the spacer-damper in terms of the relative amplitudes between the frame and the arm of the spacer-damper, an analytical and experimental sensitivity model was developed. Analytically, the sensitivity models are based on the partial differential of an explicit dynamic model of the arm-rubber-frame and arm-rubber while the transfer functions have been experimentally established from the identification technique of force response frequency. In both approaches, the same conclusion was observed, although, analytically some assumptions have been made. In addition, a sensitivity analysis of the energy absorbed with variation of the ambient temperature was conducted during the hysteresis test.
Keywords: spacer-damper, bundk conductors, sensitivity analysis, frequency response, hysteresis tests
I. INTRODUCTION
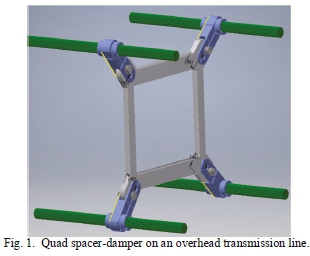
Spacer-dampers are often used in high voltage overhead transmission lines with bundled conductors in order to hold the sub-conductors at the prescribed distance and to mitigate vibrations due to wind [1]. The basic design of a spacer-damper consists of a rigid frame on which two or more arms are connected by means of a rubber bushing through a shaft. These arms are needed for coupling the sub-conductors, depending on the configuration of the bundle, i.e., twin, triple, quad, or more. The inertia and rotation of a rigid frame initiates two main modes, i.e. the breathe and the rigid modes [2]. In case a spacer-damper is not effective enough to suppress mechanical oscillations due to wind, these may affect the conductors and lead to their ageing, sometimes even their failure before their expected life time. Therefore, it is of great importance to make a better selection of the spacer-dampers than found in the market, i.e., improve their response to mechanical oscillation in addition to their electrical properties [1, 3-5]
For several decades, the growth of extra-high and ultra-high voltage (EHV-UHV) projects has led to a high demand for spacer-dampers worldwide. For instance, in the period between 2016 and 2025. Eskom has planned to expand its transmission line grid by about 8 000 km [6]. Although, spacer-dampers cost only about 1 % of the total project of power transmission line with bundle conductors, their premature ageing and even failure has very serious consequences on the reliability and operation on the line and can cause very high costs. Despite this, a comparison of the vibration performances of various spacer-dampers used in South Africa is lacking.
The performance of a spacer-damper depends on a combination of three mechanical elements: (i) a spring element (elastic), (ii) a damper element (frictional), and a mass element (inertia)[7). The first and third elements store energy while the second element dissipates energy Experimentally, the vibration performances of a spacer-damper may be assessed by using its frequency response and better, its hysteresis force-displacement loop [8]. The latter corresponds to the stress vs. strain response of a rubberlike material during the loading and unloading cycles. Hence, the sensitivity of a spacer-damper response to a vibration level is based on the stiffness of its rubber and damping properties due to interface friction [4]. Therefore, a sensitivity test of the spacer-damper with respect to the vibration velocity is required in order to find the working range of the spacer-damper, an important factor for their optimization in bundle conductors. As an analogy to a control system using Bode sensitivity analysis [9], spacer-damper tests should consider the force (input) and the velocity (output) at small and high constant displacement. The variation between those displacements can be considered as a small perturbation of the system. However, on the standalone testing of spacer-damper, the analysis of the sensitivity can be helpful in the design optimization of different design parameter such as mass of component and choice of rubber-shaft.
Sensitivity analysis has been used for some time in many applications such as for the validation of models, e.g., genetics, social sciences and engineering optimization techniques, and design performance studies [10-17], Sensitivity results provide a knowledge of a design parameter, for instance, a parameter that the most influential and/or the one which needs improvement [16]. From an engineering point of view, there are two approaches that may be used for sensitivity analysis: analytical and empirical methods. For a complex structure, the use of statistics, i.e., correlation [18] and modal assurance criterion in the modal analysis [19, 20], in lieu of a sensitivity model analysis, is advised.
To develop a sensitivity analysis, an analytical model is required in the form of an explicit function so that its partial differential with respect to a parameter gives the yielded sensitivity. In the development of a spacer-damper, the design specifications and the wind input related parameters are included. These include the overall mass, mass of the rigid frame, mass of the arm, damping and stiffness of the rubber-shaft, arm initial angle, and relative amplitude between arm and frame. These must be considered in the governing equations.
Six decades ago an interesting paper [8] described various relevant tests regarding the performance analysis of a rubberlike material from a frequency response and a hysteresis test. Temperature was highlighted as one of the factors that impacts on the damping behaviour of rubber-like materials. In addition, the test procedures presented in [3] can be classified into two types with regard to their responses; i.e., the frequency response and the step response performed by means of special testing machines.
In this paper, sensitivity analysis of spacer-damper initial conditions and design parameters are experimentally investigated for three different spacer-dampers[21]. Several analytical sensitivity models are introduced, discussed and compared with other models using previous research [22, 23]. These are similar to the current investigations here. The sensitivity of the ambient temperature in the performance of the spacer-damper is also addressed. Two experimental methods are used to analyse the damping performance of three different spacer-dampers labelled. In the first, frequency response tests are performed with a shaker within the frequency ranges of the Aeolian vibrations (5-75 Hz), while for the second method, force-displacement response tests are performed using a hysteresis test machine. In addition, transfer functions of the spacer-dampers, as investigated as mathematical models, are developed using the MATLAB® system identification toolbox. The present study aims to contribute to the actual spacer-damper knowledge by adding to the best practice on their selection, as found in the relevant IEC standard [24].
II. Sensitivity analysis theory
A. Governing equation
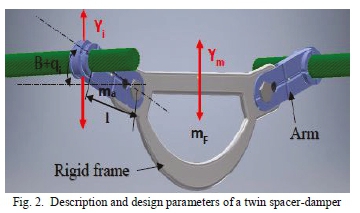
Let the arm-frame be modelled from one side of a twin spacer-damper. This gives one arm and the rigid frame as shown in Fig. 2. The design parameters for the spacer-damper involve: mass of the frame (mf), mass and the length of the arm (maand I), and the initial angle between the arm and the horizontal (B). These parameters are relevant to the sensitivity of the spacer-damper when dissipating energy induced by the wind. To describe an analytical sensitivity model, the damping-stiffness-mass model of the spacer-damper attached to the conductor is used in such way that all parameters of interest are included in the model. The governing model equations obtained from Figs. 3 -1 and 3 - III and have been developed in [22, 23], and Fig. 3 - II is a model that fits into the current investigation where the frame is rigidly clamped. Analytically, and for the sake of significance analysis, the model is compared to other relevant analytical models.

In Model I, the mass of the arm and sub-conductor stiffness is not considered. Referring to the simplified analytical model of a spring oscillator [22], the system is
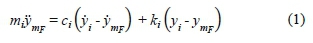
where: y , y , and y are the amplitude, velocity, and acceleration of the frame of the SD, respectively; y. ý , and y are the amplitude, velocity and acceleration of the SD arm, respectively; ciand ktare respectively the damping and the stiffness of the system bushing-shaft system, and miis the mass of the oscillation system. This gives a system for a spacer-damper whereby there is relative motion between the rigid frame and the arm.
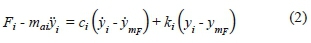
The left side term mjymof (1) is equal to the transmissivity force, which is given by the force induced by the wind F minus by the inertia force of the SD arm majya. Consequently, (1) becomes
In order to develop a model that contains all the parameters of interest, such initial angle Β (offset) and arm leg I, let the amplitude described by the arm at its clamp be expressed by generalized coordinates so that

where I is the length of the SD arm; Β is the initial angle of the arm; and q is the angle variation with respect to time. This investigation uses wind induced Aeolian vibrations (575 Hz) that are characterized by high frequency and small amplitude. The arm and the frame of the spacer-damper undergo a relative motion from each other, which can then be regarded as a rotational motion of the arm with respect to its shaft axis. Therefore, it can be assumed that the variable angle q defined by generalized coordinates and with respect to the time is too small q « 0, which implies that:
The displacement yi(3), the velocity, yi and the acceleration y can be written as
The input force and the SD arm can both be assumed to be subjected to sinusoidal motion. Between excitation and the final receiver there is a phase shift angle Θ. The governing equation can be developed in term of the displacement of the rigid frame Ymin equation (2):

By separating the real and imaginary parts (6), the real part of Ymis

The imaginary part is
In the standalone test of the spacer-damper as reported in the standards, the frame is rigidly fixed on a stand-table as illustrated in Fig. 5. In addition, the SD arm must be in an orthogonal position with respect to the vertical axis of the shaker. Consequently, the inertia force of the rigid frame and amplitudes are equal to zero as well as the arm's initial angle. In lieu of (6) as the governing equation, the transfer function was developed for more refined analysis:


where s is the imaginary of the angular velocity ay. Alternatively, and based on (1), a transfer function can be developed, given that the transitivity between the amplitude as recorded at the arm and the rigid frame, by referring to Figure 3-I, where

If the spacer-damper was attached to the conductor, the resultant system may be modelled as a double layer vibration suppression bilinear system as given by Fig. 3-III. The transfer function can be expressed as

where D(s) is the denominator of the transfer function in (11) and is given by

ki represents the conductor dynamic stiffness that depends on the stiffness and the conductor tension of the conductor.
B. Analytical sensitivity model for the initial condition of spacer-damper design parameters
The sensitivity is by definition a partial derivative of the function in which the parameters of interest are evaluated independently or combined. Several analytical sensitivity models have been developed in the Section 2.1 from different governing equations in order to compare the significance in the use of each model of the conductor-arm-frame, arm-frame and arm system. The absolute sensitivity of a function V to variations in the parameters is

where V represents any explicit function and a is the variable for which the sensitivity has being evaluated. In this paper, sensitivity scenario analyses have been evaluated for all damping models excepted for Model III as defined by (11) in the Section 2.1. This is because investigations have been conducted on the Model II scenario and a significance comparison evaluation carried out.
1) Sensitivity of the initial angle variation in a spacer-damper
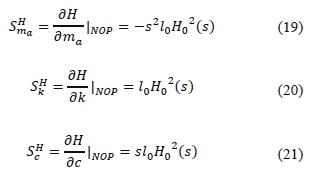
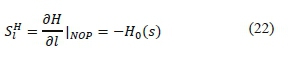
The sensitivity of the arm's initial angle has been discussed in terms of the real part of the transfer function given by (7):

Since, the variation of is a part function of the arm offset angle B, it is better to find the sensitivity of the combination of <Qi and Β as their combined partial differential of (7) so that

2) Sensitivity of mass, stiffness and damping in spacer damper Model I.
From the governing equation (10), the sensitivity to the variation of the mass, stiffness and damping factors in a spacer-damper are given by

and,
3) Sensitivity of mass, stiffness and damping in spacer damper Model II.
Model II is given in Fig. 3-II whereby the arm of the spacer-damper is represented by a mass-spring-dashpot with the last two element in parallel. This model is given the scenario that the frame is rigidly clamped and the arm is rotating in a circular motion, which is described in (10). The sensitivity with respect to the mass, stiffness, damping and the length of arm can be given by:
and
C. Analytical sensitivity model to initial condition of ambient temperature
The principle of the damping in the rubber-like material goes through the temperature variation to absorb a certain amount of energy. As such, the governing equation is given by (23) and described in [23] in term of the final temperature in the rubber-like material Tfinal. This is reached during the run cycles and can be simulated using:

where,
Τ initial is the initial temperature,
f is the frequency of the loading,
R is the thickness of the rubber,
Κ is the heat conduction of the rubber,
Eais is the amount of energy absorbed.
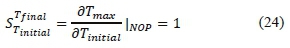
The absolute sensitivity of the final temperature Tfinalto the variation of the initial temperature Tinitialof the rubber-like material is obtained from (24). In addition, the sensitivity of the final temperature with the variation of the vibration frequency / is elaborated as equation (25):
and

Equation (24) show that the final temperature absolutely depends on the initial temperature that may be close to ambient temperature. Since the energy to be absorbed and dissipated are the most relevant features that influence the selection of the rubbers, (23) must be expressed accordingly. Alternatively, (23) becomes (26) after variable manipulation:

Hence, the sensitivity of the energy absorbed in the rubber in the variation of the initial temperature and the final temperature are equal as given by (27):

and
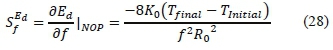
(27) and (28) show there is dependency on the variation to both frequency (cycles per time) and the temperature [25-27]. The sensitivity shows that the rubber can absorb a large amount of energy, unless the working frequency is below 1 Hz.
III. EXPERIMENTAL APPROACH
A. Spacer-damper descriptions
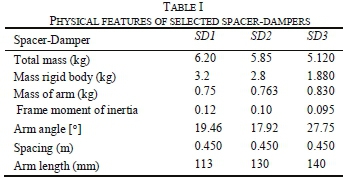
Three types of spacer-dampers are used in the present investigation: i) SD1, ii) SD2 and iii) SD3. They are characterised by their different bush rubber-shafts. The geometry of the annular rubber bushing (i.e., round, ellipsoidal, etc.) is found in Table I. These can be bonded with the aluminium sleeves of the rigid frame.
1) Spacer-damper SD1
The design of SD1 is given by a double ellipsoidal bushing coupled on both sides of a T-like beam (arm) to a fork part of the rigid frame with a round shape shaft. Fig. 4 is an illustration of SD1 bushing-shaft system; i.e., labels: (1) the part of the rigid frame, (2) the bushing and (3) the shaft.
The damping performance of this damper is mainly guaranteed by the torsion of the rubber halting in each side of the arm axis and in the rigid frame. However, the stiffness (radial and torsional) is based on the friction aluminium-rubber between; i.e., (i) the outer surface of the bushing and both sides of arm and rigid frame, (ii) the inner surface of bushing and the shaft, and (iii) the lateral sides of the rubber and both sleeves of the arm and the rigid frame.
2) Spacer-damper SD2
The bushing-shaft system of SD2 is given in Fig. 5 below by: (i) a cylindrical rubber hafted in the sleeve of the arm and (ii) a squared tube shaft punched in a diamond shape inside the rubber. The damping performance is given by the rotational and radial force exerted by the four edges of the shaft radii on the rubber. Radial and torsional stiffness are assured by the friction rubber-aluminium between: (i) the outside surface of the rubber and sleeve of the arm, and (ii) the four edges of the shaft and the rubber. The arm is designed as a T-like beam.
3) Spacer-damper SD3
Both the bushing and the shaft (tube) of SD3 have the ellipsoidal shape as per Fig. 6 and the arm is a combination of both h-like and T-like beams. Compared to SD1 and SD2, SD3 has a bigger friction surface between bushing-sleeve of the arm and bushing-shaft. The force of the arm is exerted on both sides of the shaft which imparts a force onto the bushing as opposed to SD1 and SD2, which imparts a force from the bushing to the shaft.

B. Experimental methods 1) Frequency response
The spacer-damper is mounted in such way that its arm is perpendicular to the vertical bars of the jig. Its frame must be rigidly tightened to avoid relative motion of the arm. The experiments were carried out using an electrodynamic shaker directly attached to the arm of the spacer-damper while its frame was rigidly tightened to a table shown in Fig. 7. The jig consists of the lower body base with two columns encompassing each a force transducer and an upper rigid crosshead, as shown in Figs. 8 and 9.


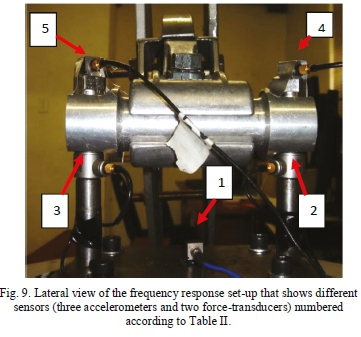
Four accelerometers, symmetrically positioned on the outer surface of the bushing, measure the motion of the bushing. These different signals were conditioned in an amplifier. This had sufficient channels for the inputs that were processed afterwards with a computer.
Experiments were carried out at a constant shaker velocity from 50 mm/s to 100 mm/s, while the frequency response was evaluated for matching the ratio between the measured displacement and force (jig and spacer-damper). The frequency response is expressed in dB rad/N with respect to the ratio between the angle rotation of the arm and its corresponding excitation force.
2) Force-displacement response
In this test, an arm of a spacer-damper undergoes a force-displacement test at a constant frequency of about 0.2 Hz (before fatigue) and 0.35 Hz (after 16><105 cycles), with a constant displacement of around 23 mm in both cases. A spacer-damper is thus installed on the hysteresis table in such a way that the arm tested is orthogonal to the excitation bar of the test machine in Fig. 10. The rotating movement of a disc is converted into a translation motion of the excitation bar.

From the data acquisition computer programme, the graph of force vs. displacement in real-time is plotted once the cycle is completed. To minimise uncertainties in the data results, each measurement was repeated more than ten times for each arm. The cycle of the energy absorbed in the bush rubber is calculated using a trapezoidal integration model as shown in Appendix A.l.
During set-up, the spacer-damper must be mounted in such way that its arm is orthogonal to the excitation bar of the hysteresis machine. In order to significantly reduce uncertainties, which often arise in testing of a rubber-like material [28], each arm underwent at least six repeated measurements. However, these repeated measurements were performed over an intermittent test period to allow the rubber to cool down in order to maintain acceptable results.
C. System identification of spacer-damper response
1) Application to the current investigation
The objective was to develop a mathematical model that describes the dynamic behaviour of the different spacer-dampers: SD1, SD2, and SD3. As such and having sufficient input and output data, as per proposed procedures in Section 2.2.1, a transfer function (TF) is better suited mathematically to represent the dynamic response of a system. The estimation of different parameters was obtained using the z-transform of periodograms of the sampled signals over finite intervals [29],
G(s) is given by the following expression:

where:
an= Denominator coefficient, na = 0, 1,2..., η
bnb = Numerator coefficient, nb = 0,1,2,...,n
na = Exponent of ζ in the denominator
nh = Exponent of ζ in the numerator
with nb < nabecause of strict causality conditions [30], Fig. 11 shows the measurement principle of current investigation of the damping and stiffness of each spacer damper. The noise at the output was suppressed using an aliasing filter implemented in the controller and measurement system. To develop a TF for the spacer-damper system in this context, system identification based on parameter estimation in the frequency domain is used. Several researchers have concluded that this approach is consistent when compared to the asymptotic-based approach [31, 32].

2) Implementation in MA TLAB®
The system identification toolbox within MA TLAB® [33] is used to determine the TF of different bushing-shaft responses of spacer-dampers SD1, SD2, and SD3. This predefined user toolbox was explored in the frequency domain since the measurements have been performed in the same domain. The input is the force u and the output is the amplitude y (which may be displacement at constant velocity) in frequency domain f.
The u, y and f variable ranges are entered in the dialog box which is used to import the data and the domain type; for this, a sampling interval Δ* is required. Since the data collection is performed using the frequency-sweep technique, hence the sampling intervals have to be determined from

where: ffinal = final frequency Hz; finitial = initial frequency Hz; and ts = sweep time in second.
The sweep time tsis considered in a way that Δs gives a minimum of three sample points per minute, which is in line with several manufacturers of data acquisition systems.
IV. EXPERIMENTAL RESULTS
A. Frequency response results
The measurements were recorded at least three times for each value at constant velocity or displacement of the shaker in order to minimize errors. In general, the standard deviation (MSE) was about 20 %, which is understandable because of the properties of the rubber. Figs. 12, 13 and 14 show the receptance and phase vs. frequency of the spacer-dampers SD1, SD2, and SD3 measured at different constant velocities; i.e., 50, 60, 80, and 100 mm/s. The compliance is expressed in dB rad/N and is obtained from the ratio between the force and the rotational angle in radians. Since the spacer-damper works in both radial and vertical directions, in order to evaluate the performance of the spacer-dampers, the rotational angle of each spacer damper gives a different response since they have a different initial angle and bushing-shaft system (shape, damping and friction mechanism, and arm length).


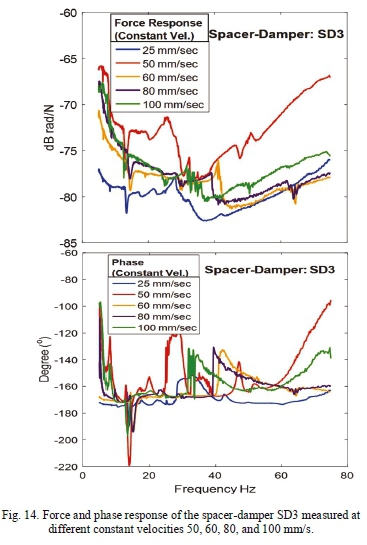
At the frequency between 5-15 Hz, the FRF response measured for SD1 and SD2 varies sharply between 5-15 dB for a range of frequencies. It appears that the sensitivity to the initial conditions for SD1 is greater than SD2 in terms of varying nonlinearly for frequencies below 15 Hz. They become steady curves and parallel to the frequency axis. The stiffness at each measured constant velocity in SD3 varies nonlinearly with respect to the frequency at many points of convergence. By analysing the phase shift angle associated with the inverse rotational stiffness, it was observed that there were no significant differences in the phase angle shift for all velocities measured at frequencies up to 45 Hz. The compliance response for SD3 shows that there is a gap before the stiffness or elasticity starts appearing in the sleeve coupling (rubber and shaft). This was observed during the hysteresis testing of SD3 in Section 4.2. The test at 25 mm/sec was only done on SD3 as it was impossible to do this for SDl and SD2.
Β. Hysteresis force-displacement response results
The tests on the hysteresis force-displacement closed loop were performed in a constant temperature environment since the energy absorbed in a rubber material is based on transformation of the mechanical energy to heat energy. The ambient temperature of the laboratory is a significant factor that must be considered during the test, and was recommended. This was maintained at 21°C for the purpose of minimizing uncertainty and giving confidence in measurements as suggested by most sensor manufacturers. Fig. 15 shows results of hysteresis force-displacement response measured at a constant frequency 0.2 Hz and at a maximum displacement amplitude of about 23 mm for SD1, SD2 and SD3. The displacement varied due to slightly different arm angles around the excitation bar, which is recommended to be 90°. This displacement variation is recorded in an overall comparison (section V.A) in Tables VIII, IX and X with no significant standard error (SSE); i.e., about 0.5 %, for more than 30 tests have been performed for each SD arm.
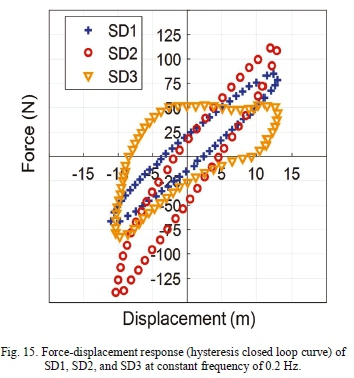


Consequently, SSEs of the total energy absorbed are between 10 and 20 %. This is understandable given the behaviour of the rubberlike material; the losses in energy are nonlinear and described in Fig. 15.
V. COMPARISON AND DISCUSSIONS
A. Analysis of response plots
Figs. 16, 17, and 18 show that the force responses for SD3 at different constant velocities are, in general, converging when compared to the responses for SD1 and SD2. The energy absorbed in SD3 is higher, followed by SD2 and then SDL.


The performance analysis of spacer-dampers SD1, SD2 and SD3 were evaluated in the receptance as dB in relation to the reference level given in Appendix A.l. This process allows for the noisy signal of the input-output response to be filtered. Hence, the receptance response in dB given by equation
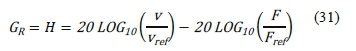
where ν is the measured velocity, and F is the measured force.
Figs. 16, 17 , and 18 show the receptance and phase-angle measured at constant displacements (peak-to-peak) of 0.2 mm and 0.5 mm for spacer-dampers: SD1, SD2 and SD3. With reference to sensitivity from identification technique, the results in Figs. 16 and 17 show that SD1 and SD2 are significantly more sensitive to small variations of displacement at about 0.3 mm compared to SD3, which appears to be constant. This analysis may be made by comparing the different slopes of the responses of investigated SDs in Figs. 13 and 14. The slope of SD3 remains unchanged when the displacement varies from 0.2 to 0.5 mm. On the other hand, SD3 dissipates large amounts of energy at about 1551.5 Nmm compared to SD1 and SD2 respectively, which are 618.4 and 975.4 Nmm.
Β. Estimated transfer function
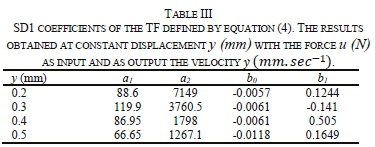
From the data used to plot Figs. 16, 17 and 18 describing the signature of dynamical response of the spacer-dampers investigated, the TFs can be identified. The tstimes are the same for all the tests performed and for all samples i.e., sweep time tsis about 1800 s and the testing frequency from 5 to 75 Hz. This implies that for tsthere are 0.039 points/sec. In this context and for all investigated SDs, the parametrization gives two poles and one zero:

with a0 = 1 (always) and bo is the gain of the system.
The coefficients of different SDs are given respectively in Tables III, IV and V using the system identification toolbox MATLAB®. In general, the fit-to-estimate ranges between 55 and 70 % with very small values of final prediction error (FPE) and mean square error (MSE); both are in the range of being less thanlO5. Comparing the transfer function in (32), which is associated with the theory developed in Section 2.1, and, in reality, should correspond to Model II (Fig. 3-II), the inverse model given by (32) from experimental data matches (10) from the theory in Section 2. A. This might be a result of residue values and errors that have been generated during the experimental process which can be explained by the small value of the factor b0and bi observed in all different data given in Tables III, IV and V.
1) Absorbed power, natural frequency damping ratio
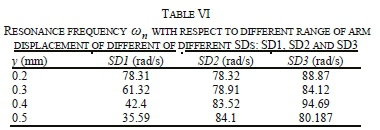
Since the TF is defined by a numerator with one zero and a denominator with two poles, it is straightforward to evaluate important parameters characterizing each spacer-damper. For instance, the zero characterizes the amount of an equivalent power Eaabsorbed by the rubber-shaft system, while from the poles, the natural frequency ωηand the damping ratio ζ of the global stiffness can be determined. These parameters can be evaluated using the TF in equation (33) so that:

where ωηand fare estimated from the denominator of the TF since it contains two poles.
Tables VI and VII give different ωηand ζ which are determined using (5) at different ranges of displacement of the arm. These results show that for ωη„ decreases when the displacement increases for SD1, whilst this parameter is almost constant in SD2 and SD3. (is almost constant for SD2 as observed and fluctuating in SD1 and SD3. This may be justified by the design of the rubber bushing in SD2 that is in four parts making a cylindrical shape with a gap between which allows ventilation and reduction of temperature in the rubber (working principle). The frequency response tests were performed in a continuous regime of about 1800 s which had a significant effect on the temperature variations. In addition, SD2 has a smaller frictional surface contact compared to those in SD2 and SD3, which is a source of non-linearity as observed in the different Rvalues
2) Overall comparison
An overall comparison is given in Tables VIII, IX and X, in which the relevant parameters of SD1, SD2 and SD3 have been given before and after two cycles. The radial stiffness corresponds to the average of those plotted as compliance in the Section 4.1. The energy Eaabsorbed before and after 16χ105 cycles, the loss of performance, and the sensitivities to the working range in SD1, SD2 and SD3, are compared. As per IEC standards [23], the full fatigue test was done at a displacement of 0.2° (Fatigue cycle) at 20 Hz for about 10s cycles. This is only 1.6 % of the expectancy life of the spacer-damper. Hence, referring to [34] the fatigue cycles correspond to a 50 years life cycle, which implies that 1.6 % is equivalent to a 0.8 year life cycle. These numbers of cycles represent the design of the damping mechanism in SD3 which allows a considerable quantity of energy to be absorbed when compared to SD1 and SD2. The loss in SD3 is about 30.4 % after 16 χ 105 cycles, as observed, while it is much smaller in the SDs SD1 and SD2 at around about 14 and 13.6 % respectively.
Comparing the data obtained from the manufacturer with the actual data results, the only available data are the initial angles (offset) given in Table I (Section 3.1). It was noticed that a gap value between the manufacturer and this investigation are respectively off by about 31.7,17.4 and 16.1 %for SD1, SD2 and SD3.
The parameters of the spacer-dampers SD1, SD2 and SD3 as given in Tables VIII, IX, and X were calculated using the following expressions:
- Energy absorbed Eadefined by the area within the loading and unloading part the curve using the trapezoidal rule in MATLAB®:

and trapz denotes the trapezoidal rule for the loading and the unloading parts of the curve. Further:
where F and D: are the force and the displacement measured during the hysteresis test.
Radial stiffness kt.

3) Global sensitivity in different spacer-damper dynamic models
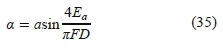
The global sensitivity was determined using the statistical regression approach [35] in a simple way by finding the frequency AFtthat corresponds to the zero response for a different constant displacements 7,. Therefore, the extreme values of the response at constant displacement, i.e., H0.2™ and Ho 5mm, have been considered as per Figs. 16 and 17. The global sensitivity (relative based) is given in Table 11, in which SD1 was found the most sensitive (44.54 %) followed by SD2 with 37.7 % and then no variation at all in SD3.

4) Sensitivity analysis to ambient temperature during hysteresis tests
Experimentally, the temperature variation in the different rubber design was measured using a laser-thermo-camera. For the data collected, the measurements were performed more than three times for the same scenario. Fig. 19 and Table 12 give the different temperature measurements at the initial and final states (after a couple of cycles) in the rubber of SD1, SD2 and SD3. In Table 12, the predicted final temperatures from (23) are given along with the ambient temperature.


The final temperature was calculated using (23) using the numerical values from the experimental measurements and the average initial temperature value, the average energy absorbed Ea, a frequency of about 0.35 Hz, the equivalent thickness of the rubber, and the standard thermal conductivity of the rubber K, which is about 240 W/mm°K. Consequently, a discrepancy was observed between the measured and the predicted final temperature in the rubber.
This may be due to several factors such as:
- The assumption taken in the estimation that the rubber thickness is a plane shape; finite element analysis is required for better results.
- The measurements with the infrared camera were taken at different locations with no easy access and using a rubber emissivity of about 0.95 (which varies between 0.850.97). There is lack of an accurate emissivity value from the supplier of the spacer-damper;
- Accumulation of different uncertainties from different measurements.
VI. CONCLUSIONS
This paper illustrates that the selection criteria for a spacer-damper should include the sensitivity response to frequency and force-displacement. Sensitivity could be a significant parameter not only in the spacer-damper optimisation, but also in the improvement of its existing design. The sensitivity evaluation shows that there is a significant frequency effect on the damping features of the rubberlike bushing for different temperatures.
Comparison of the vibration performances of available spacer-dampers in South Africa shows that their capacity in absorbing energy resides in the design of the rubber bushing and the arm length. The latter has to be designed in a way that its impedance reduces the frequency received from the wind to less than 1 Hz at the bushing rubber in order to enable effectively absorption of energy. However, this present study has examined only the damping and the stiffness factor performance and did not consider the inertia implication of the rigid frame. The damping model was studied for one arm and rigid frame of the spacer-damper as if it was independent from the rest of the arms.
Further studies, which should take the inertia of the spacer-damper into account in vibration performance, should follow, together with study of the inverse problem to allow for active control, using, for instance, the transfer matrix approach [36] to implement the single dynamic model of representation arm and frame in the spacer-damper by taking into account also the synchronization of all arm inputs into the spacer-damper-conductor system.
ACKNOWLEDGEMENT
This project was in part funded by ESKOM through EPPEI and the VRTC centre. The authors express their gratitude to EPRI (USA), Pfisterer SA and Mr Pravesh Moodley (VRTC) for their technical support.
REFERENCES
[1] H. J. Houston, K. D. Bolt, A. Gretzinger, and R. G. Baird, "Spacer-damper assembly," ed: Google Patents, 1975.
[2] L. Cloutier, A. Manenti, and G. Diana, "State of the art survey on spacers and spacer dampers," Electa, vol. 209, 2005. [ Links ]
[3] M. Foata and D. Noiseux, "Computer analysis of the effects of asymmetries of a two-conductor bundle upon its aeolian vibration," IEEE Transactions on Power Delivery, vol. 6, pp. 1132-1138, 1991. [ Links ]
[4] C. Hardy and P. Bourdon, "The Influence of Spacer Dynamic Properties in the Control of Bundle Conductor Motion," IEEE Transactions on Power Apparatus and Systems, vol. PAS-99, pp. 790-799, 1980. [ Links ]
[5] F. Foti, L. Martinelli, and F. Perotti, "A parametric study on the structural damping of suspended cables," Procedia engineering, vol. 199, pp. 140-145, 2017. [ Links ]
[6] Eskom, "Transmission line development plan 2016-2025," in ESkom, Ed., ed. Megawatt Park Maxwell Drive Sunninghill Sandton PO Box 1091 Johannesburg 2000 SA: Eskom Transmission Group, 2015, p. 106.
[7] A. Edwards and J. Boyd, "Bundle-Conductor-Spacer Design Requirements and Development of "Spacer-Vibration Damper"," IEEE Transactions on Power Apparatus and Systems, vol. 84, pp. 924-932, 1965. [ Links ]
[8] J. H. Dillon and S. D. Gehman, "Hysteresis and Methods for Its Measurement in Rubberlike Materials," Rubber Chemistry and Technology, vol. 20, pp. 827-858, 1947. [ Links ]
[9] T. Atsumi and W. C. Messner, "Modified Bode Plots for Robust Performance in SISO Systems With Structured and Unstructured Uncertainties," IEEE Transactions on Control Systems Technology, vol. 20, pp. 356-368, 2012. [ Links ]
[10] M. Alfano, G. Lubineau, and G. H. Paulino, "Global sensitivity analysis in the identification of cohesive models using full-field kinematic data," International Journal of Solids and Structures, vol. 55, pp. 66-78, 2015. [ Links ]
[11] S. Avril, M. Bonnet, A.-S. Bretelle, M. Grédiac, F. Hild, P. Ienny, et al., "Overview of identification methods of mechanical parameters based on full-field measurements," Experimental Mechanics, vol. 48, p. 381, 2008. [ Links ]
[12] H. Christopher Frey and S. R. Patil, "Identification and review of sensitivity analysis methods," Risk analysis, vol. 22, pp. 553-578, 2002. [ Links ]
[13] C. Farhat and F. M. Hemez, "Updating finite element dynamic models using an element-by-element sensitivity methodology," AIAA journal, vol. 31, pp. 1702-1711. 1993. [ Links ]
[14] J.-C. Passieux, F. Bugarin, C. David, J.-N. Périé, and L. Robert, "Multiscale displacement field measurement using digital image correlation: Application to the identification of elastic properties," Experimental Mechanics, vol. 55. pp. 121-137, 2015. [ Links ]
[15] A. Saltelli, K. Chan, and E. M. Scott, Sensitivity analysis vol. 1: Wiley New York, 2000.
[16] E. D. Smith, F. Szidarovszky, W. J. Karnavas, and A. T. Bahill, "Sensitivity analysis, a powerful system validation technique," The Open Cybernetics & Systemics Journal, vol. 2, 2008. [ Links ]
[17] H.-P. Wan and W.-X. Ren, "Parameter selection in finite-element-model updating by global sensitivity analysis using Gaussian process metamodel," Journal of Structural Engineering, vol. 141, p. 04014164, 2014. [ Links ]
[18] J. H. Steiger, "Structural model evaluation and modification: An interval estimation approach," Multivariate behavioral research, vol. 25, pp. 173-180, 1990. [ Links ]
[19] R. J. Allemang, "The modal assurance criterion-twenty years of use and abuse," Sound and vibration, vol. 37, pp. 14-23, 2003. [ Links ]
[20] M. Pastor, M. Binda, and T. Harcarik, "Modal assurance criterion," Procedia Engineering, vol. 48, pp. 543-548, 2012. [ Links ]
[21] Y.D. Kubelwa, AG. Swanson, D.G. Dorrel, and K.O. Papailiou, "Experimental evaluation and comparative analysis of Extra-High and Ultra-High Voltage Spacer-Dampers used on South African Overhead Lines," in 26th Southern African Universities Power and Engineering Conference (SAUPEC 2018), University of the Witwatersrand, Johannesburg, South Africa, 2018.
[22] L. Li, H. Cao, Y. Jiang, and Y. Chen, "Experimental Study on Mitigation Devices of Aeolian Vibration of Bundled Conductors," Advances in Structural Engineering, vol. 16, pp. 1557-1565,2013. [ Links ]
[23] J. Wang, D. Sun, S. Liu, and X. Zhang, "Damping Characteristics of Viscoelastic Damping Structure under Coupled Condition," Mathematical and Computational Applications, vol. 22, p. 27, 2017. [ Links ]
[24] IEC, "Overhead lines - Requirements and tests for spacers," in TC 11 - Overhead lines, ed: IEC 61854, 1998, p. 81.
[25] A. Schallamach, "The Velocity and Temperature Dependence of Rubber Friction," Proceedings of the Physical Society. Section B, vol. 66, p. 386, 1953. [ Links ]
[26] N. Myshkin, M. Petrokovets, and A. Kovalev, "Tribology of polymers: adhesion, friction, wear, and mass-transfer," Tribology International, vol. 38, pp. 910-921, 2005. [ Links ]
[27] W. Brostow, H. E. Hagg Lobland, and M. Narkis, "Sliding wear, viscoelasticity, and brittleness of polymers," Journal of Materials Research, vol. 21, pp. 2422-2428, 2011 [ Links ]
[28] R. Kanapady and R. Adib, "Applications of modeling and simulations with probabilistic method to predict reliability at high confidence level," in 2010 Proceedings - Annual Reliability and Maintainability Symposium (RAMS), 2010, pp. 1-6.
[29] T. Lobos, Ζ. Leonowicz, J. Rezmer, and P. Schegner, "High-resolution spectrum-estimation methods for signal analysis in power systems," IEEE Transactions on Instrumentation and Measurement, vol. 55, pp. 219-225, 2006. [ Links ]
[30] M. Hautus and M. Heymann, "Linear feedback-an algebraic approach," SIAM Journal on Control and Optimization, vol. 16, pp. 83-105, 1978. [ Links ]
[31] K. J. Aström and P. Eykhoff, "System identification-a survey," Automática, vol. 7, pp. 123-162, 1971. [ Links ]
[32] B. Wahlberg, "System identification using Laguerre models," IEEE Transactions on Automatic Control, vol. 36, pp. 551-562, 1991. [ Links ]
[33] L. Ljung, System Identification Toolbox 7: Getting Started Guide: The MathWorks, 2008.
[34] T. IEC, "60826 Designing criteria for overhead transmission lines," ed: IEC, 2003.
[35] B. Sudret, "Global sensitivity analysis using polynomial chaos expansions," Reliability engineering & system safety, vol. 93, pp. 964-979, 2008. [ Links ]
[36] A. Jamaleddine and J. Rousselet, "Generalized stiffnesses of spacer-dampers for two-conductor bundles," Electric Power Systems Research, vol. 10, pp. 125-135, 1986. [ Links ]

Yatshamba Daniel Kubelwa was born in Democratic Republic of Congo and has more than 10 years of experiences in High voltage engineering. He is currently completing his Ph.D. in Electrical Engineering at the University of KwaZulu-Natal, where he obtained his M.Sc. in Mechanical Engineering. He graduated from the University of Lubumbashi (D.R. Congo) with a Bachelor of Applied Science, and later, he earned a Bachelor of Science in Electromechanical Engineering. His doctoral Research entitled: "Experimental and Numerical Studies of Aeolian vibrations of transmission line with Bundle conductors", research proposed and sponsored in part by the Electrical Power Research Institute from USA (EPRI). Since 2014, He is a facilitator/Lecturer in Engineering Design Aspect of Transmission line Course at TSK Training Centre in South Africa.
He has received more than five awards (international), with as the most recent in 2016, the "best paper award" from International association of Engineers at the London Conference (UK). He was recently invited to Morocco as a keynote speaker at the ICCSRE 2018 (International Conference Computer Science and Renewable Energies). He is registered with the Congolese Body of professional engineers (ASIC). His research interests include high voltage engineering, Aeolian vibration of power lines, and design aspect of power lines, maintenance and investigation of unknown faults in electrical power systems.

Andrew Swanson obtained his electrical engineering degrees of Β Sc, MSc and PhD from in the University of the Witwatersrand in 2004, 2007 and 2015 respectively. He is currently a senior lecturer at the University of KwaZulu-Natal and a professionally registered engineer. He has worked in industry as an engineering consultant on railways. He is currently responsible for research in the field of high voltage engineering and is interested in insulation for transformers, gaseous insulation and electromagnetic interference. He has a number of industrial collaborations.

David Dorrell is a native of St Helens, UK, and has a PhD degree from The University of Cambridge in Engineering (1993). He is currently Professor of Electrical Machines with The University of KwaZulu-Natal (UKZN) in Durban, South Africa, a post he took up in late 2015. He is also Director of the EPPEI Specialization Centre on HVDC and FACTS at UKZN. He has held lecturing positions with The Robert Gordon University, Aberdeen, UK and The University of Reading, Reading, UK. He was a Senior Lecturer with The University of Glasgow, UK, for several years. In 2008 he took up a post as Senior Lecturer with The University of Technology Sydney (UTS), Australia, and he was promoted to Associate Professor in 2009 until he moved to UKZN in 2015. He was also an Adjunct Associate Professor with The National Cheng Kung University, Taiwan and he is currently a visiting professor with UTS. He research interests cover the design and analysis of various electrical machines and also renewable energy systems. He is a Chartered Engineer in the UK and a Fellow of the IET, London. In 2019 he was elevated to Fellow of the IEEE, USA.

Konstantin O. Papailiou has spent his entire career of more than 40 years in Power Systems and in particular Overhead Lines. He received his PhD from the Swiss Federal Institute of Technology (ΕΤΗ) Zurich and his post-doctoral qualification as lecturer (Dr.-Ing. habil.) from the Technical University of Dresden. Until his retirement at the end of 2011, he was CEO of the Pfisterer Group, a company he served for more than 25 years. He has held leading positions in various international technical societies and standardization bodies and has published more than 100 papers in professional journals as well as co-authored two reference books: "Silicone Composite Insulators" and the EPRI Transmission Line Reference Book "Wind-induced Conductor Motion". Professor Papailiou is also active in power engineering education, teaching Master's level courses on high-voltage overhead lines. Konstantin Papailiou is since many years strongly involved with CIGRE and has served from 2010 to 2016 as Chairman of CIGRE Study Committee "Overhead Lines". He is also the founding Editor-in-Chief of the CIGRE Science & Engineering Journal.
This project was in part funded by ESKOM through EPPEI. VRTC centre (UKZN), EPRI (USA), and Pfisterer SA
APPENDIX
Standardised reference levels of some vibration parameters are given in TABLE A.I


