


Serviços Personalizados
Artigo
 Inglês (pdf)
 Artigo em XML
 Referências do artigo
Indicadores

Links relacionados
-
 Citado por Google
 -
 Similares em Google
Compartilhar

 Permalink
SAIEE Africa Research Journal
versão On-line ISSN 1991-1696
versão impressa ISSN 0038-2221
SAIEE ARJ vol.110 no.1 Observatory, Johannesburg Mar. 2019
ARTICLES
Spatial Matrix Based Clustering of Sparse Electric Power Networks
Md. Ashfaqur RahmanI; Ganesh Kumar VenayagamoorthyII
IMember, IEEE. Real-Time Power and Intelligent Systems Laboratory, Holcombe Department of Electrical and Computer Engineering, Clemson University, Clemson, SC 29634, United States; Department of Electrical Engineering and Computer Science, Texas A&M University - Kingsville, Kingsville, TX. email: mdashfaqur.rahman@tamuk.edu
IISenior Member, IEEE. Real-Time Power and Intelligent Systems Laboratory, Holcombe Department of Electrical and Computer Engineering, Clemson University, Clemson, SC 29634, United States; School of Engineering, University of Kwazulu-Natal, Durban 4041, South Africa. email: gkumar@ieee.org
ABSTRACT
Distributed computation is an effective policy to increase the speed of the sparse networked systems. In a sparse network, clustering methods like k-means does not work directly as it cannot explore the connectivity of the system. To solve the problem, two modification methods are proposed in the existing graph and a new graph named Spatial Matrix is introduced in this paper. The proposed modification is a fast process and the computation time can be considered negligible compared to the rest of the process. Thus it preserves the ultimate objective of the distribution. It works as a pre-conditioning that can be used with a wide range of clustering and mathematical tools. With distributed state estimation of IEEE 14, 68, and 118-bus systems with automatic clustering, the effectiveness of the spatial matrix is demonstrated.
Index Terms: Distributed computation, network clustering, sparse network, spatial matrix, WLS estimator.
I. INTRODUCTION
One of the major classes of practical systems is the sparse network [1]. It appears in a large scale in social, computer, biological, transportation, citation, and power systems networks [2]. In a sparse network, each node is connected with a few other nodes, and none of them is connected with a large number of nodes. However, the networks are usually vast in nature, and most of their computations are time-consuming [3].
A major way to make the process fast is to distribute the whole system in clusters. Each cluster executes a local process with its own nodes ignoring the effects of the others. Once the processes are done, they exchange and update the results. Based on the nature of the process, they may repeat the local processes and exchange the results. Repeating these steps, they try to converge to the optimal result provided by the non-distributed/centralized method.
However, it is not an easy task to build the clusters that keeps the connectivity of the network. Moreover, the accuracy of the distributed method needs to meet a minimum threshold. Though there are a good number of works on building the clusters in different fields, most of them are time-consuming that hampers the ultimate objective of clustering [4]. The related works on graph clustering can be classified in two major groups, general applications, and specific applications. A few of them are mentioned below.
a) General Applications: A complete survey on graph clustering can be found in [5]. A general method is proposed in [6] based on the minimum cut trees on the graph. A discrete uncoupling process called Markov cluster process is proposed for finite spaces in [7]. Two algorithms named k-medoids and the Girvan-Newman method are compared in [8]. To extract the common information shared in a cluster, a method named weighted minimum common supergraph is proposed in [9] that can separate the information from noise and distortions. The idea of cliques is generalized in [10] as distance-k cliques . The weighted kernel k-means and several graph clustering objectives are combined to perform a semi-supervised clustering of data in [11].
b) Specific Applications: An algorithm is proposed in [12] to identify the dense clusters of co-cited references. Another method is developed in [13] to determine the class of the software systems. A method called Spatial Partition Clustering (SPC) is compared with three other methods for path query processing in [14]. In [15], the authors present intelligent clustering techniques for efficient prediction of sugar production. A software named IND based clustering is used for dense imaging network in [16]. Quantum clustering based multi-valued quantum fuzzification decision tree is used to detect the fault in analog circuit in [17]. The feature selection is considered as a clustering process with data decomposition technique in [18] and a novel feature selection method is proposed based on the non-negation matrix factorization.
In this paper, a fast and simple modification is proposed to effectively cluster the nodes based on their physical positions. With the aid of k-means clustering, the proposed method is demonstrated to perform faster for power system state estimation in Section 4. k-means cannot be applied directly on a network as it cannot incorporate the effects of the edges/connectivity [19]. The proposed method is applicable for both weighted and non-weighted graph. The effectiveness of the proposed method is tested for the state estimation problem of IEEE 14, 68 and 118-bus test system.
State estimation of power systems is a centralized process based on Weighted Least Squares (WLS) method [20], [21]. WLS is the most efficient estimator for any process with Gaussian noise. It includes matrix inversion or Cholesky decomposition in each iteration that makes it time-consuming. The computational complexity of matrix inversion is in the order of n3 [22]. So, the size of the system plays an important role in WLS estimation.
To reduce the size of the problem, distributed estimation is being analyzed for a long time. Different works focus on different aspects of the distribution. Some focus on the speed [23], [24], some on the local observability [25], some on islanding [26], some on inter-area oscillation [27], some on voltage stability monitoring [28] and some on robustness [29]. However, none of them have focused on automatic clustering of the buses where the above mentioned constraints are easily met. An operator may deal with thousands of buses and he may need to distribute those regardless of the observability and robustness.
The main contributions of the paper can be summarized as follows,
• Two different methods are proposed to form a modified graph named spatial matrix based on the physical locations of the nodes and the connection matrix. With the help of the k-means, a complete clustering algorithm is formed. Both methods convert the connectivities to a pair of new nodes. Each new node holds the attribute of the two nodes representing the connection.
- Method 1: It introduces the new nodes on the vertical and horizontal locations of the existing nodes. It creates some diversities in the placements of the nodes corresponding to the connectivity.
- Method 2: It places the new nodes on the connecting edge of two existing nodes. The new nodes are placed close to the existing nodes. This is helpful for preserving the observability of the clusters.
• The effects of the clustering algorithm are demonstrated on two test power systems under different conditions. It exhibits an effective way to parallelize the state estimation process.
It is not mandatory to use physical locations of the nodes. In fact, it is recommended that the relevant distances are used for each application domain. For example, for electric power grids, the electrical distances can also be considered. However, except the power grid, the analysis for other application domains is beyond the scope of this paper.
The rest of the paper is organized as follows. Section II introduces the system model for centralized and distributed WLS estimation. Two different methods are proposed to form the spatial matrix and their working principles are analyzed in Section III. The methods are applied on IEEE 14, 68, and 118-bus systems and the formed clusters are studied in Section IV. The simulation results are discussed in Section V. The paper is concluded with future plans in Section VI.
II. System Model
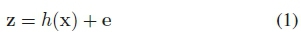
To monitor the current status of the power system, measurements are collected from different parts of the system. They are taken in the forms of power flows, power injections, voltage magnitudes, and current magnitudes etc. which contain errors of different levels. Let, z denotes an m χ 1 measurement vector including error. The relation between z, the state vector x, and the measurement error e can be written as,
Where, h(.) denotes the nonlinear function of the measurements.
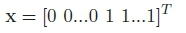
In state estimation, voltage magnitudes and angles are considered as the state variables. They form the set with minimum cardinality which can describe the whole system [30]. The angle of the reference bus is considered as the reference angle and all other angles are calculated with respect to that. If there are N buses, the state vector x can be represented as,

Here, θ and V, with proper subscripts, represent voltage angles and magnitudes respectively. If the number of buses in the system is N, there will be 2N - 1 state variables. In the process of estimation, the number of measurements exceeds the number of states to form an overdetermined system.
The accuracy is measured by the L2-norm of the residues which are calculated as the difference between the original measurements and the estimated measurements. Minimizing the norm (also referred to as the fitness) is the objective of the optimization problem,
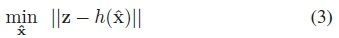
where, χ is the estimated state vector.
A. Weighted Least Squares Estimation
Like other nonlinear problems, WLS estimator linearizes the system over a small range. Then it applies linear operations to get an updated value. The system is linearized again based on this updated value and uses the linear estimation. This process is repeated unless the estimated value converges. In these methods, x is started with a close value to the solution. In the beginning, when there is no previous value, all voltage magnitudes start as 1 and all voltage angles as 0 which is known as flat start [31],
After collecting m measurements and constructing the Jacobian matrix H(x) at flat start, in WLS estimation, the following steps are repeated until the state vector converges to a solution,
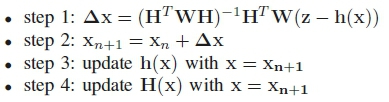
Here, the matrix, W denotes the relative weights of the measurements which are usually taken as the inverse of the corresponding error variances.
B. Distributed WLS Estimation
In case of distributed estimation, the system is divided in different mutually exclusive or non-exclusive clusters. Each cluster executes their local estimation. After completing estimation, they exchange and update their results.
The local estimation is similar to the centralized estimation. The only difference is that it includes only one cluster instead of the whole system. For each cluster, a bus is taken as a reference and all measurements are normalized based on that. As a result, the estimation results are also based on those cluster references. After exchanging the results among each other, the results of the intersections of the clusters are updated. To do so, all of them are converted back to their corresponding references. As the buses on the intersections have different values for different clusters, their means can be taken for further processing.
However, it is not mandatory that the local processes have to run till complete convergence. The clusters may exchange and update their results after completing a fixed number of iterations. After updating, they can run the local processes again and exchange and update accordingly.
III. Spatial Matrix Based Clustering
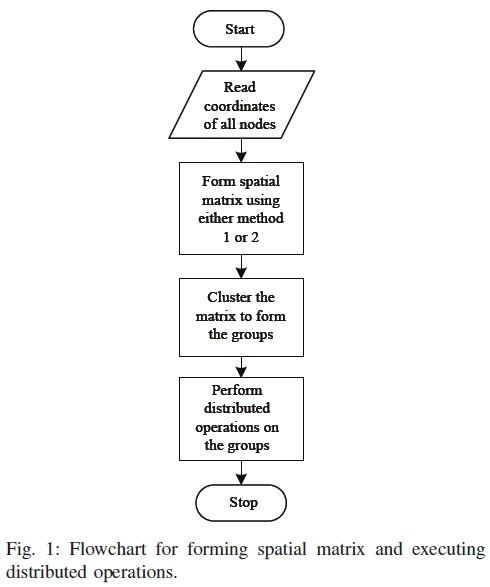
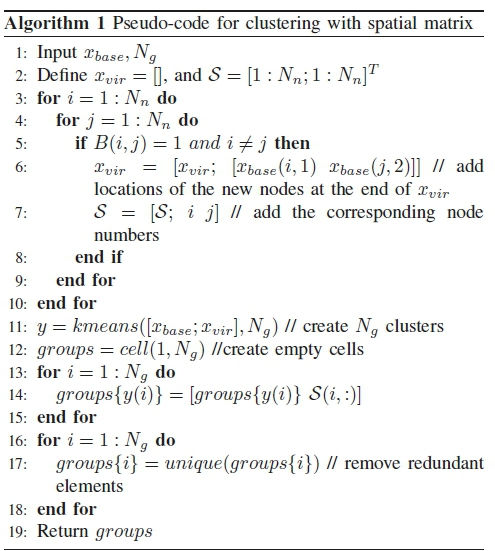
The spatial matrix is a 2-D graph with the base nodes added with some virtual nodes. The base nodes are the given nodes with known physical locations. The virtual nodes are created based on the base nodes to adapt the connectivity for the clustering. The complete process is summarized in Fig. 1.
A. Formation of Spatial Matrix
spatial matrix is based on the spatial locations of the nodes and the connectivity of the nodes. The connectivity matrix plays an essential role in the formation of spatial matrix. If a system has Nnnumber of nodes, then the basic or first order connectivity matrix, B1is defined as an Nnχ Nnmatrix where,
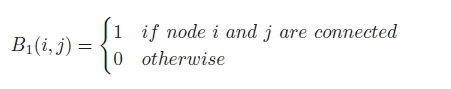
B1 represents the direct connections/edges of the network. B1can be used to find the second, third and higher order connectivity matrices. It is done in the following way by taking the power over B1, and converting the non-zero elements to 1,
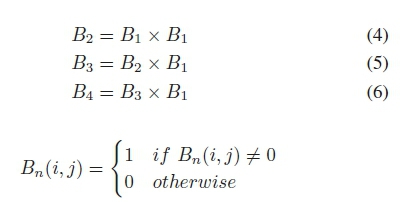
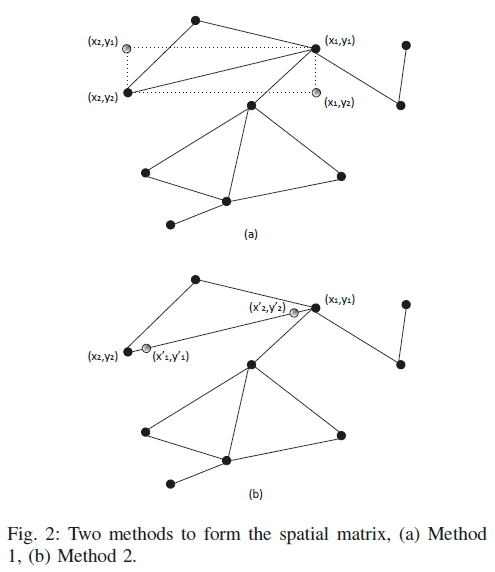
It can be noted that, all of Bi, B2, B3, B4 are symmetric matrices. Only one of them can be used in forming the spatial matrix. Once the connectivity matrix is defined, the spatial matrix is started with a 2-D graph. The base nodes are placed on the graph according to their physical location. Then for each edge in Bi (or higher orders, whatever is chosen) that is connected with two nodes located at (x1,y 1),and (x2,y2), two virtual nodes are placed in one of the two methods,
• Method 1: at (x1,y2), and at (x2,y1)
• Method 2: at (x1 + a(x2 - x1),y1 + a(y2 - y1)), and at (x2 + a(x1 - x2),y2 + a(y1 - y2))
Though α can take any value in between 0 and 1, the preferred choice is 0.05 < α < 0.2. Both methods take the neighbors close to each other. The details of the methods are discussed in section III-C and Fig. 2.
For Method 2, Line 6 is replaced with,
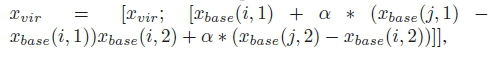
where, 0 < α < 1
C. Analysis of Spatial Matrix
The advantage of spatial matrix over the simple location based clustering is comprehensible from the formation of the matrix. For example, let us consider a part of a network shown in Fig. 2. The solid circles represent the base nodes, and the non-solid ones show the virtual nodes. The solid lines show the direct connection between the base nodes. Part (a) shows the placement of the virtual nodes using method 1, and part (b) shows that for method 2.
From the figure, it can be seen that the nodes at (x1,y1), and (x2,y2) are physically far from each other though they are first order neighbors. In case of direct application of k-means clustering on the graph, it is very less probable that they will be clustered together. Upon creation of the virtual nodes at (x1,y2), and at (x2,y1) according to method 1, the neighbors effectively come closer and the probability of having them together increases significantly.
The virtual nodes can be taken even closer using method 2. It creates the virtual nodes on the connecting lines of the base nodes. The value of α can control the distance between the base and virtual nodes. α = 0 or α =1.0 means no distance, while α = 0.5 means the maximum distance. At the maximum distance, the virtual nodes stay in the mid of the base nodes.
IV. Simulation Results
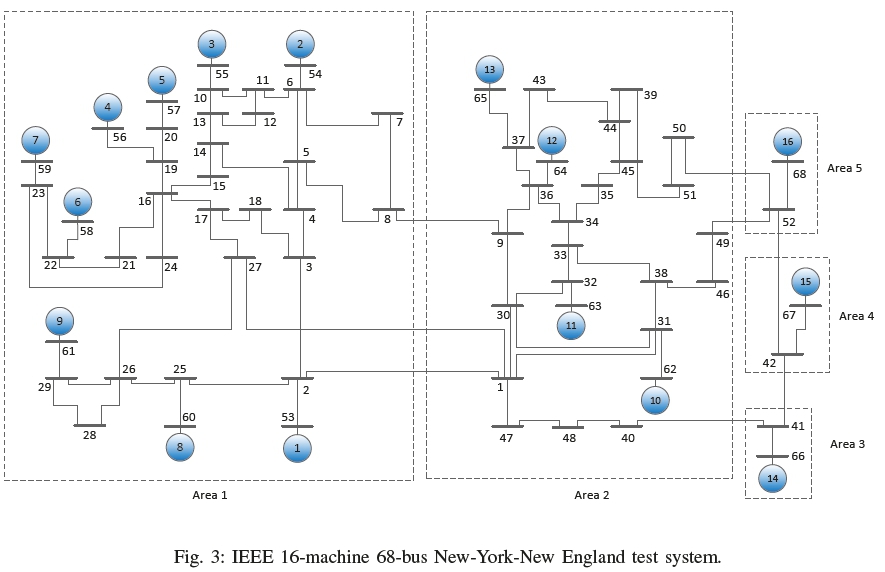
To test the effectiveness of the clustering by spatial matrix, IEEE 14, 68, and 118-bus test systems are used. The 14-bus system has 20 unique transmission lines with five generators. For 68-bus system, the number of unique connections is 83, and it has 16 generators as shown in Fig. 3. 118-bus system has a total of 186 lines. The details of the systems can be found in [32] (14-bus), [33] (68-bus) and in [32](118-bus). The physical distances for both systems are calculated based on the impedances of the network. The measurements are collected at the rate of 30 samples/second that is the typical rate of the phasor measurement units. Then an artificial Gaussian noise of around 0.25-5% of the original measurements is added with them.
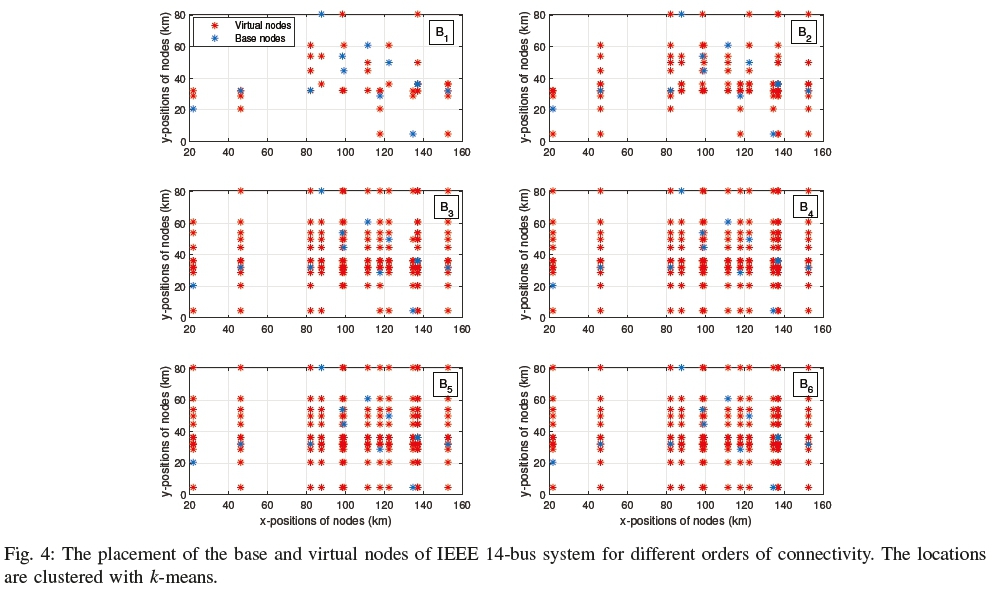
A. Clusters Formed by Spatial Matrix
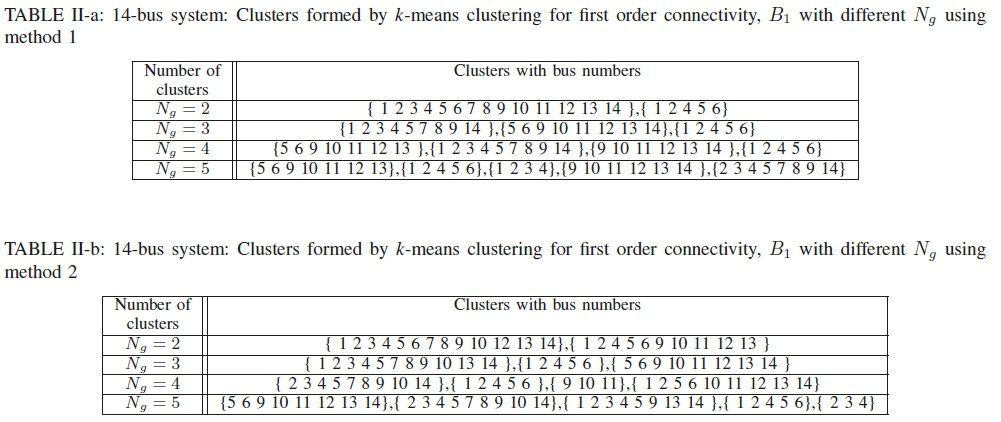
As mentioned earlier, the connectivity matrix has significant impact on the formation of the clusters. The spatial matrices formed by method 1 for different orders of connectivity for IEEE 14-bus system are shown in Fig. 4. The blue stars show the base nodes, and the red ones show the virtual nodes. It can be seen that with the increase in order, the number of virtual nodes increases. As a result, the connectivity gets stronger, and the sparsity gets reduced.
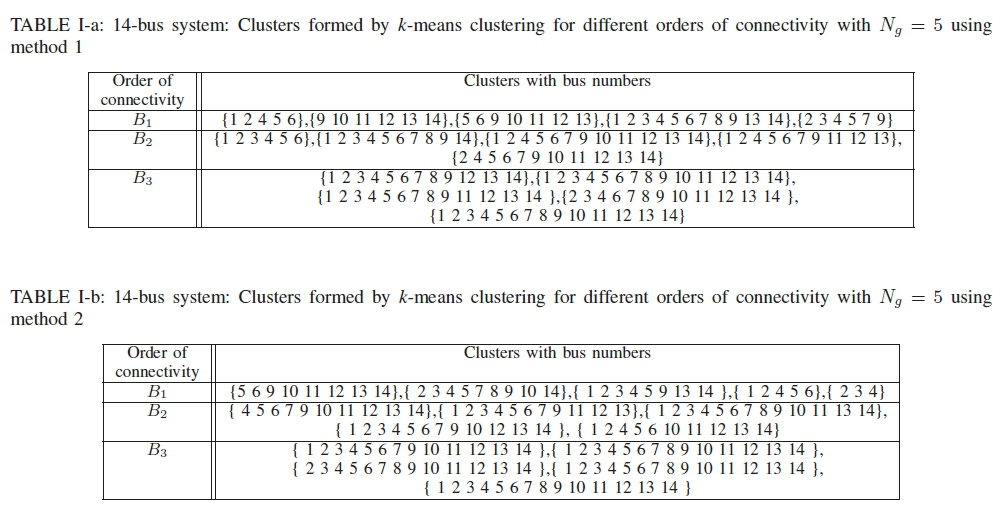
Based on the order of connectivity, the clusters formed by the k-means clustering are shown in Table I. The number of clusters is set to five. For method 2, α is set to 0.1. The table shows that with the increase in the order, the number of nodes in a cluster increases. There will be an order at which, the whole system will be included in one cluster. As the execution time directly depends on the size of the cluster with maximum nodes, a lower order of B is a preferred choice.
The effects of the number of groups on the formation of clusters are shown in Table II. The clusters are made for the first order of connectivity. It is clear from the table that with the increase in the number of clusters, the sizes of the clusters decrease and that makes the whole process faster.
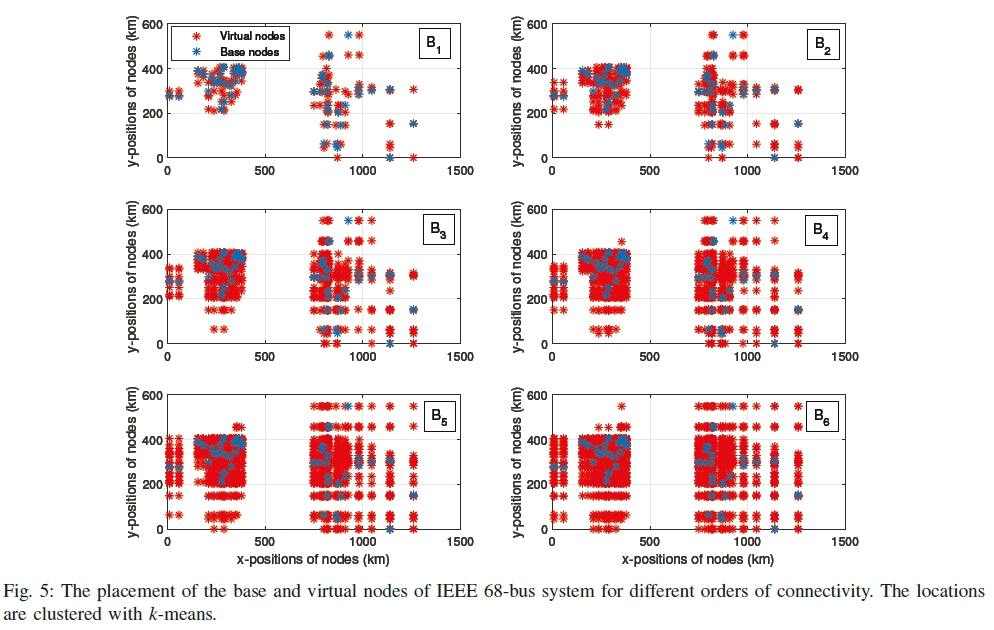
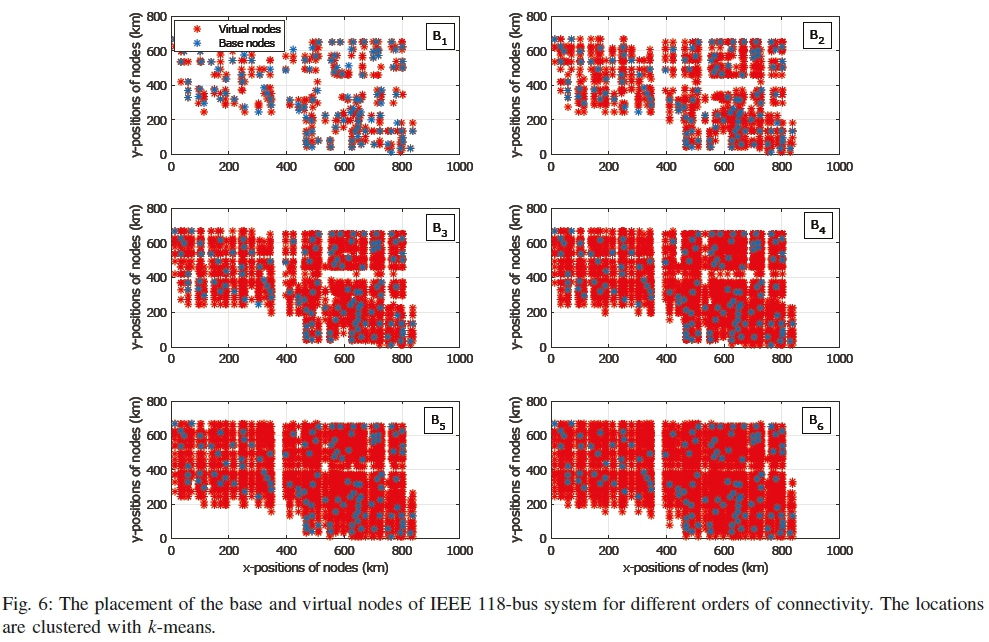
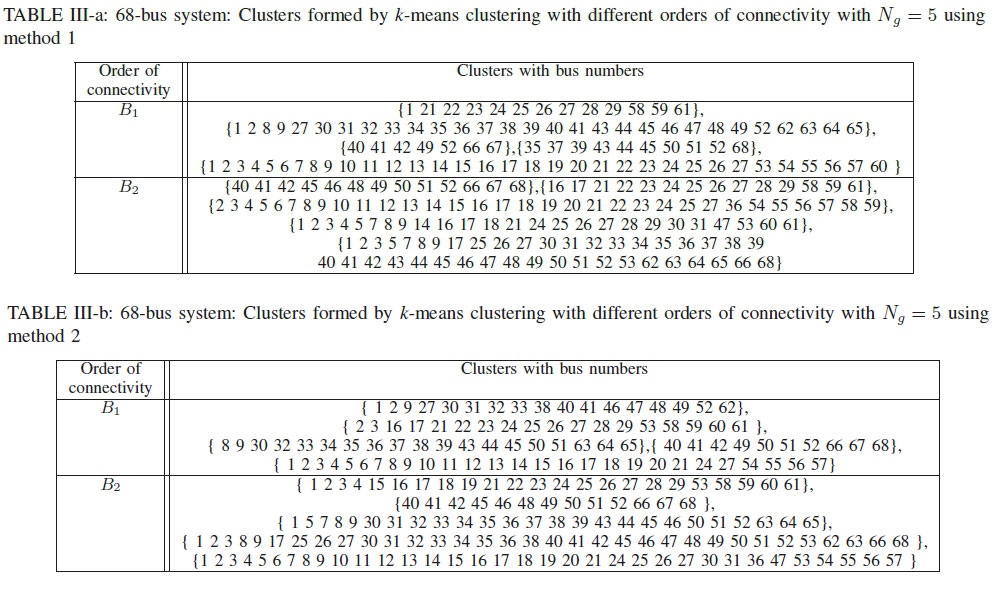
A similar analysis is found for IEEE 68 and 118-bus test system from Figs. 5, 6, and Tables III, IV.
B. Distributed Estimation of 14-bus System
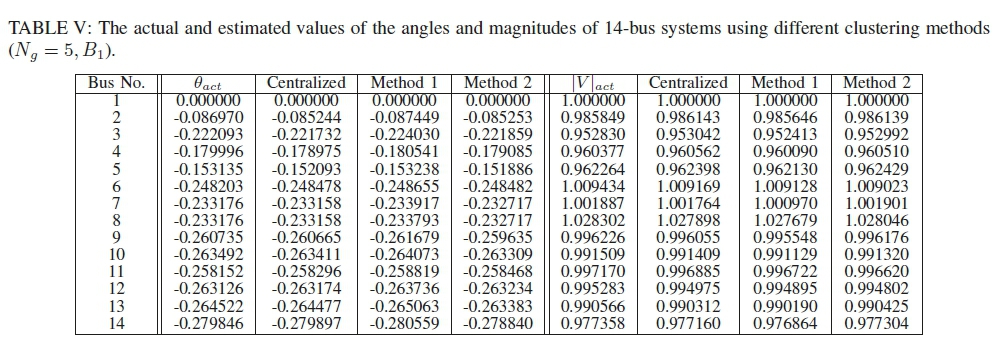
The distributed estimation is applied on the steady state operation for the 14-bus system. As the system does not change over time, only one sample is estimated. The steady state results are acquired using MATPOWER [32]. The actual, and estimated values by the centralized and distributed estimators with different methods for B1connectivity and Ng= 5 are shown in Table V.
From the table, it is seen that both methods perform well in comparison to the centralized estimator. However, it is not possible to yield a more accurate result than the centralized WLS estimator, as it is the most accurate one with Gaussian noise.
C. Distributed Estimation of 68-bus System
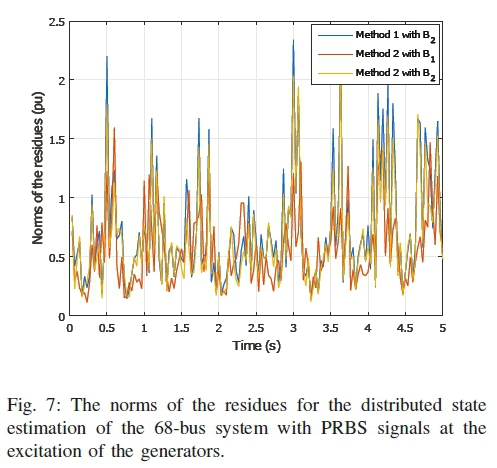
For 68-bus system, the simulation is executed for two different cases with 150 samples of measurements over five seconds, one with some random dynamic changes, another with a large disturbance in the system. The measurements are taken from Real-Time Digital Simulator. The total number of iteration is set to ten. The estimated results are exchanged every five iterations.
a) Case I: In this case, the change in the system is taken with pseudo-random binary signals (PRBS) applied at the excitation systems of the generators. This exhibits the normal load change behavior of the system. Five clusters are made with both methods using the first and second order connectivity as shown in Table III. The norm of the residues for 150 samples of data are shown in Fig. 7.
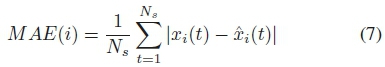
b) Case II: In case II, a three phase to ground fault is simulated at bus 8 of the 68-bus system. The fault occurs at time t = ls. Similar to case I, five clusters are made with both methods and 150 samples are taken over five seconds with a higher noise level. The norms of the residues are shown in Fig. 8.
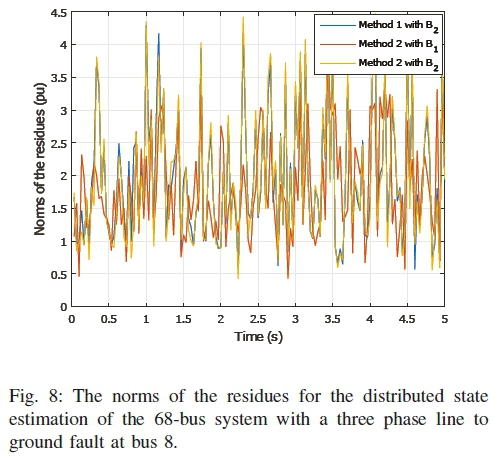
For both cases, it can be seen that method 2 with the first order connectivity has an overall low norm compared to other methods and connectivity. As a result, it performs better than others in terms of accuracy.
The mean absolute error (MAE) of the magnitude and angles of the two cases are shown in Table VI. The MAE for state i is defined as follows,
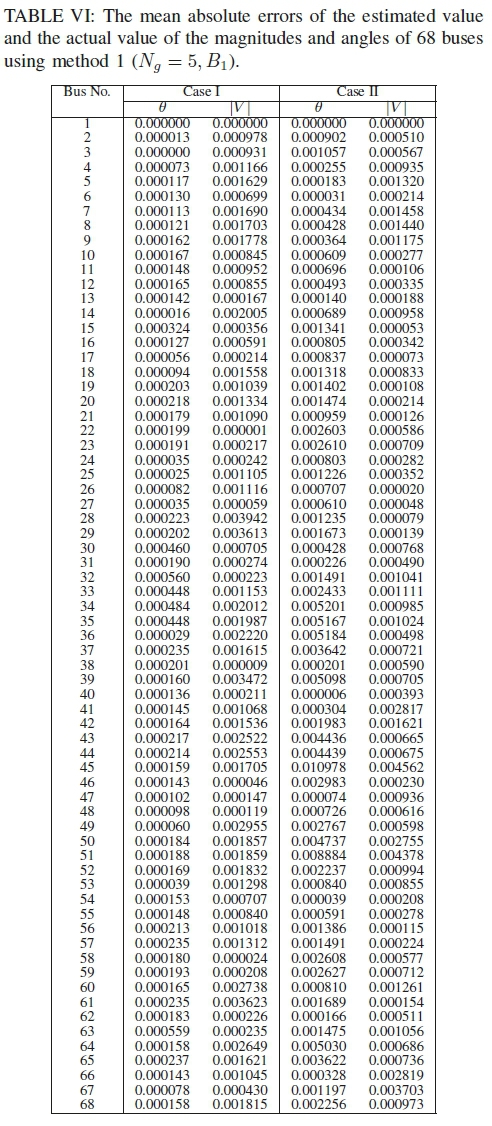
where, NSrepresents the number of samples.
V. Analysis of the Simulation Results
In this section, two important characteristics of an estimator, accuracy and time, are analyzed for the simulation results found in section IV.
A. Accuracy
The accuracy of the estimators on the 68-bus system for different number of clusters are shown in Figs. 9, 10, and 11. The 150 samples of case II is chosen for the comparison. When the number of cluster is one, it refers to the centralized estimation. From the figures, it can be seen that the norms of the residues increase with the increase in the number of clusters. It means that the accuracy reduces with the number of clusters.
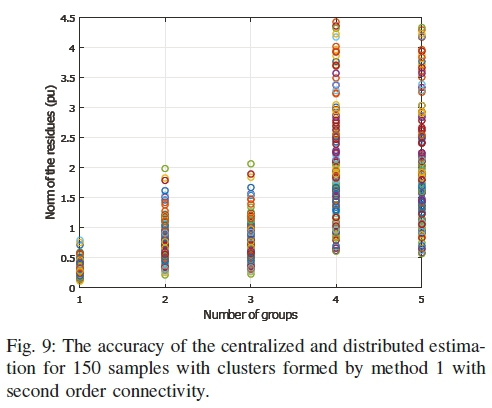
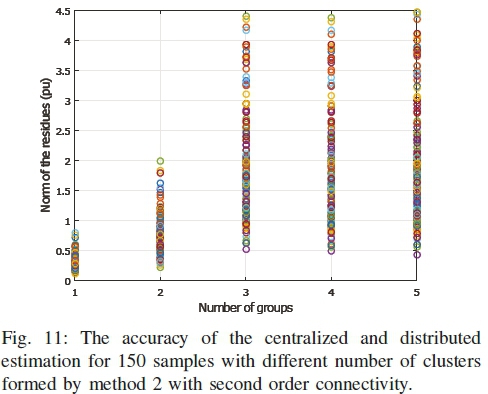
The reason behind this behavior is the effects of the reduced number of measurements in the clusters. The centralized estimator takes all measurements at a time and gets a better Probability Density Function (PDF) for the Gaussian noise. On the other hand, in the distributed estimation, each cluster works on a part of the measurement set, and the PDF becomes less similar to the Gaussian nature. Though the exchange process improves the results to some extent, it cannot recover the accuracy completely.
It should be kept in mind that, though the norms of the residues of the distributed systems are several times that of the centralized estimator, the difference between the actual value and the estimated values do not differ much as shown in Table VI. It is due to the fact that, the norms change a lot for a small change in the estimated values. As a result, the accuracy of the distributed estimation can be considered as acceptable.
B. Required Time
The required time by different number of clusters is shown in Figs. 12 to 15. The first three figures are for IEEE 68-bus system, where the last one is for 118-bus system. The simulation is run on an Intel Core 2 Duo 2.2GHz processor with 4GB of memory. The effectiveness of the distributed estimation can be realized from the figures. There exist some outliers which are caused by the background processes of the computing machine. It is not unusual to have these outliers in a generic computer. If the outliers are excluded, it can be seen that for all methods, the execution time is significantly less compared to the centralized one.
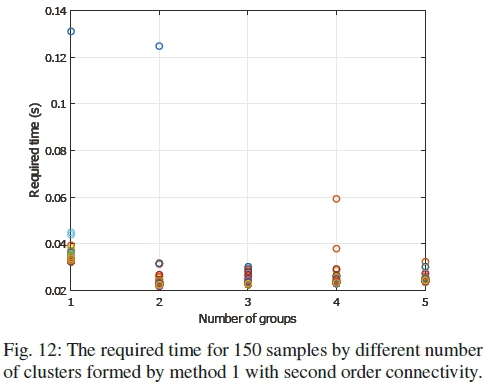
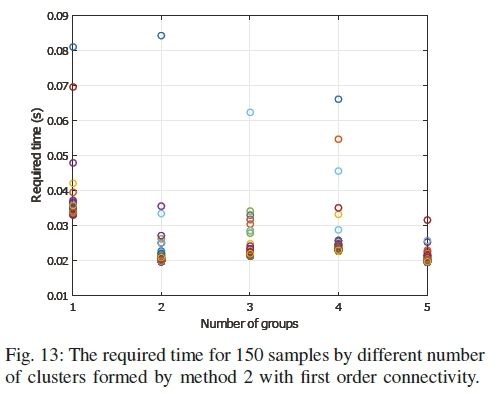
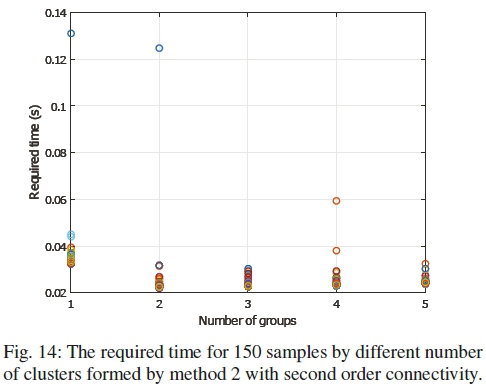
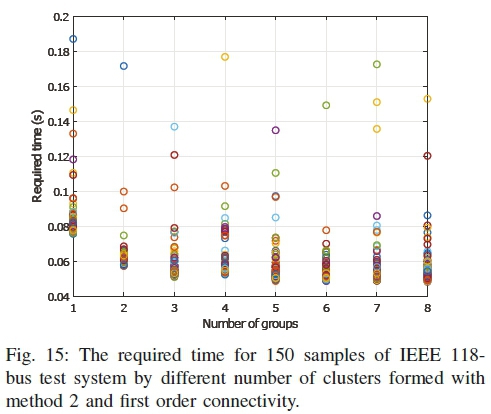
However, it can also be observed that the execution time did not reduce with the increased number of clusters. This is due to the fact that the execution time does not depend on the number of clusters, rather on the size of the largest cluster. As the clusters run in parallel in the distributed estimation, the overall execution time is determined by the slowest cluster i.e. the largest cluster.
VI. Conclusion
In this paper, a new graph called sparse matrix is proposed and its advantages are demonstrated to automatically cluster the electric power network. Two different methods are mixed with different orders of connectivity to find the best candidate for the matrix. It is applied on the state estimation of IEEE 14, 68, and 118-bus systems under different conditions and the computations are made faster than the existing centralized method. In reality, the system may include thousands of buses and a distributed estimation can make it fast enough for realtime operations.
From analytic and simulation results, it is shown that the sparse matrix graph can be effective in making coherent clusters of any networked system. Even though it is applied on a specific application of power system transmission network in this paper, it can also be applied to a varied range of applications with sparse networked systems. In future, the graph can be grouped with other clustering algorithms like mean-shift clustering or agglomerative hierarchical clustering. Some deep learning techniques can also be applied to find an improved results.
References
[1] S. Zhai and T. Jiang, "A novel sense-through-foliage target recognition system based on sparse representation and improved particle swarm optimization-based support vector machine," Measurement, vol. 46, no. 10, pp. 3994-4004, 2013. [ Links ]
[2] M. S. Bazaraa, J. J. Jarvis, and H. D. Sherali, Linear programming and network flows. New York: J. Wiley, 1977.
[3] V. Satuluri and S. Parthasarathy, "Scalable graph clustering using stochastic flows: Applications to community discovery," in Proceedings of the 15th ACM SIGKDD International Conference on Knowledge Discovery and Data Mining. ACM, 2009, pp. 737-746.
[4] S. Shamshirband, A. Amini, N. B. Anuar, M. L. M. Kiah, Y. W. Teh, and S. Furnell, "D-FICCA: A density-based fuzzy imperialist competitive clustering algorithm for intrusion detection in wireless sensor networks," Measurement, vol. 55, pp. 212-226, 2014. [ Links ]
[5] S. E. Schaeffer, "Graph clustering," Computer Science Review, vol. 1, no. 1, pp. 27-64, 2007. [ Links ]
[6] G. W. Flake, R. E. Tarjan, and K. Tsioutsiouliklis, "Graph clustering and minimum cut trees," Internet Mathematics, vol. 1, no. 4, pp. 385-408, 2004. [ Links ]
[7] S. Van Dongen, "Graph clustering via a discrete uncoupling process," SIAM Journal on Matrix Analysis and Applications, vol. 30, no. 1, pp. 121-141, 2008. [ Links ]
[8] M. J. Rattigan, M. Maier, and D. Jensen, "Graph clustering with network structure indices," in Proceedings of the 24th International Conference on Machine Learning. ACM, 2007, pp. 783-790.
[9] H. Bunke, P. Foggia, C. Guidobaldi, and M. Vento, "Graph clustering using the weighted minimum common supergraph," in International Workshop on Graph-Based Representations in Pattern Recognition. Springer, 2003, pp. 235-246.
[10] J. Edachery, A. Sen, and F. J. Brandenburg, "Graph clustering using distance-k cliques," in International Symposium on Graph Drawing. Springer, 1999, pp. 98-106.
[11] B. Kulis, S. Basu, I. Dhillon, and R. Mooney, "Semi-supervised graph clustering: A kernel approach," Machine Learning, vol. 74, no. 1, pp. 1-22, 2009. [ Links ]
[12] H. A. Schildt and J. T. Mattsson, "A dense network sub-grouping algorithm for co-citation analysis and its implementation in the software tool Sitkis," Scientometrics, vol. 67, no. 1, pp. 143-163, 2006. [ Links ]
[13] Y. Chiricota, F. Jourdan, and G. Melançon, "Software components capture using graph clustering," in 11th IEEE International Workshop on Program Comprehension, 2003. IEEE, 2003, pp. 217-226.
[14] Y.-W. Huang, N. Jing, and E. A. Rundensteiner, "Effective graph clustering for path queries in digital map databases," in Proceedings of the Fifth International Conference on Information and Knowledge Management. ACM, 1996, pp. 215-222.
[15] V. G. Kaburlasos, V. Spais, V. Petridis, L. Petrou, S. Kazarlis, N. Maslaris, and A. Kallinakis, "Intelligent clustering techniques for prediction of sugar production," Mathematics and Computers in Simulation, vol. 60, no. 3, pp. 159-168, 2002. [ Links ]
[16] A. H. Ahmadabadian, R. Yazdan, A. Karami, M. Moradi, and F. Ghor-bani, "Clustering and selecting vantage images in a low-cost system for 3D reconstruction of texture-less objects," Measurement, vol. 99, pp. 185-191, 2017. [ Links ]
[17] Y. Cui, J. Shi, and Z. Wang, "Analog circuit fault diagnosis based on Quantum Clustering based Multi-valued Quantum Fuzzification Decision Tree (QC-MQFDT)," Measurement, vol. 93, pp. 421-434, 2016. [ Links ]
[18] L. Liang, F. Liu, M. Li, K. He, and G. Xu, "Feature selection for machine fault diagnosis using clustering of non-negation matrix factorization," Measurement, vol. 94, pp. 295-305, 2016. [ Links ]
[19] A. K. Tung, J. Hou, and J. Han, "Spatial clustering in the presence of obstacles," in Data Engineering, 2001. Proceedings. 17th International Conference on. IEEE, 2001, pp. 359-367.
[20] F. C. Schweppe and J. Wildes, "Power system static-state estimation, Part I: Exact model," IEEE Trans. Power Apparatus and Systems, vol. 1, pp. 120-125, Jan 1970. [ Links ]
[21] F. C. Schweppe and D. B. Rom, "Power system static-state estimation, Part II: Approximate model," IEEE Ttans. Power Apparatus and Systems, vol. 1, pp. 125-130, Jan 1970. [ Links ]
[22] W. Hackbusch, "A sparse matrix arithmetic based on Ή-matrices. Part I: Introduction to Ή-matrices," Computing, vol. 62, no. 2, pp. 89-108, Apr 1999. [ Links ]
[23] D. M. Falcao, F. F. Wu, and L. Murphy, "Parallel and distributed state estimation," IEEE Transactions on Power Systems, vol. 10, no. 2, pp. 724-730, 1995. [ Links ]
[24] M. A. Rahman and G. K. Venayagamoorthy, "Convergence of the fast state estimation for power systems," SAIEE Research Journal, vol. 108, pp. 117-127, 2017. [ Links ]
[25] L. Xie, D. H. Choi, S. Kar, and H. Poor, "Fully distributed state estimation for wide-area monitoring systems," IEEE Trans. Smart Grid, vol. 3, no. 3, pp. 1154-1169, Sept 2012. [ Links ]
[26] W. Liu, L. Liu, D. A. Cartes, and G. K. Venayagamoorthy, "Binary particle swarm optimization based defensive islanding of large scale power systems." International Journal ofComputer Science Applications, vol. 4, no. 3, pp. 69-83, 2007. [ Links ]
[27] K. Tang and G. K. Venayagamoorthy, "Adaptive inter-area oscillation damping controller for multi-machine power systems," Electric Power Systems Research, vol. 134, pp. 105-113, 2016. [ Links ]
[28] G. K. Venayagamoorthy and K. J. Makasa, "Online voltage stability monitoring with wind farms and electric vehicles in a smart grid," in Proceedings of the 20th International Conference on Electrical Engineering, 2014, pp. 1770-1774.
[29] V. Kekatos and G. B. Giannakis, "Distributed robust power system state estimation," IEEE Trans. Power Systems, vol. 28, no. 2, pp. 1617-1626, May 2013. [ Links ]
[30] A. Abur and A. G. Exposito, Power System State Estimation: Theory and Implementation. New York: Marcel Dekker Inc., 2004.
[31] A. Monticelli, State estimation in electric power systems: A generalized approach. Massachusetts: Kluwer Academic Pub., 1999.
[32] R. D. Zimmerman, C. E. Murillo-Sánchez, and R. J. Thomas, "MAT-POWER: Steady-state operations, planning, and analysis tools for power systems research and education," IEEE Transactions on Power Systems, vol. 26, no. 1, pp. 12-19, 2011. [ Links ]
[33] B. Chaudhuri, R. Majumder, and B. C. Pal, "Wide-area measurement-based stabilizing control of power system considering signal transmission delay," IEEE Trans. Power Systems, vol. 19, no. 4, pp. 1971-1979, Nov 2004. [ Links ]
This work was supported in part by US National Science Foundation (NSF) under grant #1312260, and #1408141, and the Duke Energy Distinguished Professor Endowment Fund. Any opinions, findings, conclusions or recommendations expressed in this material are those of the author(s) and do not necessarily reflect the views of the financial supporters.

Md Ashfaqur Rahman is currently serving as a Visiting Assistant Professor at Texas A&M University - Kingsville. He received his Ph.D. from the department of Electrical and Computer Engineering of Clemson University in 2017. Before that he received his Master of Science from Texas Tech University in 2012, and Bachelor of Science from Bangladesh University of Engineering and Technology in 2009. He has served as a lecturer of electrical engineering for around two years. He has also served as a research assistant at Clemson University and Texas Tech University. His research interest is in the broad area of power system state estimation with an emphasis on cyber security and distributability of different estimation methods. He published two journal articles and eight conference papers with a total of 210 citations. He has been a reviewer of IEEE and Elsevier journals, and conference papers. He is a member of IEEE.

Ganesh Kumar Venayagamoorthy (S'91-M'97-SM'02) is the Duke Energy Distinguished Professor of Power Engineering and Professor of Electrical and Computer Engineering and Automotive Engineering at Clemson University. Prior to that, he was a Professor of Electrical and Computer Engineering at the Missouri University of Science and Technology (Missouri S&T), Rolla, USA from 2002 to 2011. Dr. Venayagamoorthy is the Founder (2004) and Director of the Real-Time Power and Intelligent Systems Laboratory (http://rtpis.org). He holds an Honorary Professor position in the School of Engineering at the University of Kwazulu-Natal, Durban, South Africa. Dr. Venayagamoorthy received his Ph.D. degree in electrical engineering from the University of Natal, Durban, South Africa. He holds an MBA degree in Entrepreneurship and Innovation from Clemson University, SC.
Dr. Venayagamoorthy's interests are in the research, development and innovation of smart grid technologies and operations, including intelligent sensing and monitoring, intelligent systems, integration of renewable energy sources, power system optimization, stability and control, and signal processing. He has published over 500 refereed technical articles. His publications are cited over 15,000 times with a h-index of 60. Dr. Venayagamoorthy has been involved in over 70 sponsored projects in excess of US $10 million. Dr. Venayagamoorthy has given over 300 invited keynotes, plenaries, presentations, tutorials and lectures in over 40 countries to date.
Dr. Venayagamoorthy is involved in the leadership and organization of many conferences including the General Chair of the Annual Power System Conference (Clemson, SC, USA) since 2013, and Pioneer and Chair/co-Chair of the IEEE Symposium of Computational Intelligence Applications in Smart Grid (CIASG) since 2011. He is currently the Chair of the IEEE PES Working Group on Intelligent Control Systems, and the Founder and Chair of IEEE Computational Intelligence Society (CIS) Task Force on Smart Grid. Dr. Venayagamoorthy has served as Editor/Guest Editor of several IEEE Transactions and Elsevier Journals. Dr. Venayagamoorthy is a Senior Member of the IEEE, and a Fellow of the IET, UK, and the SAIEE.

