


Services on Demand
Article
 English (pdf)
 Article in xml format
 Article references
Indicators

Related links
-
 Cited by Google
 -
 Similars in Google
Share

 Permalink
SAIEE Africa Research Journal
On-line version ISSN 1991-1696
Print version ISSN 0038-2221
SAIEE ARJ vol.109 n.4 Observatory, Johannesburg Dec. 2018
ARTICLES
Subtropical rain attenuation statistics on 12.6 GHz ku-band satellite link using Synthetic Storm Technique
B. O. AfolayanI; T. J. AfulloI; A. AlongeII
IDiscipline of Electrical, Electronic and Computer Engineering, University of KwaZulu-Natal Howard Campus, Durban, South Africa
IIDepartment of Electrical and Electronic Engineering Technology, University of Johannesburg Doornfontein Campus, Johannesburg, South Africa
ABSTRACT
In this work, measured subtropical rain attenuation was compared with rain attenuation generated theoretically by the Synthetic Storm Technique (SST). The rain attenuation data was obtained from a Ku-band satellite TV link collocated at the site of a rain rate measurement system in Durban, South Africa (28°87'S, 30°98'E). A mathematical model developed from the measurement campaign was used to generate measured data for four years of rainfall. Annual cumulative distribution functions of SST prediction results are compared with the results of the measurement-based model. The results show SST to be a fair approximation of actual measurements. This was established by error analysis carried out to compare the error margins in SST prediction and the error margins in the in-force ITU-R prediction method. While the SST approach was shown to conform slightly less accurately to measurements than the ITU-R model, it still yields highly acceptable results in the 0 to 11 dB margin in which the said link experiences most of the measured attenuation before total channel squelching occurs.
Keywords: Synthetic Storm Technique, slant path rain attenuation, subtropical rain.
1. INTRODUCTION
Wireless communication deployment and planning requires site-specific link budgeting. Next to free space path loss, the most significant loss item to anticipate in a link budget is rain attenuation. It is more severe than fading caused by any other hydrometeor. It becomes especially severe at frequencies of 5 GHz and above [1].
While the accuracy of measurement equipment for rain attenuation has greatly improved over the years, future planning still depends heavily on theoretical approaches because measurements can realistically be carried out on a limited number of links - which implies a limited number of frequencies, path lengths, elevation angles and other specifics. Theoretical models, however, can be applied more widely by slotting in hypothetical link parameters at the planning stage and simulating for any number of scenarios. It is especially useful to explore the reliability of theoretical models by juxtaposing the results of their application with the results of measurement-based models. Furthermore, the performance of these models have been more widely explored in temperate and tropical environments, while their performances in subtropical rain have been investigated to a much less degree. Rainfall intensity in the subtropics expectedly fall about midway between those of temperate and tropical regions. Thus, it is expected presents its own unique patterns that requires some independent modelling.
The Synthetic Storm Technique (SST) is a theoretical approach for estimating rain fade and has been widely applied to both terrestrial and slant path links [2], [3], [4]. The term was first used in [5] for describing a method by which data generated from a rain gauge is used to predict rain rate at a different location by using an estimate of cloud advection speed along the path between the two locations. Matricciani [6] then used the concept to develop a novel mathematical method for an integral estimation of rain attenuation from rain rate records.
In this work, we have applied the same theoretical approach to estimate rain attenuation on a 12.6 GHz satellite TV link (fed from the Intelsat-20 satellite at 38,050 km, 68.5oE) using rain rate statistics amassed over a period of four years from disdrometer measurements at the same location as the satellite link [7]. The rain data has a slightly higher time resolution than usual, being a record of rain rate at every 30 second interval of precipitation throughout the years in question. Early applications of this method utilized rain gauge data from temperate regions at 1-minute integration time. Several studies of rain attenuation (e.g. [8], [9] and [10]) have been previously undertaken in Durban, South Africa. The present study aims at examining to what extent SST can be used to validate slant path subtropical rain attenuation measurement carried out at the location.
2. ATTENUATION MEASUREMENT
On the satellite link described in the previous section, a model was earlier developed for measured attenuation using an equipment system located on the rooftop of the Electronic Engineering building at the University of KwaZulu-Natal Howard Campus, Durban, South Africa at specific coordinates 28.87oS, 30.98oE. This measurement campaign represents the only one reported for a slant path microwave link in the subtropical region that is of similar duration.
The system includes a downlink satellite receiver system and a rainfall measurement system. A schematic of the entire system is presented in Fig. 1. The Received Signal Level (RSL) over the satellite link is monitored by a Rhodes and Schwarz FSH8 spectrum analyzer which conducts a sweep over the entire bandwidth every 60 seconds and also registers the overall channel power. The use of a spectrum analyzer eliminates the necessity of using a special scintillation filter as the equipment is able to independently differentiate the rapid changes due to scintillation from signal attenuation. Rain rate at the location is also captured for all events by a JossWaldvogel RD-80 impact-type disdrometer. The receive antenna and the disdrometer diaphragm are in close proximity (less than 4 m apart). This ensures that all rainfall events experienced at the receive antenna is captured by the disdrometer.

Table 1 presents an outline of the satellite link budget. From this table, the receiver sensitivity is -71.7 dBm while the estimated received channel power is -61 dB. This implies that the measurable attenuation margin on the link is about 10.7 dB. Beyond this point, the reception on the link is squelched out. An exhaustive presentation of the measurement process and the model thus developed is outlined in [7].
3. THEORETICAL BASIS OF SYNTHETIC STORM TECHNIQUE
The dynamic nature of rain forms has been explored by various investigators and certain patterns established. [5] showed that as a rain form passes over the rain gauge, advection speed and the rain rate data can be used to convert the time it takes to pass over the rain gauge to distance. A fairly good reckoning of the rain rate distribution pattern over the distance can then be deduced. In [11], the authors showed that over distances comparable to the length of most earth-satellite paths, there is a marked statistical consistency in rain rate patterns as the rain form spans the distance. Drawing from these, [12] provided evidence that if the storm motion roughly aligns with the radio path, rain attenuation obtained from such a "synthetic path" will agree with actual attenuation values. The SST was tested in earlier works using radar-derived values of storm speed that averaged about 10 m/s [13], [14], [15].
SST adopts a dual-layer model of the vertical profile of rain. From the ground to the zero-degree isotherm is labelled the "A" layer. This layer consists entirely of liquid precipitation and the rain rate R in this layer is taken to be the same as the rain rate measured by the equipment on the ground. Above layer A lies layer B, which is essentially the melting layer, made up of both liquid hydrometeors and ice in melting form. While layer A approaches up to 6 km, layer B is often estimated as lower than 0.5 km. It has been shown that the rain rate RB in the layer B, (called the apparent rain rate) is related to R as [6]

In [6], the author applied the old ITU-R method [16] for estimating the rain height. According to the recommendation, rain height at the layer B in figure 3 for any location at a latitude фabove 23o as is the case with our link, which is at elevation 36.5o is given by


The thickness of layer B, h is taken as 0.4 km, hence the height HAis thus given by

For this work, we have adopted the in-force ITU-R model for rain height [17], which allots a value of 0.36 km to melting layer depth and hence estimates HB as

where h0is the height of the zero-degree isotherm and is equivalent to HA. 0.36 is the assumed melting layer depth in kilometres. The value of h0can be read for location from a map provided by the ITU-R recommendation. The lengths LAand LBof the slant path up to the top of each layer are given by [17]

where вis the elevation angle and HSis the height of the location of the receiving antenna above sea level.
Applying the Olsen expression which gives the specific attenuation at x on the x-axis уas [18]

where k and a are frequency-dependent parameters for water at temperature 20oC in [19]. The values of k and a for water at 0oC are also presented in [19], which makes it possible for us to estimate уfor layer B. уis defined as the attenuation per kilometre, hence, the attenuation along a path of length L km can be estimated by the integral

The fundamental idea behind the SST is that if there is a reliable level of isotropy of the rain medium at each layer, then the variation of attenuation with time is simulated by varying the point x0at a time rate that equals the storm speed v such that x0 = vt.
If Өis the elevation angle and ξis the slant path ordinate, then total signal attenuation in case of satellite path is obtained from specific attenuation at a point as the sum of attenuation in both layers given by summing the integrals in (9) for each layer as (r being the ratio 3.134 of rain rate in both layers), [6]

Equation (9) has the basic form of a rectangular function with width L centred at the origin such that

Matricciani [6], presented a detailed mathematical process in which Fourier transform was applied to the rectangular function in the integrand of (10). Taking limits of the attenuation at time instant t during which the rain spike has a value of R (mmh-1) resulted in an estimate of the total attenuation experienced in the storm at all storm speeds given by [6]
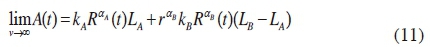
Matricciani in [6] observed that the resulting limit in equation (11) implies that the long-term application of the SST for estimating attenuation is insensitive to storm speed v. Hence, we can arrive at a reliable estimate of A(t) using a known, long term, measured rain rate time series R(t) as the prime time-varying input.
4. INPUT PARAMETERS AND LINK STATISTICS.
For this work, we generate measured data by utilizing a power law expression obtained for the average band of measured subtropical rain attenuation as reported in [7] given by
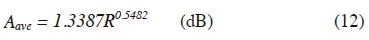
The measured data is modelled in bands because for every 0.5 mmh-1 or 1 mmh-1 rain rate bin, a range of attenuation values due to the bin is observed in the measurement. The mid-point of this range was adopted as the average measured attenuation for the rain rate bin. A different model was obtained to represent the minimum, maximum and the average bands. Statistical analysis done in [7] shows that the equation (12) bears an exact conformance to actual measurements of maximum rain attenuation on the link 89.9% of the time, making it an excellent representation of measured data. It is to be noted that the measurement model was developed based on drops in RSL level observed during rain events that were captured by the disdrometer. Attenuation events due to precipitation at far away locations were ignored as the interest is to model for subtropical rain. The table 1 presents Table 2 presents the link parameters adopted for the two-layer SST model calculations.

5. ATTENUATION PREDICTION BY SST FOR SELECTED HIGH-INTENSITY RAIN EVENTS.
The results of the synthetic storm technique for Durban during a few high-intensity rain events from 2013 to 2016 are presented in the figures 4 to 8 along with the rain attenuation measured on the 12.6 GHz link during the rain event.


It should be noted that the measurement link used in this work had an equipment sensitivity of -71.7 dB as against a link budget that anticipates a received power of -61 dB under the best conditions. This imposes a practical limitation of the system not being able to register rain attenuation levels beyond 10.7 dB. Above this level of fade, the link is completely squelched. The comparisons reported in this work are thus restricted to rain spikes that produce a maximum SST rain fade similar to the maximum imposed by measurement equipment.
SST can be described more accurately as a long-term summation of the rain attenuation experienced on the link over an extended period of time [6]. Therefore, event-specific snapshots aggregated at one storm speed may not be as accurate as the long-term data. Moreover, SST estimates tend to ignore the less significant fade instances brought about by low rain rate such as attenuation levels of 3 dB and below. In most of these instances, where the measured attenuation is 3 dB and below, SST often registers a flat fade level, only showing a spike when the measured value shoots significantly above that threshold. Being essentially a summation of power law elements, the effect of layer B attenuation is slightly muted at low values of rain rate.
About the middle and upper ranges of rain intensity, SST results mostly agree with measured values. At the peak rain rates, it slightly overestimates the attenuation level but still gives a very good approximation. The attenuation predicted in the layer "B" appears to make a significant contribution as the rain rates get higher. It is most pronounced in its effect on total path attenuation at the peak rain rates. This is likely to be the reason for the slightly higher values seen in that range compared with actual values.
Even though the results of SST over the long term is the most significant, its performance over individual events is remarkably similar to measured fade levels.
6. ANNUAL SUBTROPICAL RAIN ATTENUATION EXCEEDANCE BY SST
The nature of the agreement between SST and measurement for location-sensitive considerations can be illustrated by the comparing between the annual attenuation exceedance trends as presented in figures 8 to 11 for the years 2013 to 2016.
The peculiarity of annual exceedance probability patterns lies in the fact that they are heavily influenced by the rain pattern in each particular year. This is seen in the results in the figure. 2013 and 2014 were considered years of drought in Durban and the surrounding regions. The low volume of rain in these two years compared to 2015 and 2016 is responsible for the variation in the annual exceedance patterns, which also suggests that SST is sensitive to the volume of rain over time.
Communication links are planned for availability during at least 99.99% of the year. This implies that the fade margin allowed must not be higher than the attenuation exceeded at 0.01% (A0,01) of the year (or 87.6 hours) [1]. Table 4 compares the values of A0,01obtained for each year from measurement and from SST prediction. The results agree more in 2013 and 2014 than in 2015 and 2016 but the overall result suggests that SST is a fairly credible estimate of the attenuation exceeded.

7. PERFORMANCE OF SST PREDICTION WITH THE ITU-R PREDICTION
The figure 12 presents a direct juxtaposition of SST, measurement and the in-force ITU-R model for the 0 to 40 mm/h rain rate range. This range is chosen because it coincides with the rain rate range in which the measurement on the link used attains the critical attenuation range of 0 to about 11 dB. In this range, we can obtain a more general gauge of the relevance of SST as a useful theoretical tool for rain attenuation prediction in the subtropics can be obtained by error analyses, which holds the measured data as the expected value and the SST as the observed value. Both the Chi-square test and root-mean-square error (RMSE) are estimated as in the equations (16) and (17). The RMSE error is a basic test of the deviation between an observed value and an estimated value. Chi-Square Test is a slightly higher statistical test of hypothesis where the Chi-Square distribution is obeyed when the null hypothesis holds true. Picking a convenient confidence level, we estimate the Chi-Square parameter between our observed value and the estimated value. The sample population forms our number of degrees of freedom. The Chi-Square value must lie well below the critical value on the Chi-Square distribution table for that particular set of parameters, i.e. confidence level and degrees of freedom. When this is the case, we say the null hypothesis is accepted as true, which implies that the statistical difference between the observed and the estimated values is not significant.

In equation (16), ptis the SST value of attenuation at a certain rain rate while atis the value from the measured model at the same rain rate. For equation (17), we set O, the observed value as the SST value of attenuation and E , the expected value as the value obtained from the measurement model.
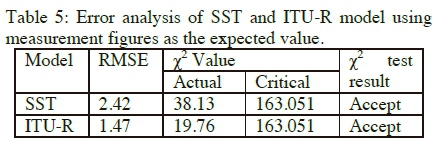
The table 5 shows the results of the error analysis. The RMS error in SST is slightly higher than that of the ITU-R method but at 2.42, is still an acceptable margin of error. The Chi-Square test also shows that the SST has a Chi-Square value of 38.13 as against 19.76 for the ITU-R model. Both fall well below the critical value of 163.051 but the ITU-R is clearly a more acceptable hypothetical approach. It shows that the ITU-R model performs better as a prediction model than the SST model for this link but it can still be considered a very useful method in the rain fade prediction process since it does not vary too far from observed levels in this critical range of rain rates.

8. CONCLUSION
The performance of the SST on Ku band satellite link using rainfall data from a subtropical location gives a strong indication that the SST is a reliable method for theoretical prediction of rain attenuation on slant paths.
The efficacy of this method is well-documented for temperate regions [2], [3], [4] in a few cases for tropical regions [21], [22], and fewer still for the subtropics. The comparison of SST results presented here is with the average bound of measured subtropical rain attenuation, where link impairment levels are most practical [7]. However, the ITU-R approach shows slightly more accuracy than SST.
REFERENCES
[1] International Telecommunications Union, "Propagation data and prediction methods required for the design of terrestrial line-of-sight systems". Recommendation 530-15, (07-2015)
[2] E. Matricciani, C. Riva and L. Castanet, "Performance of the synthetic storm technique in a low elevation 5o slant path at 44.5GHz in the French Pyrenees", in Proceedings of the 1st European Conference on Antennas and Propagation (EuCAP '06), Nice, France, November 2006
[3] C. Kourogiorgas, A.D. Panagopoulos, S.N. Livieratos and G.E. Chatzarakis, "Investigation of rain fade dynamics properties using simulated attenuation data with Synthetic Storm Technique" in European Conference on Antennas and Propagation (EuCAP), Gothenburg, Sweden, pp 2277-2281, April 2013
[4] I. Sanchez-Lago, F.P. Fontan, P. Marino and U.C. Fiebig, "Validation of the Synthetic Storm Technique as part of a time series generator for satellite links". IEEE Antennas & Wireless Propagation Letters, issue 6, pp 372 - 375, 2007
[5] G. Drufuca, "Rain attenuation statistics for frequencies above 10 GHz from rain gauge observations". J. Rech. Atmos., vol. 1, Issue 2, pp 399-411.1974 [ Links ]
[6] E. Matricciani, "Physical-mathematical model of the dynamics of rain attenuation based on rain rate time series and a two-layer vertical structure of precipitation". Radio Science, vol. 31, issue 2, pp 281-295, 1996. [ Links ]
[7] B.O. Afolayan, T.J. Afullo and A. Alonge, "Seasonal and annual analysis of slant path attenuation over a 12 GHz earth-satellite link in subtropical Africa". International Journal on Communications and Antenna Propagation, in press, vol. 7, no. 7. 2017 [ Links ]
[8] A.A. Alonge and T.J. Afullo: "Seasonal Analysis and Prediction of Rainfall Effects in Eastern Southern Africa at Microwave Frequencies" Progress in Electromagnetic Research B, Vol. 40, pp. 279-303, 2012 [ Links ]
[9] M. Fashuyi and T. Afullo, "Rain attenuation and modelling for line-of-sight links on terrestrial paths in South Africa", Radio Science, vol.6, pp. 54-61, 2005 [ Links ]
[10] S. Malinga, P. Owolawi, and T. Afullo, "Computation of rain attenuation through scattering at microwave and millimetre bands in South Africa", in Progress in Electromagnetics Research Symposium, Taipei, 2013.
[11] G. Drufuca and I. I. Zawadski, "Statistics of rain gauge data". Journal of Applied Meteorology, Issue 14, pp. 1419-1429, 1975.
[12] P.A. Watson, G. Papaioannou and J.C. Neves, "Attenuation and cross-polarisation measurements at 36 GHz on a terrestrial path". URSI Commission F Open Symposium, pp263-287,1977
[13] B.N. Harden, J.R. Norbury and W.J.K. White, "Model of intense convective rain cells for estimating attenuation on terrestrial millimetre radio links". Electronic letters, issue 10, pp483-484, 1974
[14] G. Drufuca and R.R. Rogers, "Statistics of rainfall over paths from 1 to 50 km". Atmospheric Environment, issue 12, pp 2333 to 2342, 1978
[15] A.S. Frisch, B.B Stankov, B.E. Martner and J.C. Kaimal, "Mid-troposphere wind speed spectra from long term wind profiler measurements". Journal of Applied Meteorology. Issue 30, pp1346-1651, 1991.
[16] International Telecommunications Union, "Rain height model for prediction methods". Recommendation 839, 1992 [ Links ]
[17] International Telecommunications Union, "Propagation Data and Prediction Methods required for the design of Earth-space Telecommunication Systems," Recommendation ITU-R P.618-13, October 2009-2013.
[18] Olsen, R. L.; Rogers, D.V.; and Hodge, D. B. "The aRbrelation in the calculation of rain attenuation". IEEE Transactions on Antennas and Propagation, issue 26, no. 2, 547 - 556. 1978
[19] International Telecommunications Union, "Characteristics of Precipitation for Propagation Modelling", Recommendation ITU- RP.837-6; Geneva, 2012
[20] D. Maggiori, "The computed transmission through rain in the 1 - 400 GHz frequency range for spherical and elliptical drops and any polarization". Alta Freq., no. 50, pp 262 - 273, 1981
[21] A.K. Lwas, M.R. Islam, M.H. Habaebi, A.F. Ismail, K. Abdullah, A. Zyoud, J. Chebil and M. Singh, "Analysis of the synthetic storm technique using rain height models to predict rain attenuation in tropical regions". Proceedings of 5th International Conference on Computer and Communication Engineering: Emerging Technologies via Comp-Unification Convergence, pp. 220-223, ICCCE 2014
[22] J.S. Ojo and O.C. Rotimi, "Diurnal and seasonal variations of rain rate and rain attenuation on Ku-band satellite systems in a tropical region: A Synthetic Storm Technique approach". Journal of Computers and Communications, issue 3, vol. 10

