


Services on Demand
Article
 English (pdf)
 Article in xml format
 Article references
Indicators

Related links
-
 Cited by Google
 -
 Similars in Google
Share

 Permalink
SAIEE Africa Research Journal
On-line version ISSN 1991-1696
Print version ISSN 0038-2221
SAIEE ARJ vol.109 n.4 Observatory, Johannesburg Dec. 2018
ARTICLES
The economic reality of home PV systems: Matching consumption to generation
J.K. RouxI; T.M. HarmsII
IMegchem (Pty) Ltd , P O Box 2040, Secunda, 2302, South Africa
IIDept. of Mechanical and Mechatronic Engineering, University of Stellenbosch, Private Bag X1, Matieland, 7602, South Africa
ABSTRACT
The aim of this paper is to provide an economic viewpoint of the benefit of the installation of a home Photo Voltaic system. An hourly daily consumption and generation profile is created for every calendar month and the cost saving is applied to calculate the IRR and payback period. Different systems options are evaluated as well as feed in tariff options. The study was performed for two sample homes located in South Africa. The result suggests the optimum size for the PV system needs to be matched to the consumption in the peak generation month such that no excess power is generated. Therefore, home owners should not base the value of a system on the generation potential thereof but rather the savings potential matched to the consumption profile.
Keywords: Feed in tariffs, Home Photo Voltaic systems, Storage
1. INTRODUCTION
Home Photo Voltaic (PV) systems are growing in popularity, however, claims regarding the power savings from the grid are often based on the generation capacity of the systems and do not consider the actual consumption of the generated power [1]. The peak generation occurs during midday and peak home consumption occurs in early morning and evenings, a well-known mismatch in the South African situation [2].
In 2015 the cost of rooftop solar power was estimated at 81c/kWh (including financing at an interest rate of 9%) [3]. This estimated cost was already below the rates charged by municipalities in 2015 of 125c/kWh based on municipal bills reviewed [4].
The article presents a study in which the consumption of power in a home system throughout the year versus the generation is used to calculate the economic feasibility of such systems. Using the cost of the systems and the power saving the system realizes, the Internal Rate of Return (IRR) for various periods can be can calculated as well as the payback period.
Various generation options were considered as well as feed in tariff options, in which surplus power is supplied to the municipal grid.
Hourly consumption and generation profiles were generated for each calendar month. The profiles were then used to calculate the savings the home PV system would realize. In turn the savings were used to calculate the IRR and payback periods.
2. CONSUMPTION PROFILE
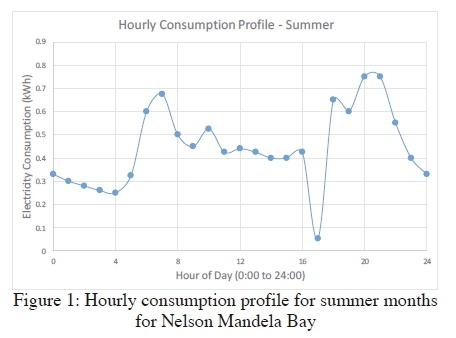
A daily consumption profile for summer and winter months was created based on the hourly residential consumption profiles (summer and winter) that were created in a pre-feasibility study for large-scale rollouts of Solar Water Heaters (SWHs) in middle and high-income areas located in Nelson Mandela Bay. The study by Davis et al. [5] generated consumption profiles for summer and winter months.
For the purpose of the study the months of May, June, July and August were defined as winter months with the other months seen as summer months in the South African context.

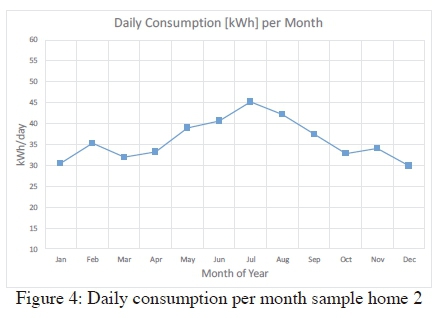
Two sample homes were evaluated to obtain monthly power consumption summaries. The first was used in a previous study for the feasibility of a solar power pool pump by Lewis [4]. The first sample home is located in Stellenbosch in the Western Cape, South Africa and the second in Tamboerskloof, also in the Western Cape, South Africa. The sample homes correspond to the classification of middle and high-income areas from which the daily consumption profiles were extracted.

The hourly consumption profiles for Mandela Bay was considered universally applicable in South Africa for the Western and Eastern Cape. The hourly consumption profile was combined with the monthly consumption patterns for the sample homes to obtain a daily average hourly power consumption patterns for each month.
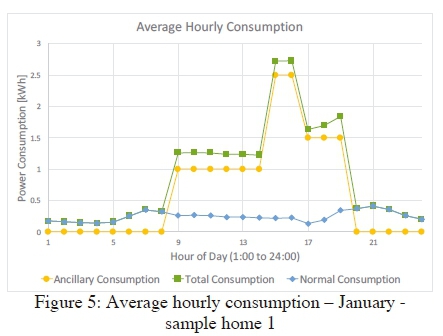
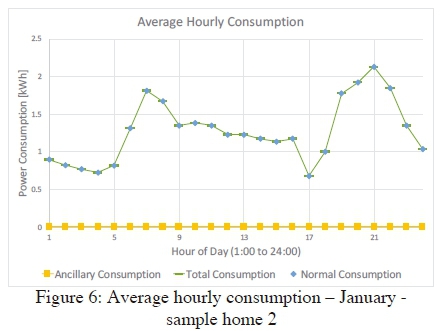
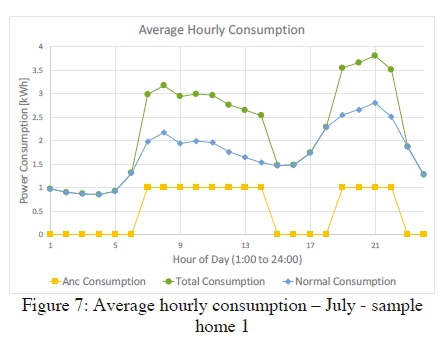
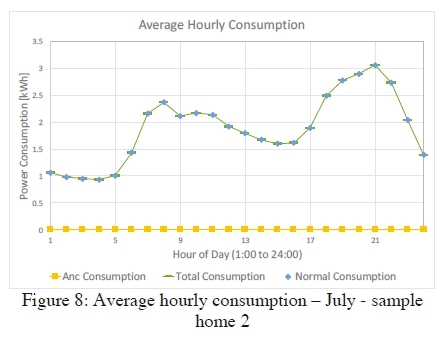
In the first sample home ancillary power consumption such as swimming pool pump, heaters and air conditioners were accounted for separately. The ancillary consumption was removed from daily consumption data to leave only normal home consumption (geyser, stoves, lights etc) to generate a baseline consumption profile. In the second sample home no ancillary power sources were considered.
Using monthly consumption summaries and the daily consumption profile, the consumption per hour in a day for each calendar month can be calculated to which the ancillary power consumption can then be added back to obtain the total hourly profile. As can be seen in the following figures considering ancillary power consumption separately has a significant influence on the hourly profile when comparing the two sample homes.
3. GENERATION PROFILE
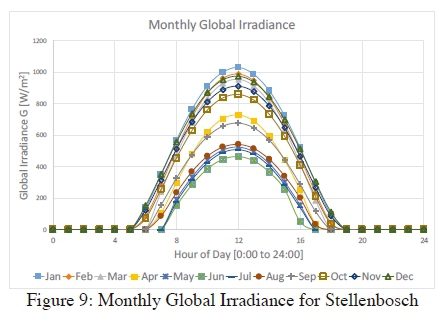
The generation potential of a PV installation is a function of the irradiance available, the efficiency of the PV panels and the number of PV panels.
Global irradiance for each calendar month was extracted on an hourly basis form from CM-SAF - PVGIS (Photovoltaic Geographical Information System) database for Europe and Africa) [6]. The location was specified as Stellenbosch, the first sample home location (similar to Lewis) [4]. An inclination of 10° (stipulated by sample home 1 owner) and an orientation of 180° (North) was specified for the PV panel plane.
Commercially available PV panels for home use have efficiencies ranging from 16.5 % to 14.6 % [7] for the purposes of this study an efficiency of 15 % was used.
If storage was included any generation surplus to the current consumption was stored and used when consumption exceeded generation. Storage levels were not allowed to decrease below the recommended depth of discharge [8].
Lastly the number of PV panels and other associated equipment was increased until the desired system potential was reached.
4. SYSTEM OPTIONS
Four (4) Options regarding the size, configuration and storage potential of the PV installation were considered:
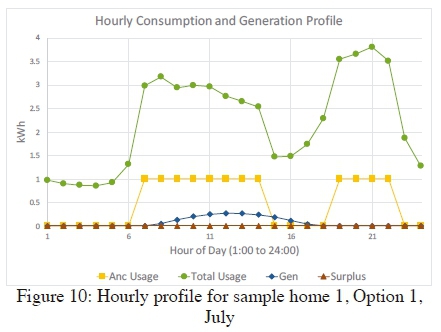
Option 1: PV panels only, sized so that at no surplus energy is generated on an hourly basis in any month.
Option 2: PV panels only, sized so that surplus energy can be generated on an hourly basis in some months but not in the highest demand lowest generation winter month.
Option 3: PV panels with storage batteries, sized to meet all daily demand in the lowest consumption highest generation summer month.
Option 4: PV panels with storage batteries, sized to meet all daily demand in the highest consumption lowest generation winter month.
The results of options 1 and option 4 for the month of July are shown in Figure 10 and 11 respectively.

5. ECONOMICS
The components considered in the financial calculations were the following:
a. The initial capital cost of the system includes the cost of the major components (PV panels, Inverters, Storage) making up 80 % of the total cost and an additional 20 % for cabling and installation costs based on quotation obtained by Lewis [4].
b. If feed in to municipality power grid was included any surplus generation was supplied to the grid. In order to supply surplus generation to the grid the municipality must have a feed in tariff scheme available which the home owner must join. The existing electricity meter in the home will also be replaced. If the generation is fed back to the grid without approval and the new meter, it could cause damage while also being illegal. The feed in tariff was based on the NERSA approved electricity tariffs for Stellenbosch [9], another feed in tariff option was also considered which was based on the City of Cape Town Residential Small Scale Embedded Generation tariffs [10]. The difference between the two tariffs is that the one for Stellenbosch is based on a time of generation rate and the one for Cape Town uses a flat rate.
c. Based on generation and consumption profiles, hourly municipality costs can be calculated and summed to a monthly cost, from which the monthly savings can be calculated through the year and used to pay down the initial capital cost monthly.
Two financial calculations were then performed:
-
Nett Present Value (NPV). The NPV calculation determined the number of months needed for the NPV > 0.
-
Internal rate of return (IRR). The IRR calculation determines the IRR at 5-year intervals
The option cost was set as the initial debt, with the difference between the monthly municipal costs with and without PV generation used as the payback amount or 'income'.
The financial calculations were performed monthly, with the tariffs escalated yearly based on current NERSA Multi Price Determination (MYPD 3 and 4) forecasts [11].
No interest on the initial cost was included in the calculation as the sample homes correspond to classification of middle and high-income areas the owners of which will be able to purchase the systems without the need of financing. Financing cost will only influence the result negatively with the no interest case being the best-case scenario. Similarly, no depreciation cost was included as the calculation applies to a primary private residence which does allow depreciation deductions on home improvements.
6. RESULTS
Table 1 shows the cost and sizes of the 4 systems for the two sample homes.
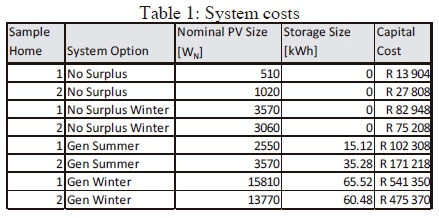
As can be expected, a significant cost penalty is paid for the increase in system size to provide generation and supply electricity for an entire day. The difference in consumption patterns between the two sample homes also leads to variance in system sizes for the seasonal options.
The results for the financial calculations for the comparative feed in tariff options are in Table 2 to Table 4. The case in which no power is fed back to the municipal grids mostly has the shorter payback periods (NPV > 0) and higher rate of returns. There is only one case where a feed in tariff provided a marginal improvement and that is for Sample Home 1, where no excess energy is generated in the high demand winter months on the Stellenbosch feed in tariff scheme.
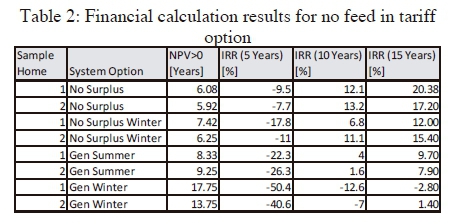
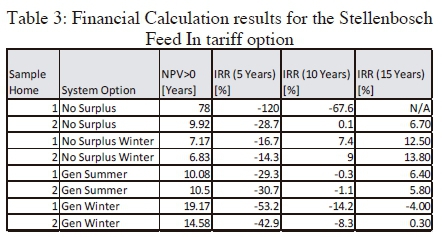

The difference between the perception that supplying excess energy to the grid will improve affordability and the results shown above is mainly due to an extra metering charge that is imposed by the municipalities. In the case of Stellenbosch there is a monthly reading charge and for City of Cape there is a daily service charge. There is also a difference between the feed in rates and supply rates. This results in the cases where there is no surplus generation with no feed in being most financially viable in terms of the NPV and IRR calculations.
The basis of service charges can be justified as follows; supplying excess energy to the grid/distribution network results in reverse power flow in the distribution network. This can be problematic due to the resultant voltage rise as networks which supply domestic customers which are designed as voltage limited networks which curb the
impacts of voltage drop, not voltage rise. When supplying to such networks a change in operating philosophy or physical changes in the network itself is required which incurs cost. These costs will have to be recovered by the operator (in this case the municipalities) [12]. This implies that the feed in tariff must be higher than the supply tariff to make it economically viable to the home user. However, this will make economically unviable to the municipal supplier.
It should be noted that even for the no surplus cases there is a difference in results between the 2 sample homes which is due to the daily consumption profile.
7. CONCLUSIONS AND RECOMMENDATIONS
The investigation into the economic feasibility of Home PV systems shows that the option with highest economic returns is a system which at all times supplies no surplus energy as current available feed in schemes do not improve the viability of home systems.
For optimum economic returns, home PV systems, should therefore be minimally sized in order not supply any surplus energy. However, determining the size of such a system is not easily accomplish as it relies on daily consumption profiles which are not readily available as opposed to using total monthly consumption which is. To ensure the optimum economic returns consumption profiles need to be identified and if possible altered. Alteration in the consumption profile should move consumption of energy to times when solar energy supply is at an optimum. An example of this behaviour would be that swimming pool pumps be used only when the solar can fully provide the pump power requirement. This could easily be accomplished through the use of an interlock relay.
The following recommendations regarding the configuration of a home PV system for optimum economic returns can be made:
a. The system should be sized based on minimum requirements.
b. If the daily consumption profile is known the system should be sized not to provide any surplus power based on the profile.
c. If the daily profile is not known, an estimation can be made using residential consumption profiles and ancillary consumption.
d. With an installation in place, the consumption and generation can then be monitored, and a consumption and generation profile can be established.
e. The consumption profile can then be adjusted to make use of the available generation profile.
f. With and optimum consumption profile an evaluation can then be performed to establish whether the generation capacity should be expanded.
REFERENCES
[1] "Is solar energy expensive energy?" available at http://www.ee.co.za/arucle/impact-rooftop-pv-distribution-networks-2.html [accessed 2 July 2018]
[2] "Explainer: South Africa's developing solar energy landscape" available at http://theconversation.com/explainer-south-africas-developing-solar-energy-landscape-50537 [accessed 2 July 2018]
[3] Y. Groenewald: "Solar power: Limited options for South Africans", City Press, 28 July 2015 available at https://www.fin24.com/Economy/Eskom/Solar-power-Limited-options-for-South-Africans-20150628 [accessed 2 July 2018]
[4] C. Lewis, PV Solar System Design and Analysis for a Domestic Swimming Pool Pump. Department of Mechanical and Mechatronic Engineering University of Stellenbosch, Final Year Project Report. October 2015. [ Links ]
[5] S. Davis, et al. (2011), Measuring the rebound effect of energy efficiency initiatives for the future: A South African case study. Energy Research Centre, UCT Research Paper. Available at: http://www.erc.uct.ac.za/Research/publications/11-Davis-etal-Rebound Effect Addendum.pdf. March 2011.
[6] "PV potential estimation utility", available at: http://re.jrc.ec.europa.eu/pvgis/apps4/pvest.php?lang=en&map=africa [accessed 21 January 2016].
[7] "Sustainable: Rigid Solar Panels", available at: http://www.sustainable.co.za/solar-power/solar-panels/rigid-solar-panels.html [accessed 8 August 2016]
[8] "Sustainable: Solar Batteries", available at: http://www.sustainable.co.za/solar-power/solar-storage-batteries.html [accessed 9 August 2016].
[9] NERSA, Electricity Tariffs for the period 01 July 2016 -30 June 2017 (NERSA Letter Ref NER/D/WC024/2016-17) available at http://www.stellenbosch.gov.za/documents/idp-budget/2016-6/3735-electricity-tariffs-nersa-approval-letter/file [accessed 12 September 2016].
[10] City of Cape Town, Utility Services - Electricity Services (Consumptive), available at (2015 https://www.capetown.gov.za/en/electricity/Elec%20Tariffs%20201617/ElectricityConsumptiveTari ffs-1617.pdf [accessed 13 September 2016].
[11] NERSA, NERSA's decision on Eskom's Revenue Application for the Third Multi-Year Price Determination period 2013/14 to 2017/18 available at http://www.eskom.co.za/CustomerCare/MYPD3/Documents/AnnouncementNERSAsdecisionEskomsRe venueApplicationMYPD2013-14to2018.pdf [accessed 18 September 2016]
[12] C. Carter-Brown: "The impact of rooftop PV on distribution networks", Energize, May 2015 available at http://www.ee.co.za/article/impact-rooftop-pv-distribution-networks-2.html [accessed 2 July 2018]

