


Services on Demand
Article
 English (pdf)
 Article in xml format
 Article references
Indicators

Related links
-
 Cited by Google
 -
 Similars in Google
Share

 Permalink
SAIEE Africa Research Journal
On-line version ISSN 1991-1696
Print version ISSN 0038-2221
SAIEE ARJ vol.109 n.3 Observatory, Johannesburg Sep. 2018
ARTICLE
Development of a plant health and risk index for distribution power transformers in South Africa
A. SinghI, II ; A.G. SwansonI
IEskom Holdings SOC Ltd, 1 Maxwell Drive, Sunninghill, Johannesburg, South Africa, Email: singhai@eskom.co.za
IISchool of Engineering, University of KwaZulu-Natal, Durban, 4041, South Africa, Email: swanson@ukzn.ac.za
ABSTRACT
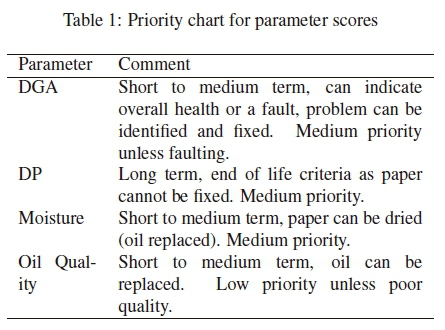
The health index is a part of the life cycle management tools for key assets. It allows for customization of maintenance plans for transformers depending on their condition. This optimises resources and allows for early detection of faults while allowing sufficient time to plan interventions to address problematic transformers. The index addresses the weighting between long term assessments (paper degradation), and short to medium term assessments (dissolved gas analysis). In addition to the Total Dissolved Combustible Gases method of dissolved gas analysis, methods looking at the ratio of the various gases present in the oil were employed for more accurate dissolved gas analysis interpretation. Oil quality indicators were also used in the index as the life of the paper relies on the quality of the insulating oil, which if allowed to oxidize, sludge and degrade would put the transformer in worse condition, it should also be represented in any health assessment of transformers. A case study was presented and indicated that with the correct weightings of the criteria, the plant health index would correctly predict whether a transformer would fail. For the transformers where the plant health index did not predict failure, a network performance and ancillary equipment score was introduced and combined with the plant health index for a risk index. It was shown that healthy transformers on poorly performing networks could be better categorised. It was also shown that a score for the ancillary equipment could be used to better categorise the transformers. The risk index allows for better inspection, maintenance and replacement of equipment.
Key words: health index, risk index
ABBREVIATIONS
AI Ancillary Equipment Index
BGR Basic Gas Ratio
CH4 Methane
C2H6 Ethane
C2H4 Ethylene
C2H2 Acetylene
CO Carbon Monoxide
CO2 Carbon Dioxide
DGA Dissolved Gas Analysis
DP Degree of Polymerisation
H2 Hydrogen
HI Health Index
NI Network Index
O2 Oxygen
OLTC On Load Tap Changer
PHI Plant Health Index
RI Risk Index
SFRA Sweep Frequency Response Analysis
TDG Total Dissolved Gases
TDCG Total Dissolved Combustible Gases
1. INTRODUCTION
Eskom is the state owned power utility in South Africa and is the biggest single generator, transmitter and distributor of electricity in Africa. Its Distribution Division comprises of nine operating units and contains a power transformer fleet of over 4000 transformers which range from 1-160 MVA with a maximum voltage of 132 kV.
A transformer forms a major portion of the capital investment required for a substation and therefore the life management of this asset cannot be over-emphasized. The specified life span of a power transformer employed in Eskom's distribution network is 40 years when operated at rated condition. This life span can be exceeded depending on various factors including design safety margins, operation, maintenance, and good life cycle management practices from the initial installation of the transformer. Conversely, the lack of transformer life cycle management can reduce the life span of a transformer. Health or condition assessments are a key ingredient in the lifecycle management of the transformer fleet. It allows for customization of maintenance plans for transformers depending on their condition rating. This optimises resources and allows for early detection of faults while allowing sufficient time to plan interventions to address problematic transformers. An accurate health index is therefore imperative for effective transformer life cycle management.
This paper presents an index from available oil sample data to categorise the health of a transformer. The transformer health index endeavours to improve on the shortcomings of simplified indices by including short to medium term information. It uses the available data more appropriately than using parts of indices available in literature. The health index would be used as an indicator for intervention and maintenance of the transformer or in some cases for the replacement of an end of life transformer.
The paper further presents a risk index to account for known causes of failures or known issues. The risk index allows for the correct monitoring, maintenance and replacement plans accordingly.
The paper is arranged in the following manner. Section 2 provides an introduction and contribution of the paper. Section 2 provides information on transformer health indices from various authors and how they have developed them. Section 3 provides information on ageing and breakdown mechanisms of transformers (i.e. what the risk is). Section 4 presents details on the development of the health index, network index, ancillary equipment index and the risk index. Section 5 presents a case study on the
2. TRANSFORMER HEALTH INDEX
Transformer health assessments should be based on four parameters, namely, the paper life, dissolved gas analysis (DGA), condition of the auxiliary components and electrical diagnostic tests. Saha presented a review on the modern diagnostic techniques used for the condition of a transformer, noting that time-based maintenance programmes are outdated and that condition based is a better option [1]. He noted that paper and DGA are the most useful for practical applications. Often, there is limited availability to assess the condition of the auxiliary components and electrical diagnostic tests due to outage constraints and/or a lack of resources.
The plant health index (PHI) is a convenient tool to combine the condition monitoring data into categories related to the asset's condition and provides a snapshot of the condition of the transformer. This allows for the planned implementation of corrective actions [2, 3].
Arshad and Islam [4] presented their work on the importance of using cellulose as a condition assessment tool, they emphasized the importance of the water content on ageing of the paper in the transformer. They presented a case study of a power transformer that demonstrated the importance of monitoring the activity around paper and the gases formed. This demonstrates the importance of understanding the degree of polymerisation in the transformer.
Naderian et al [2, 3] presented the most comprehensive work on a health index for power transformers and extended on the typical quantities such as DGA, oil quality, furfural and power factor to include other operational conditions, observations and history performance. They used a set of 20 inputs that are weighted according to importance. Importantly the furan analysis has a lower weighting than the DGA, power factor and load history. The also include the on load tap changer (OLTC) in their health index. Their health index gives an approximate percentage health where 100% is a perfectly healthy transformer. They further relate the health index to the expected lifetime and what the requirements are for maintenance or replacement. Haema et al [5] adjusted the weightings of this health index using over 21 factors. The DGA again outweighs the furan; they do include the on load tap changer in their condition assessment. Satriyadi Hernanda et al [6] also use the Naderian et al model for their health index. They also rate the DGA higher than both the oil quality and furan.
Miletic [7] presented work on medium voltage transformers where he combined the history, a visual inspection and a diagnostic inspection to formulate his index. The history included the age, loading, fault and maintenance criteria. The visual inspection included any identifiable defects. The diagnostic included infrared assessment, oil quality and winding tests (this is an offline test). Although the entire health index was not shown in the paper, there were high weightings for the age, faults history and winding test and he highlighted that the cumulative damage caused by through faults was important consideration for the health of the transformer.
Malik et al [8] presented a health index that looked at two indices, namely, tier 1 which considers oil analysis, power factor and excitation current, operation and maintenance history and age, and tier 2 which considers turns ratio and SFRA. Tier 2 is offline, whereas tier could be done online. The study included information about furan analysis and they combined this with the generation of individual gas concentrations and the generation of the total dissolved combustible gases as a score.
Taengko et al [9] developed a health index based on historical (loading, age, fault history) and condition factors (offline and online) tests. They determined the overall HI using a matrix that correlates the two sets of information to determine the health of the transformer.
Scatiggio and Pompili [10] have developed a health index that combines transformer dependent data such as dielectric and thermal conditions (DGA, furan), mechanical condition (Sweep Frequency Response Analysis), oil condition and non-transformer dependent data such as lightning frequency, substation layout, and re-occurrence of events at the site. They do not give details in this paper of the non-transformer dependent data; this is of importance for determining the risk of the transformer. They showed that the age of the transformer cannot be used alone in determining the condition of the transformer. They further presented an extension of the work to consider the number of dangerous events, and average damage per event with the health index to quantify the risk to the transformers [11]. This is an important consideration as external aspects such as lightning ground flash density, fault level at the transformer, climatic conditions can be considered part of the overall health index.
Heywood and McGrail [12] compared a linear health index to a logarithmic health index. They used 10 inputs with a linear score of 0 (good) - 10 (poor) and a logarithmic index with a score from 1 (good) - 100 (poor). They indicate that for the linear scale the scores for different transformers and problems could be similar, whereas when using the logarithmic scale, more specific problems can be identified.
One of the issues of the published information is that there are too many factors and as such it is difficult to get the weighting correct. There is no standard for which to adhere and all the weighting factors differ dependent on the region they are applied in. For large fleet sizes of power transformers it is not always practical that all factors can be taken into account.
Singh [13] undertook an investigation of the PHI used by Eskom on its power transformer fleet. The PHI was proposed by Geldenhuis [14] and used a simple combination of 60% degree of polymerisation (DP), 30% DGA (using only Total Dissolved Combustible Gases) and 10% moisture in paper to quantify the health of the transformer into four health categories. The PHI was weighted in favour of the DP and as such it really only considers the long term health of the transformers. A case study on failed transformers identified that healthy units had failed when they could have been detected as there were indications of an upcoming fault in the DGA, the oil was of poor quality and that the installation environment could have been used to identify risky transformers.
The PHI should form one input into a transformer risk index that also considers previous failures at site, external factors such as the location, lightning density and earth resistance, and network performance.
3. TRANSFORMER AGEING AND FAILURE MECHANISM
A transformer is in general made from non-ageing materials except for the insulation system. The copper conductors are insulated with normal cellulose Kraft paper or thermally upgraded paper. The insulation distances between the coils and between the coils and the yokes/clamping structures are filled with other solid insulation, and the entire active part is immersed in insulation oil. The insulation oil and the solid insulation of the transformer deteriorate with age.
Mineral insulating oils contain mixtures of hydrocarbon molecules and are made up of the CH3, CH2and CH chemical groups. Gas molecules are formed due to the degradation of the oil and include Hydrogen (H2), Methane (CH4), Ethane (C2H6), Ethylene (C2H4), and Acetylene (C2H2) [15].
The formation of the gases is dependent on temperature where at low temperatures H2, CH4 and C2H6 may form, at intermediate temperatures C2H4 may form and at high temperatures (such as when arcing occurs) C2H2 is formed [15].
The insulating oil ages in the presence of oxygen, heat and moisture. Breakdown of the oil results in the production of acid, moisture and sludge which impacts the integrity of the paper, reduces circulation and cooling, and further worsens the rate of ageing of the oil. Oil quality measurements such as electric strength, interfacial tension, and moisture in oil, acidity, and dissipation factor are used to determine the suitability of the oil to perform its function in the transformer.
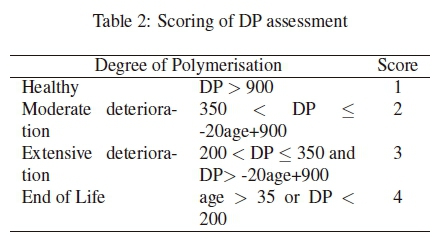
The insulating paper is made up of chains of polymers called furans. Longer chains equate to the greater integrity of the paper and when the paper deteriorates, these chains break down and dissolve in the oil. The furans in the oil are thus used to estimate the degree of polymerization (DP) of the paper insulation in a transformer. Alternatively, the degree of polymerization can be determined by analysing a sample of the paper insulation of the transformer but this comes with operational complications as the process is intrusive and involves removing the transformer from service. Estimation of the DP is therefore favoured by many utilities. New Kraft paper has a DP of around 1200 while paper with a DP approaching 200 has little remaining strength and is considered as approaching the end of its useful life [16].
The thermal degradation of paper insulation leads to the production of Carbon Dioxide (CO2) at low temperatures and Carbon Monoxide (CO) at high temperatures. Oxygen (O2) and Nitrogen (N2) are additionally present in the oil, but are not formed due to the degradation processes. The formation of CO2 and CO are however dependent on the amount of O2 in the oil [15].
While aged oil can be replaced or regenerated, there is no economical way of replacing the insulating paper, and therefore when it reaches its end of life, the transformer is considered to have reached the end of its useful life [16].
The ageing of transformers is best measured in terms of the insulating paper. DP should be measured and trended to monitor the rate of ageing such that informed decisions can be made regarding the replacement of the transformer before the insulating system fails. Transformers that reach their end of life in this manner are generally regarded as success stories as they provide a return on the capital investment outlaid for their installation.
The fundamental cause of paper ageing is heat which is generated by losses when the transformer is loaded. The ageing rate is accelerated by the presence of moisture and/or oxygen. There are various sources of moisture in the insulation system, which can either be external (atmospheric air through leaks or air ingress during maintenance), internal (as a by-product of ageing), or residual (improper drying at the factory). The main source of oxygen is from the atmosphere and is the primary reason that air bags are fitted in the conservator of modern transformers. The bag limits the exposure of the oil and paper to oxidation by confining the oxygen to the bag and occupying the space that would ordinarily be filled with air [17].
The effect of temperature on the ageing of the paper, and hence the effective remaining life of transformers is described by the Arrhenius equation, which shows that for an increase of 6 °C above 110 °C, the life of insulation is halved [17,18].
Eskom considers a DP of 200 as end of life, transformers are specified for a 40 year life.
The ageing is significantly more complicated in operation as the transformer load varies throughout the day and between different types of customers (e.g., domestic versus industrial). Over time, the transformer may develop leaks which may increase the moisture in oil and paper. This will cause premature ageing of the paper, and oil which may then result in the formation of sludge and more moisture that will have further negative effects on the transformer lifespan.
3.1 Failure Mechanisms
Failures in transformers consist of infant mortality failures which occur early on in a transformer life and wear out failures where the rate of failure typically increases with the age of the transformer.
Transformers may fail prematurely for several reasons. This includes mechanical failures from short circuit activity, failure of transformer components such as bushings and tapchangers, manufacturing defects and incorrect application of the transformer by the user.
Failure of ancillary components such as OLTC and transformer bushings often result in the failure of the transformer. There is also a great risk of fire when oil type tap changers and bushings fail. Modern vacuum tap changers are oil free and have reduced the maintenance requirements. Resin impregnated paper (RIP) or synthetics (RIS) have reduced the maintenance requirements as they are oil free.
Cigre Working Group A2 [19] presented a reliability study in 2015 where they categorised the failures of transformers over a number of years according to position of failure, failure mode and failure cause. Key findings for the transformers with highest voltage of 200 kV:
-
Position of failure: For all transformers below 200 kV, 59% failures occurred on the windings and 33% on the tapchangers and bushings. Fortransformers below 100 kV, 89% of the failures occurred on windings and 8% on the tapchangers and bushings.
-
Failure mode: For all transformers below 200 kV, 40% are dielectric failures and 20% are mechanical failures. For transformers below 100 kV, 70% are dielectric failures.
-
Failure cause: For all transformers below 200 kV, 15% of failures were due to ageing, 15% due to an external short circuit and 10% due to poor maintenance. For transformers below 100 kV, 25% of failures are due to an external short circuit.
It is clear that these transformers are greatly impacted by faults on the network as the majority of faults occurred on the windings, with dielectric failure the main mode and caused by short circuit. The severity of the impact of the fault on the transformer depends also on the distance of the fault from the transformer, as the fault current is damped by the impedance of the conductors on the distribution system. The transformer is under constant magnetic forces that are withstood under rated conditions by the mechanical clamping, bracing and build of the transformer. Under fault conditions, the current seen by the transformer exceeds rated values. The force experienced by the transformer is proportional to the square of the current. Increased or regular fault current occurrence impacts on the mechanical integrity of the transformer [20]. The impact may result in reduced clearances, shorted turns and deformed windings which may lead to dielectric failure.
Oommen presented a case study on the causes of premature failure of transformers on the Eskom transmission network in 2005 [21], where she illustrated that there were numerous incidents of through faults attributed to inadequate protection, inadequate clearances on the feeder, auto-reclosing selection and inadequate maintenance practices on the line. Although this is at the transmission level, the distribution level follows the same pattern. Mechanical failures are prominent on poor performing networks and it is imperative that the substation protection is functioning and correctly graded to prevent such failures. In extreme cases fault limiting reactors may be employed to restrict the fault current.
Other faults internal to the transformer such as thermal faults (hotspots) and partial discharges may develop into more serious conditions that eventually lead to the dielectric breakdown of the transformer insulation.
These faults can be monitored via the analysis of the gases in the transformer oil and from electrical tests on the transformer.
4. PLANT HEALTH INDEX
Indications of the condition of transformers and its components are possible by the collection and analysis of data pertaining to the operation of the transformer.
The PHI was developed from readily available pertinent data. It was designed to best use the data most available to the operator without impacting on system operation (i.e. data from the transformer oil that could be obtained without switching transformer off). The PHI focussed on the insulation in the transformer as this has the highest failure mode.
A network index (NI) and ancillary equipment index (AI) were added to the PHI to give a risk index (RI). The predominant cause of failure is the short circuit due to network and fault conditions. AI was included to account for failure of bushings and tapchangers.
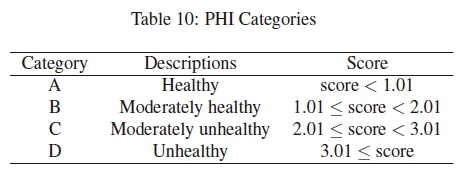
In IEEE standard C57.104, the interpretation of gas levels is defined into four condition levels related to the key gas concentration levels and the TDCG. The PHI and RI were similarly developed with four levels:
-
Category A (0-1) - Healthy transformer or no risk transformer
-
Category B (1-2) - Moderately healthy transformer or low risk transformer
-
Category C (2-3) - Moderate to unhealthy transformer or medium risk transformer
-
Category D (>3) - Unhealthy transformer or high risk transformer
A score was assigned according to a condition assessment of a parameter with a value of 1 - 4. The overall PHI would be sum of a percentage (a weight) of the parameters' scores. There were, however, instances where a higher score was used for the parameter to ensure that the transformer would be categorised as unhealthy. The health indices used by other authors in Section 2 are generally weighted overall and a very poor score in one area may not be able to detect a failing. Due to the parameters available, a cumulative score would better indicate an unhealthy transformer provided the input scores and weightings were correct.
4.1 Degree of polymerization (DP) via Furan Analysis
The DP is calculated using the furan analysis from the oil sample, the scoring is shown in Table 2. A score of 1-4 is used where 4 indicates the end of life of a transformer, and has a weight of 0.3 in the PHI. The expected life of a transformer in the Eskom Distribution network is 40 years and it is not expected that the paper will degrade to catastrophic proportions in the first 10 to 15 years, even if highly loaded. The DP is a long term assessment of the state of the transformer. A DP score of 4 would move the transformer into the next highest PHI category.
4.2 Dissolved Gas Analysis
There are several established techniques for the analysis of dissolved gases in transformer oil, including, amongst others, the IEC Basic Gas Ratio Method, Key Gas Method, Total Dissolved Gases (TDG), Total Dissolved Combustible Gases (TDCG), Duval's Triangle, and Doernenburg's Ratio Method. Some methods rely on the parts per million (ppm) of the different gases in oil for interpretation while others have preferred to look at the ratio of the various gases to each other.
Naderian et al [3] and Taengko et al [9] used key gases for their DGA scores, Naderian et al. state that they do not look at ratio methods as they are interested in a long term assessment. Malik et al [8] used the rate of change of gas concentration, this would be the most appropriate where available.
It is best to use multiple methods of oil analysis to diagnose faults as the various methods have strengths and weaknesses that may compliment each other. For example, methods that focus mainly on ppm values tend to struggle with the early detection of faults due to their reliance on ppm thresholds for analysis. Methods that rely solely on ratios may provide false indications as even minor changes in the composition of gases may create unfavourable ratios. Methods such as the Duval Triangle and Key Gas Method do not have a normal condition and are thus best used for root cause analysis once it is known that a fault exists [22].
For the TDCG to detect a fault in the transformer, it requires a combined ppm value for all the combustible gases to be greater than 430 ppm. Floating potential and early stage discharge type faults are generally typified by low levels of C2H2(10-50 ppm) and H2(100 ppm) with small amounts of CH4 (10-50 ppm), C2H6 (10-50 ppm) and C2H4 (10-50 ppm) also present. It is quite foreseeable that the TDCG would incorrectly classify a transformer with such a fault condition as operating normally.
Methods that employ analysing the ratio of the gases present in the oil will negate the drawbacks of solely considering the ppm value of gases in the oil. The basic gas ratio and the Eskom LTPHI method be incorporated into the scoring for DGA.
The dissolved gas analysis score consists of three components:
-
The total dissolved combustible gases, shown in Table 3, which carries a weight of 0.3 for the DGA score.
-
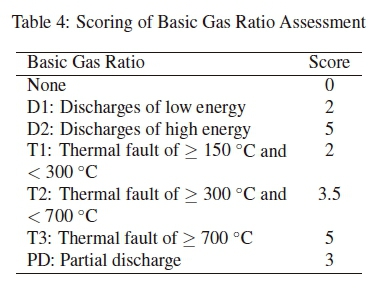
The basic gas ratio, shown in Table 4, which carries a weighting of 0.4 for the DGA score.
-
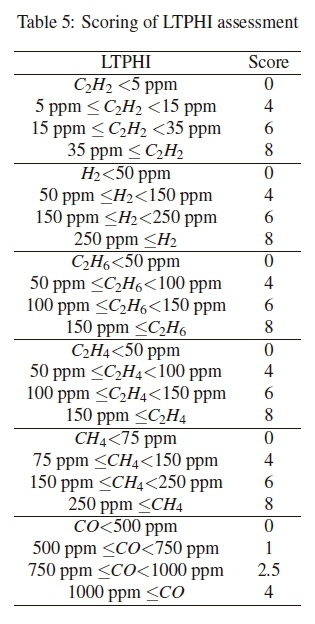
The LTPHI, shown in Table 5, relates the dissolved quantity of the individual dissolved gas to a score. The highest score is used for this component and carries a weight of 0.3 of the DGA score.
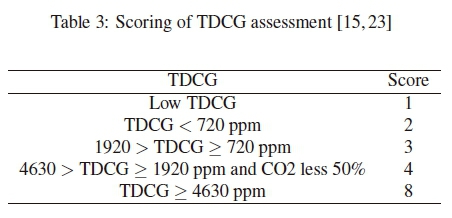
TDCG is formed by adding the concentrations of H2, CH4, C2H6, C2H4, C2H2 and CO to find the total concentration in ppm [15,23]. IEEE Std C57.104 defines the conditions and these have been used as the basis for scoring. A general score of 1-4 is used, but a score of 8 is used for where the TDCG is very high as this would indicate an unhealthy (faulty) transformer.
The IEC defines the fault using the Basic Gas Ratio consisting of CH4/H2, C2H2/C2H4and C2H4/C2H6 [15, 23]. The resulted ratio ranges relate to codes and are related to the condition below. The condition is related to a score according to the severity of the fault as shown in Table 4. If there is no fault in the transformer, there will be a score of 0, thus not influencing the DGA score. Faults such as PD: partial discharge, T1: low temperature thermal faults and D1 discharges of low energy could lead to larger faults in the medium term and are scored at 2 and 3. The higher temperature thermal faults (T2,T3) and high energy discharges (D2) are more serious faults and are assigned a value above 4. This would push the PHI into a higher category.
The LTPHI score relates the individual quantities of the gases to a score where the maximum value with a weighting of 0.3 is used for the DGA score. It is used to identify higher than normal concentrations of gases, the values are lower than the dissolved key gas concentrations conditions in IEEE Std C57.104, but the standard itself advises that this may be utility dependent. When the levels gases are low then the LTPHI has no impact on the DGA score as there is no fault condition, while there is a maximum of 8 if one of the gases is above the defined limits which would indicate a fault condition. CO which has the lowest scoring with a maximum of 4 as it is usually indicative of ageing whereas the other gases are indicative of faults.
The LTPHI is useful to cover for the shortcomings of using the TDCG alone. For example C2H2is indicative of arcing in a transformer and is generally present in low ppm concentrations e.g. 50 ppm. The TDCG could give a score of 2 (indicating no problem) and the LTPHI a score of 8. Gives a better combined score to the DGA and PHI.
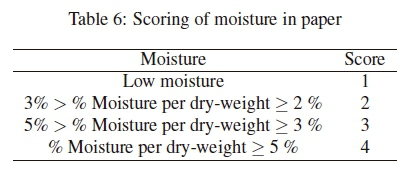
4.3 Moisture in Paper
Oil moisture content and temperature of the oil are the critical input variables for this assessment. Emsley et al [24], and Lundgaard et al [16] performed analysis and comparison experiments with the oil/paper insulation system for transformers, with the focus on the degree of polymerisation. They all demonstrated that water accelerates the ageing of paper.
The percentage moisture in paper is calculated using a moisture indicator based on the Piper's Chart [20]. Table 6 lists the criteria and scoring of the moisture in paper and the criterion. This criterion carries a weight of 0.3 of the total PHI.
4.4 Oil Quality
The life of the transformer is ascertained by the life of the paper, which in turn is relies on the quality of the insulating oil. The oil provides dielectric strength, and facilitates cooling of the transformer. The quality of the oil plays a major role in the insulation system of the transformer and if it is allowed to oxidize, sludge and degrade, it will place the transformer at a greater risk of failure. It should therefore be represented in any health assessment of transformers. The key oil quality indexes are electric strength, moisture in the oil, acidity, dissipation factor (tan delta) and interfacial tension (IFT). Only the electric strength, moisture in oil and acidity are used as they are readily available. The moisture in oil and acidity are important components of the ageing of the paper and high values lead to an increase in the rate of ageing [16].
The oil quality score consists of:
-
Moisture in oil, shown in Table 7
-
Electric field strength, shown in Table 8
-
Acidity, shown in Table 9
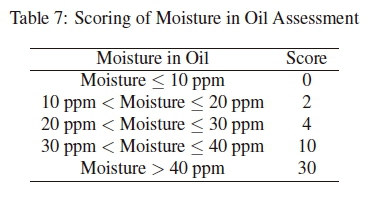
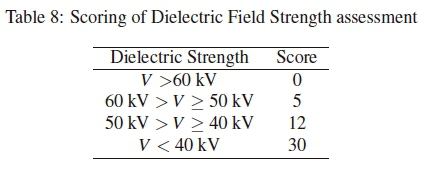
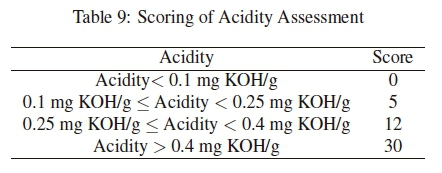
The maximum or the highest value of the scores is used. While the oil is of good quality it does not provide a great deal of information about the health of the transformer unlike DP or DGA, however, when the oil is poor it has a knock on effect on all the other parameters. Additionally, transformer oil is can be replaced, or conditioned, unlike the other parameters so it important that any issue is identified. For this score a non-linear scale is used for the assessment. The scores are set between 0 and 30 with a total weighting of the PHI of 0.1. If the oil is of good quality it will not affect the PHI as it will carry a weight of 0. However the highest score is set at 30 to ensure that even with a weighting of 0.1 that it would be categorised as an unhealthy transformer and in need of immediate intervention.
4.5 PHI Score
The PHI score is the sum of the weighted DP score, DGA score, moisture score and oil quality score to categorise the transformer as shown in Table 10. There are 14,000 possible PHI scores between 0 and 7.4. The DP, DGA and moisture score have low sensitivity to an input error. An error would give a maximum score of 0.9 which would push it into a higher category, transformers scored in a higher category would require maintenance or intervention and further oil samples would confirm the error. The oil score, however, has a high sensitivity, an error of 3 for poor oil quality would push it into the unhealthy category. Transformer oil can be replaced or conditioned, thus it requires immediate intervention if it is poor. Further oil samples would confirm the error.
4.6 Transformer Risk Index
The PHI is taken further to account for the network characteristics by using a network index (NI) and ancillary equipment index (AI). The two indices are combined with the PHI to give a risk index (RI). Table 11 lists the levels of the RI, effectively the transformer would only be placed in a higher risk category.
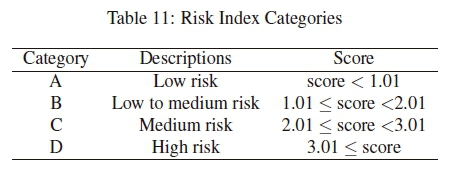
It is important to account for the network characteristics as the Cigre study [19] highlighted the impact of the external short circuit as a major cause of failure. The network characteristics uses a network index (NI) which includes:
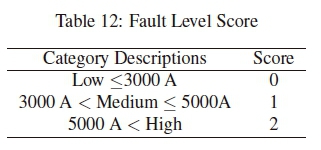
-
A fault level score, shown in Table 12, is used to quantify the fault level of the network where the transformers is installed. The higher the the fault level the more likely the transformer will experience damage to the windings in the event of a fault. This is a system design issue and would be allocated when a transformer is installed.
-
Network performance score, shown in Table 13, where a score is assigned according to the occurrence of faults on the particular network. Circuit breaker operations, which would include load shedding and faults on the network, dips on the network, reference to the location. This is currently difficult to quantify, it is an operational and maintenance issue and could be linked this to the SAIFI of the network.
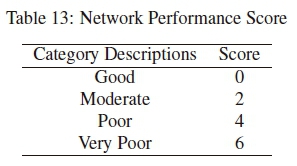
These scores each carry a weighting ratio of 0.3 to give a score of 0-2.4 and are in the form illustrated in Figure 1. A network with a low fault level and where there is a low occurrence of faults on the network would have a value of 0 and therefore not influence the RI. A perfectly healthy transformer installed on a very poor network with a low fault level would be pushed to category C and a very poor network with a high fault level would be categorised into D.
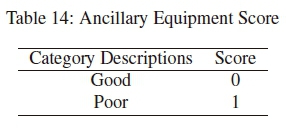
The ancillary equipment index (AI), shown in Table 14, uses a score assigned to known problematic bushings and tap changers (i.e. bushings over the age of 20 years, and/or modified tap changers). The ancillary equipment is a known fire hazard and a failure of either the tap changer or bushing would lead to a failure of the transformer even if the transformer is in a healthy state. The score would be applied to any transformer and removed when the bushing and tapchanger is assessed.
5. CASE STUDY
5.1 Comparison of Health Indices
Table 15 provides information obtained from an oil sample for three transformers T1, T2 and T2.
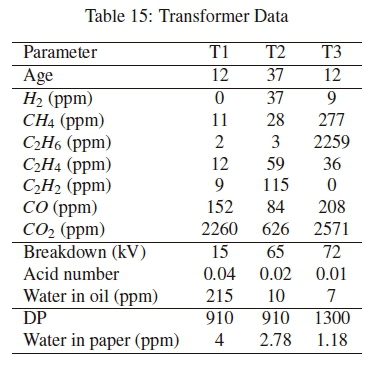
Table 16 compares the health indices from Naderian et al [3], Taengko et al [9], a simple PHI [13] (using 60% dp score, 30% TDCG score and 10% moisture in paper score) and the PHI in this paper. The HIs proposed by Naderian et al and Taengko et al have more elements than those used in this comparison as such were not use as those authors intended. This does however demonstrate that a HI needs to be developed based on the available information.
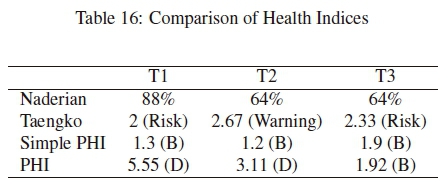
Transformer T1: The simple PHI indicated that the transformer was in a moderately healthy state, however this did not take into account the oil quality. The oil quality in this case is so poor that the transformer was in an unhealthy condition as indicated by the score of 5.55 in the PHI. The Naderian HI indicated a healthy transformer, while the Taengko HI indicated an unhealthy transformer. The weightings of the oil quality were not sufficient to indicate a problem.
Transformer T2: The simple PHI indicated that the transformer was in a moderately healthy state, the focus on TDCG for this HI does not take into account the high levels of C2H2, which indicated discharges occurring in the transformer. The PHI indicated that the transformer was in an unhealthy conduction with a score of 3.11. The use of a per gas indicator (LTPHI) and the BGR contributed to better categorising the score. Naderian and Taengko also use a per gas indicator while the Naderian and Taengko HIs demonstrated that the transformer was moderately healthy.
Transformer T3: The simple PHI indicated that the transformer was in a moderately healthy state, as does the PHI. There is high levels of TDCG, C2H6 and the BGR indicated a low temperature thermal fault. The transformer itself is in moderately healthy condition, the oil quality is good and the paper is try and has a high DP. Any further increase in C2H6 would push the transformer into category C. The Naderian and Taengko HIs also indicated a moderately healthy transformer.
5.2 Failed Transformers
The sample was from the Gauteng region where there were 986 transformers listed at the time of the study, there were 226 transformers with an invalid oil sample, these were excluded, there were 337 transformers without a date of manufacture, these were included where they could be as the health index relies on DP instead of age. The failed data was over a period of 3 years from 2014-2016. There were 40 failed transformers, with valid oil sample data only available for 27 of them.
Figure 2 illustrates the PHI of the transformers against age (excluding the samples without an age.) The healthy transformers are shown with a black asterisk and the failed transformers are illustrated with a blue dot. It is evident that there is minimal correlation between the PHI of the transformer and age. It is evident that the failures occurred for any age. Failures predominantly occurred for transformers categorised as unhealthy, although some failures occurred for healthy transformers necessitating the need for the additional indices accounting for network issues and ancillary equipment.
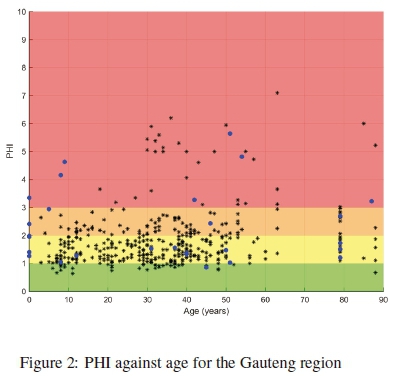
Figure 3 illustrates the PHI and RI of the 27 failed transformers with available pre-failure data.
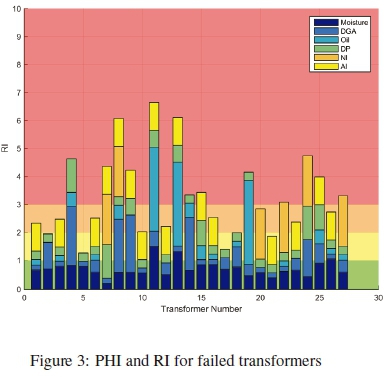
Transformers 4, 7, 15, 24 and 25 each had a high DP score indicating they were reaching their end of life and were categorised in C or D. Transformer 4 also had a high DGA score. It was correctly categorised in D. Replacements for these 6 transformers could been planned for.
Transformers 8, 9, and 14 all had a high DGA score with low DP and oil quality scores. These failures were predictable from the PHI. The DGA from transformers 8 and 9 had a TDCG of 2198 ppm and 5427 ppm respectively while the BGR showed D2 for both. The DGA from transformer 14 had a TDCG 3627 ppm while the BGR showed T3. The high score for the BGR ensured that the DGA score was high and the transformers were categorised as unhealthy. The source of the issue for these 3 transformers could have been identified and repaired or replaced prior to fault.
Transformers 11, 13 and 19 have poor oil quality score with low DP and DGA score and are correctly categorised as unhealthy. Transformer 11 and 13 both have a high moisture content, this is linked to the poor oil quality score. These failures were predictable from the PHI. The high score for the poor oil quality score is justified as these 3 transformers would have been identified for immediate intervention as the oil could have been replaced or conditioned prior to failure.
Transformers 7, 8, 20, 22, 24 and 27 were installed in networks where there multiple failures and known regular faults. The ages of the transformers ranged from 0 to 42 years old. It can be seen that the PHI puts transformers 7, 20, 22 and 27 into category B, while the inclusion of the network performance score of 6 shifts these to the correct risk categories of C and D. Transformers 8 and 24 were in PHI category D and C respectively, the inclusion of NI ensures the transformers are in risk category D. These transformers would have to be monitored more closely to ascertain the damage that is caused by the network performance.
The transformers with oil impregnated paper bushings were given an ancillary equipment score of 1 for any transformer over the age of 20 years.
For example transformers 1, 3, 6, and 10 are healthy transformers in category B of the PHI, with the inclusion of the ancillary equipment score the these transformers moved into category C of the RI. Transformers 15 and 25 shifted from PHI category C to RI category D. The failure for Transformer 16 was identified as a tapchanger problem, it can be seen from the PHI that the transformer was in a healthy state. The AI is important as it prioritises inspection, maintenance and/or replacement of ancillary equipment. If upon inspection the condition of the ancillary equipment was found to be good or upon replacement, the AI would be reset to 0.
Figure 4 illustrates the total number of operational transformers in each category (in red) with the number of failures overlaid (in blue) for the PHI respectively. It is evident that the majority of transformers are in category B and the highest number of failures occur here when only the PHI considered.
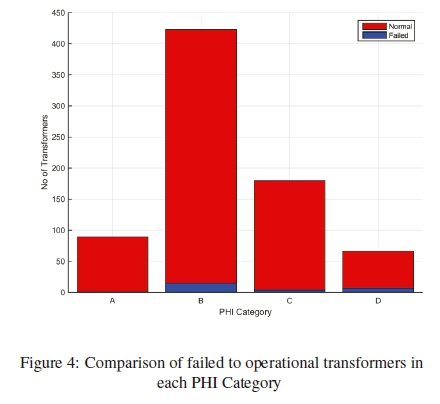
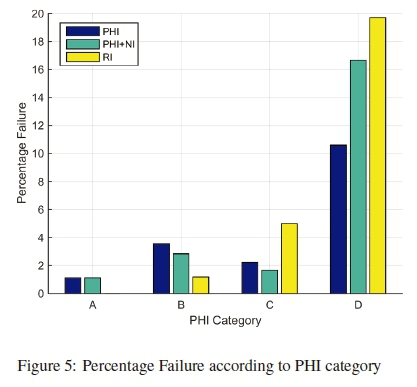
Figure 5 illustrates the percentage failure according to the category for the PHI, PHI+NI and RI respectively. The PHI indicates that the highest percentage failures occur in category B and category D. The failed transformers in category B would not be prioritised in an asset management plan as the PHI does not account for other factors that may lead to failure; it is clear that the addition of the network performance score and the ancillary equipment score pushes the failed transformers into the higher risk category. A number of the failures of these 27 transformers may have been prevented due to a prioritised asset management plan according to the PHI and RI.
6. CONCLUSION
The PHI was developed from available oil sample data including DP, moisture in paper, DGA and oil quality. The PHI was weighted so that the it could identify both medium term failure and end of life failure criteria. A RI was further developed which accounted the number of faults that could occur and the magnitude of those faults as well as the ancillary equipment. The inclusion of the NI and AI assists in identifying which transformers are at risk of failure and on which transformers inspection, maintenance, repair and/or replacement should take place.
The case studies on the individual transformers demonstrated how the PHI was formulated to account for the different available parameters. The case study on the failed transformers demonstrated that the PHI and RI would have identified transformers in need of intervention before failure. The PHI and RI are shown to be important tools for asset management in a utility.
ACKNOWLEDGEMENTS
The authors would like to thank Eskom for their support of the research through the TESP programme.
REFERENCES
[1] T. K. Saha, "Review of modern diagnostic techniques for assessing insulation condition in aged transformers," IEEE Transactions on Dielectrics and Electrical Insulation, vol. 10, no. 5, pp. 903-917, Oct 2003. [ Links ]
[2] A. Jahromi, R. Piercy, S. Cress, J. Service, and W. Fan, "An approach to power transformer asset management using health index," IEEE Electrical Insulation Magazine, vol. 25, no. 2, pp. 20-34, March 2009. [ Links ]
[3] A. Naderian, S. Cress, R. Piercy, F. Wang, and J. Service, "An approach to determine the health index of power transformers," in Conference Record of the 2008 IEEE International Symposium on Electrical Insulation, June 2008, pp. 192-196.
[4] M. Arshad and S. M. Islam, "Significance of cellulose power transformer condition assessment," IEEE Transactions on Dielectrics and Electrical Insulation, vol. 18, no. 5, pp. 1591-1598, October 2011. [ Links ]
[5] J. Haema and R. Phadungthin, "Condition assessment of the health index for power transformer," 2012 IEEE Power Engineering and Automation Conference, 2012.
[6] I. G. N. Satriyadi Hernanda, A. C. Mulyana, D. A. Asfani, I. M. Y. Negara, and D. Fahmi, "Application of health index method for transformer condition assessment," in TENCON 2014 - 2014 IEEE Region 10 Conference, Oct 2014, pp. 1-6.
[7] S. Miletic, "Asset condition assessment by health index benchmarking," 20th International Conference and Exhibition on Electricity Distribution - Part 1. CIRED., 2009.
[8] H. Malik, A. Azeem, and R. Jarial, "Application research based on modern-technology for transformer health index estimation," 2012 9th International Multi-Conference on Systems, Signals and Devices (SSD),, 2012.
[9] K. Taengko and P. Damrongkulkamjorn, "Risk assessment for power transformers in pea substations using health index," 2013 10th International Conference on Electrical Engineering/Electronics, Computer, Telecommunications and Information Technology (ECTI-CON), 2013.
[10] F. Scatiggio and M. Pompili, "Health index: The terna's practical approach for transformers fleet management," in 2013 IEEE Electrical Insulation Conference (EIC), June 2013, pp. 178-182.
[11] M. Pompili and F. Scatiggio, "Classification in iso-attention classes of hv transformer fleets," IEEE Transactions on Dielectrics and Electrical Insulation, vol. 22, no. 5, pp. 2676-2683, October 2015. [ Links ]
[12] R. Heywood and T. McGrail, "Generating asset health indices which are useful and auditable," Minnesota Power Systems Conference (MIPSYCON), 2016.
[13] A. Singh and A. Swanson, "Analysis and improvement of the plant health index used by Eskom to assess the condition of the power transformers in its distribution fleet," 19th International Symposium on High Voltage Engineering, Pilsen, Czech Republic, 2015, ISBN 978-80-261-0476-6.
[14] L. Geldenhuis, "Eskom distribution power transformer health index," Eskom Distribution Western OU-ZA, 2008.
[15] S. Chakravorti, D. Dey, and B. Chatterjee, Recent Trends in the Condition Monitoring ofTransformers. Springer, 2013.
[16] L. E. Lundgaard, W. Hansen, and S. Ingebrigtsen, "Ageing of mineral oil impregnated cellulose by acid catalysis," IEEE Transactions on Dielectrics and Electrical Insulation, vol. 15, no. 2, pp. 540-546, April 2008. [ Links ]
[17] SANS 60076-7, Power Transformers - Part 7: Loading guide for oil-immersed power transformers. South African National Standard, 2006.
[18] IEEE Std C57.91-2011, IEEE Guide for Loading Mineral-Oil-Immersed Transformer and Step-Voltage Regulators. IEEE, 2011.
[19] Working Group A2.37, "Transformer reliability survey," Cigre, 2015.
[20] J. Winders, Power Transformers - Principles and Application. Marcell Dekker, inc, 2002.
[21] A. Oommen, "A case study evaluation of the causes for the premature failure of transformers on the eskom transmission network," Cigre Study Committee B5 Colloquium, Calgary, CANADA, 2005.
[22] L. Moodley, K. Govender, S. Singh, and A. Goven-der, Application of Existing DGA Techniques on Failed Transformer Oil Condition Signatures. Doble Africa, Trans African Projects, 2008.
[23] IEEE Std C57.104-2008, IEEE Guide for the Interpretation of Gases in Oil-Immersed Transformers. IEEE, 2009.
[24] A. M. Emsley, R. J. Heywood, M. Ali, and X. Xiao, "Degradation of cellulosic insulation in power transformers .4. effects of ageing on the tensile strength of paper," IEE Proceedings - Science, Measurement and Technology, vol. 147, no. 6, pp. 285-290, Nov 2000. [ Links ]

