


Services on Demand
Article
 English (pdf)
 Article in xml format
 Article references
Indicators

Related links
-
 Cited by Google
 -
 Similars in Google
Share

 Permalink
SAIEE Africa Research Journal
On-line version ISSN 1991-1696
Print version ISSN 0038-2221
SAIEE ARJ vol.109 n.1 Observatory, Johannesburg Mar. 2018
Computational modelling for dish-to-dish coupling investigations on MeerKAT telescope
S. Kuja; P. G. Wiid
Department of Electrical and Electronic Engineering, Stellenbosch University, Stellenbosch, Western Cape 7600, South Africa, e-mail: stanleykuj@gmail.com and wiidg@sun.ac.za
ABSTRACT
The MeerKAT telescope will form part of the Square Kilometre Array (SKA) which will have orders of magnitude greater sensitivity than existing radio telescopes. Radio Frequency Interference (RFI) poses a great threat to such sensitive equipment. We characterize electromagnetic (EM) signals on a single dish structure using a physical scale model, computational electromagnetic (CEM) modelling and field measurement. The CEM code and method of moments frequency domain numerical technique are utilised throughout the study. We successfully achieve CEM model verification through measurement of a physical scale model in an anechoic chamber. The validated model is further verified with full scale on-site measurements. A transfer function determined from an incident electric field and the associated induced currents on various cables of a single dish structure is used to compare simulation and measurement. We use our corroborated CEM model to investigate dish to dish coupling in order to predict whether the MeerKAT system would be at risk. With a low power radiation of -70 dBm from a neighbouring dish, we predict coupled power of less than -120 dBm to the nearest dish.
Key words: Anechoic chamber, computational electromagnetic (CEM) modelling, dish to dish coupling, method of moments, radio frequency interference (RFI), telescope, transfer function.
1. INTRODUCTION
Advances in astronomy have led to the development and use of large single dish telescopes such as Arecibo [1], and arrays of smaller dishes such as the Low-Frequency Array (LOFAR) [2,3]. To this end the Square Kilometre Array (SKA) telescope is planned, which will be the world's largest and most sensitive telescope, consisting of thousands of receivers [4]. The MeerKAT is a precursor to this project and will form part of the SKA radio telescope phase 1 at a later stage [4].
Radio Frequency Interference (RFI) has the potential to degrade the ability of the SKA telescope to do the science for which it is being constructed [5]. Thus, a clean RFI environment is essential for the MeerKAT to achieve its scientific objectives. In this regard, measures have been taken by South African (SA) SKA to maintain the electromagnetic (EM) quietness of South Africa's Karoo site which lies within a remote area in the Northern Cape Province of South Africa. The SA SKA identified and declared the site radio quiet under the SA Astronomy Advantage Act [6]. Furthermore, they have ensured that electromagnetic compatibility (EMC) engineering is a constant component of the developing infrastructure for the initial SA SKA demonstrator known as Karoo Array Telescope (KAT-7) and MeerKAT [7]. Our research group, EMRIN (EMC Metrology Research and INnovation) has been actively involved in EMC related issues for the SA SKA. Some of the research areas that EMRIN has focused on include: lightning-induced RFI, lightning surge protection, and earthing [8, 9]; cable layout, structure shielding and cable transfer impedance [7,10].
The close proximity of the individual MeerKAT dishes at the core site could potentially lead to unexpected inter-coupling problems from low-level radiation due to currents on structure cables [11]. Mutual coupling between antennas used in radio telescope array had previously been done with electrically small antennas such as dipoles [12-15]. A similar idea has been utilized in complex and electrically large structures but within the structure itself, e.g. in-flight coupling configurations in aeroplanes [16-18]. In this paper we present MeerKAT to MeerKAT EM coupling investigations with special interest in the qualification of cabling and shielding around the receiver indexer (RI). The RI is one of the critical parts of the MeerKAT antenna that we focus on because of its sensitive receivers. We use physical scale model measurements to corroborate our computational model which is further validated with on-site measurements for full scale application. This approach enables us to effectively use our verified computational electromagnetic (CEM) model alone to predict electromagnetic interference (EMI) into and from the MeerKAT dishes. Our method is applicable in many areas of large electronic systems such as wind farms, future SKA and other radio astronomy installations or system for EMI prediction and assessment. For instance in propagation studies, a thoroughly validated model can simply be duplicated for multiple structures that can create a multipath effect with unique EMI environment.
The paper has been organized as follows: Section 2. gives a brief description of the MeerKAT telescope and describes the regions of interest (RI and the stub-up regions); Section 3. discusses verification procedure of the computational model; in Section 4. the key findings are underlined where we compare EM coupling on the actual MeerKAT dish with simulation results and discuss dish-to-dish coupling; we give our concluding remarks in Section 5..
2. THE MEERKAT TELESCOPE
The MeerKAT is an array of 64 dishes where each is a 13.5 m Gregorian dual off-set configuration. The first installed MeerKAT dish (M063) was raised on the 27th of March 2014 [4]. A photo of the dish taken by S. O. K. author at the core site in May 2015 is shown in Fig. 1. The yoke, pedestal, reflectors, RI and the back structure are some of the main parts of the MeerKAT dish visible externally. The following Sections 2.1 and 2.2 describe two areas of interest, where our main focus is on RI.

2.1 Receiver Indexer (RI)
The MeerKAT receiver indexer is a metallic turn-table where shielded electronic components, the UHF and L-Band receivers are installed. A maximum of four receivers can be mounted on the RI. It rotates each receiver to a precise position at the secondary focus of the ellipsoidal sub-reflector [19]. The sub-reflector and the RI are configured with the connecting structure such that they are below the main reflector (Fig. 1). This allows easy access and servicing of the RI region.
The SKA has conducted rigorous EMC compliance testing on the RI and pedestal structure. Cables from the RI are connected to various electrical components of the MeerKAT antenna, many through EMC filters. Connectors are used to join these cables to electronics which have different functions on the telescope. Some of the possible penetrable areas for RFI would be through cable shields or connectors around the RI. One of the main objectives was to predict where currents would be induced on the structure cables due to known incident fields and whether it would pose threat to the system.

A greater percentage of EMC problems are caused by inadequate layout and earth termination of cabling systems [20]. Thus, careful design of the MeerKAT structure cable entry point has been undertaken; a special earth stub-up has been used for shielding purposes. In addition, proper shielding should be maintained at the entry point by connecting cable shields with 360 degree connections [20]. The stub-up is situated inside and at the base of the pedestal. Quantified levels of shielding that the stub-up provides are found in [5, 11].
The outline of the two regions of the MeerKAT especially the RI is important for the basis of our investigation. In order to use a reliable scale model for our study, we need to know component parts of the MeerKAT and to simplify them for faster simulation runs. The description of the simplified model and its verification is discussed in the next section.
3. VERIFICATION OF CEM SCALE MODEL
This section describes how a 1/20th physical scale model is used for verification of an exact CEM model. The validated CEM model is then used in Section IV for characterization of RF coupling on the RI part of the MeerKAT structure.
3.1 MeerKAT 1/20h Scale Models
For a complex structure such as a radio telescope, simplification of the structure into a model by reducing its size is necessary in both anechoic chamber measurement where the model has to be placed inside the chamber and in computational modelling to reduce mesh size. Figs. 3 (a) and (b) present the simplified physical scale model and its precise CEM model respectively. The whole structure is mounted on a 120 mm by 180 mm conducting ground plane; largest ground plane size to get through a standard door. EM characterization of a single dish structure using the scale and CEM models has been studied in [9]. However, the initial models did not have the RI and stub-up components incorporated. These parts were retrofitted into the early model at our engineering mechanical workshop and later replicated in FEKO.

A close-up view of the RI section of the models are shown in Fig. 4. The RI in Fig. 4 (a) is a 1120th simplified version of a full scale model (Fig. 4 (b)) according to SA SKA mechanical design. The simplification was performed to reduce the electrical size of the structure in order to speed up simulation runs. Fig. 4 (c) is an exact physical scale model of Fig. 4 (a). The semi-rigid cable seen in Fig. 4 (c) connects the metallic box with the ground plane. The box represents shielded electronics behind the receivers on the actual MeerKAT telescope. A Sub-miniature version A (SMA) connector is joined with the semi-rigid cable below the ground plate to create one of the ports for scattering parameter measurements. The cable represents a worst case cable shield running to the pedestal in the absence of any bonding. Therefore, induced currents from fields should exhibit a worst case coupling.

3.2 Anechoic Chamber Measurements
The simplified physical scale model described in the previous subsection is used to obtain measured data for validation of our computational model. A two-port Agilent PNAX vector network analyser (VNA) placed outside the anechoic chamber is connected to the scale model inside the chamber and thereafter we calibrate it using a Short-Open-Load-Through (SOLT) procedure. We then carry out S-parameter measurements on the scale model from 45 MHz to 3000 MHz with 201 frequency points. The upper frequency value is limited by the computational cost of modelling while the choice for lower frequency is a matter of preference so that the model can be characterized from lower frequency values below the chamber's absorption limit. Usually, close coupling results are acceptable below the chamber absorption frequency.
However, this is not the case with plane wave antenna coupling measurements in the same chamber [21].
Fig. 3 (b) gives a measurement set-up of our multi-port scale model in the anechoic chamber connected to the two-port VNA. We terminate all unused ports with a 50 ohm load for comparison to simulation where every port is defined as 50 ohm. Measurement of S-parameters on each pair of ports results into both ports' reflection coefficients, S11 and S22 as well as the transmission coefficients S12 or S21. The measured S-parameters together with those from CEM modelling are compared in Section 3.4.
3.3 Computational Modelling
The use of computational modelling is essential in our research since on-site measurement opportunities are very limited. Various numerical full-wave and asymptotic high frequency solvers can be used in CEM modelling [22]. The main idea in these techniques is to discretise or mesh an unknown electromagnetic property, say, surface current or E-field [23]. We use MoM code full-wave numerical method due to its efficiency on metallic surfaces and open boundaries.
The Method of Moments (MoM): In MoM, the number of segments depend only on the shape and size of the conducting body [24]. Therefore, for electrically large or complex structures, MoM becomes computationally expensive in terms of runtime and memory required. However, access to our university's computational facility (Babbage) and Centre for High Performance Computing (CHPC) in Cape Town, South Africa, has made this method viable for our huge simulations. An extensive and successful use of MoM in EMC studies for KAT-7 is found in [25]. Babbage in our engineering department has a 256 GB RAM and 12 cores mostly occupied by a single simulation. While in the CHPC the solver load is administered by a way of parallel processing which allows it to be efficient in high-speed data processing.
Simulation: CEM model in Fig. 3 (b) is validated using scattering parameter measurements we have discussed in Section 3.2. We fix the impedance of each port as 50 ohm in order to request for S-parameters. With the allocation of five nodes and a total memory of 500 GB at the CHPC facility, we expected to run faster simulations over the entire frequency range (45 MHz-3000 MHz). In addition, the complexity of the model had been significantly simplified. However, the meshing of the CEM model in the MoM based code resulted into 129,846 discretised triangles. Each frequency point takes approximately three hours to be calculated and for this reason we chose an upper frequency limit of 1200 MHz.
3.4 Model Verification by Measurement
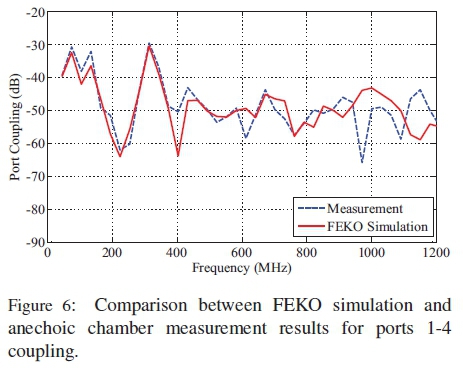
The comparison of the anechoic chamber measurement and simulated results are shown in Figs. 5 and 6. The plots show good agreement between simulation and measurement for reflection coefficient of port 1 (Fig. 5) and coupling between ports 1 and 4 (Fig. 6). Port 1 is a fixed port onto the dish sub-reflector while port 4 represents cabling to the RI (see Fig. 3 (b)). The variation especially of the nulls in Fig. 5 and the missing nulls in Fig. 6 (at around 950 MHz-1200 MHz region) is due to the limited number of frequency points calculated in the CEM model. Although our measurements are carried out between 45 MHz to 3000 MHz, the highest frequency used for data comparison in the graphs is the 1200 MHz limit we set in our simulations. Having verified our CEM model with anechoic chamber measurement, we use simulation results from the model alone for comparison to actual measurement of cable induced currents on the MeerKAT structure discussed in Section 4.3.

4. COUPLING FIELDS ON THE MEERKAT STRUCTURE
Low level radiated fields associated with currents on cable structures of the MeerKAT dish could cause interference to other nearby telescope systems. Industries such as aeronautics that also deal with sensitive systems prefer low level RF coupling test methods during EMC tests related to certification and qualification of air vehicles [18]. In our measurements we use known radiator fields which result in induced currents on the RI cables of the actual MeerKAT antenna. While in computational modelling, we generate segment currents by illuminating the verified CEM model with a plane wave as a source of undesired field. Taking into consideration the ground reflections and path losses, we relate the received E-field with coupled currents on the cables through a transfer function (TF) parameter which is then used to qualify on-site measurement with simulation.
This section has been divided into three subsections: the first part, Section 4.1, outlines our on-site measurement procedure in the Karoo; in the second part, Section 4.2, we validate the loss equation with simulation and highlight the impact of path loss and ground reflections on our coupling measurement; finally, Section 4.3, explains how we use a reliable model for coupling investigations on RI cables and compare the results with on-site measurement.
4.1 On-site Measurements in the Karoo
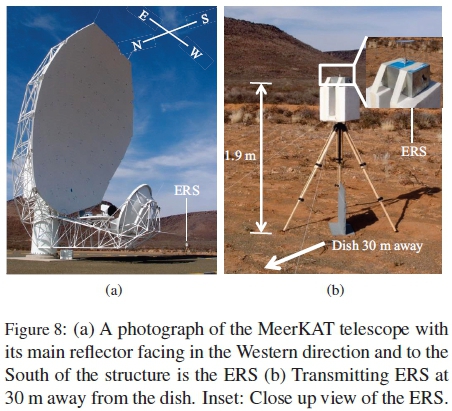
A calibrated standard radiator known as Emission Reference Source (ERS) from Laplace Instruments Ltd, operating from 30 MHz to 1000 MHz is placed 30 m to the South of the MeerKAT telescope (Fig. 8 (a)). Fig. 7 shows a plot of vertically polarized E-fields radiated by the ERS. We fix the radiator on a tripod stand at a height of 1.9 m off the ground as illustrated in Fig. 8 (b). The dish is tilted down to an accessible position with the RI being 3.2 m above the ground. We use a 1 GHz current probe and a hand-held Rohde and Schwarz FSH4 spectrum analyser (SA) to measure induced potentials on selected cable points around the receiver indexer. Due to safety concerns, the MeerKAT facility is powered down and the sensitive receivers are wrapped up by metallic caps to shield them from ERS emissions and other measurement equipment. The nearby KAT-7 dishes are switched off as well and we only had four hours to do all our planned measurements.

4.2 Validation of Free Space Path Loss (FSPL)
In ground wave propagation such as our measurements described in Section 4.1, the incident E-field received by the antenna depends on free space path loss (FSPL) and ground reflections (GR). Usually, the received wave is the sum of the direct and ground-reflected waves. In view of the path loss, we validate the data from free space loss equation with simulation. In practical units, the loss equation is given by [26].

where f is frequency in MHz and d is the path length in metres. We compute FSPL values in Matlab using the frequency range, 30 MHz to 1000 MHz and path length, 30 m, as in the actual measurement.
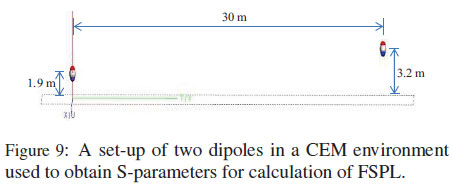
In our simulation set-up, we define two perfect electric conductor (PEC) dipoles of size 0.0625 m without the ground plane, i.e., homogeneous free space medium (see Fig. 9). One of the dipoles is 1.9 m above the "ground" while the other is at a height of 3.2 m off the same surface. They transmit or receive in the vertical polarization and the separation distance between them is 30 m. Through use of the Friis transmission equation, it is possible to relate FEKO-FSPL with the S-parameters requested from our simulation [27-29]. Using Fig. 10 to represent a linear arrangement of nodes and branches in series, with only one incoming (Pin) and one outgoing (Pout) signal, FSPL can be determined through Eq. (2) [27].


where |S21'|2 = power received/power radiated is the transmission coefficient which gives the loss-factor due to the surrounding medium. The S-parameters, S11,S22,S21 and gain, G, are obtained directly from our simulation. In order to account for GR, we include a ground plane in our set-up given in Fig. 9. We use different ground planes separately. The first one is an infinite ground plane (PEC or perfect magnetic conductor (PMC)) which gives a worst case GR. In the second case, we use soil characteristics of the very-dry ground, medium-dry ground and wet ground provided in [30], to define a dielectric medium for the ground plane. The results for the six set-ups: with no ground plane; with PEC ground plane; with PMC ground plane; with very-dry ground; with medium-dry ground; with wet ground are discussed in the following paragraph.
The comparison between the simulated prediction of FSPL and the theoretical formulation of Eq. (1) is given in Fig. 11. The plots for FSPL from simulation and the loss equation is within 1.5 dB. The degree of losses predicted by PEC or PMC ground reflections is less except at 420 MHz frequency for PEC and below 100 MHz as well as at 860 MHz for PMC. The PEC or PMC ground-reflected wave add out of phase with the direct wave, so they cancel and result into more loss and less power at the receiving dipole. However, due to the signals adding in phase at about 800 MHz (PEC) and 410 MHz (PMC) we realize 6 dB less loss. Since the difference between simulated FSPL and PEC/PMC is within 5 dB, real ground (Karoo soil) reflections would be less than 5 dB in comparison to FSPL. From the three soil characteristics obtained from the International Telecommunication Union standards, very-dry ground would reasonably represent the Karoo soil (semi-arid region). The plot for very-dry ground in Fig. 11 is in between the FSPL and PMC for most part of the frequency band. For vertical polarization, the PMC gives a good approximation of real ground characteristics whose reflection coefficient approaches minus 1 [31]. Actually, the graph for very-dry ground follows a similar trend as PMC. For the discussions presented in this section and given that discretisation of the dielectric medium for the Karoo soil requires more computational power, we use our verified FSPL to compute the E-field received at the MeerKAT cables with 5 dB margin of uncertainty.

4.3 RF Coupling Investigations Using Verified 1/20th CEM Model
We use our verified model in Fig. 12 for EM coupling studies and thereafter compare the results with on-site measurements described in Section 4.1. Firstly, the model is tilted to have a similar orientation compared to the full scale measurement set-up (refer to Fig. 8 (a)). Secondly, we illuminate it with a normalised 1 V/m plane wave with a vertically polarized E-field. By utilizing MoM code, we discretise the CEM model over a frequency range of 600 MHz to 3400 MHz which is equivalent to 30 MHz to 170 MHz in full scale terms. The choice for the lower frequency depends on the lowest frequency the ERS operates while the upper frequency is limited by the memory available in our computational cluster, Babbage. In order to have the required induced segment currents we include two wires 1 and 2 (see Fig. 13 (a)) which represent real cables that run to the RI of the MeerKAT dish.


For better evaluation of our results from on-site measurement and computational modelling, we consider a transfer function (TF) given as.
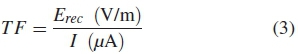
where Erecis the received E-field at the MeerKAT structure or model and I is the wire segment induced current. From Eq. (3) we derive the units of TF as dBμΩH/m. In actual measurements, cable induced RF current (I) in μA is calculated by dividing the current probe output (V) in μV with the known probe transfer impedance (ZT) as shown in Eq. (4).

Due to the impact of FSPL, we expect that Erecused in Eq. (3) to be less than the E-field radiated by the ERS. In linear terms Erec is computed using Eq. (5).

where Eradis the ERS radiated E-field plotted in Fig. 7.
The measured versus simulated results which have been scaled down in frequency are presented in Fig. 14. Along the plot of our measured results are the error bars which indicate the standard deviations from the mean. In the same Fig. 14, simulation results agree with measurement to within a 5 % error margin except at 70 MHz and 120 MHz. Effect of resonance is suspected at a 70 MHz frequency on the actual cable and at 120 MHz on wire segment. Cable length between bonds in actual measurement is not precisely represented in the exact scaled length in the CEM model. The first resonance at 40 MHz corresponds to the wire length of 37.5 cm from the receiver indexer then what follows is multiple wavelength resonances at 80 MHz and 120 MHz. As for the actual dish the bonding occurs at 4.3 m (cable length) from the RI and this corresponds to 70 MHz frequency where the resonance is observed. Hence, the reason our plots fall outside the error margin at those specific frequencies.

We exclusively use simulation to do further analysis on our results. We compare transfer function due to induced currents on segments 42 and 43 on wire 1 shown in Fig. 13 (b). The results give good agreement as depicted in Fig. 15. A relative error of less than 0.02 is attained which is equivalent to a desired confidence level greater than 98 %. Therefore, it is reasonable to say that the magnitude of the induced segment currents on same "wire 1" is the same. We then investigate dish to dish RF coupling by duplicating our CEM model in two positions that represent the actual MeerKAT dishes, M000 and M002. The two telescopes give the shortest separation distance of 29.4 m, closer than any other pair in the core area. Fig. 16 shows dish M002 exposed to unwanted emissions from M000 and its orientation is such that maximum power couples into the structure. As a guideline for safeguarding the equipment, the SA SKA set a conservative figure of -100 dBm as the maximum power that would saturate MeerKAT receivers. We define our radiated power (Prad) as -18 dBm and -70 dBm and for each Prad we request for the received power in dish M002. The results in Fig. 17 show that when Prad is -18 dBm and -70 dBm the level of coupled power is above and below -100 dBm, respectively. Therefore, we predict that a radiation of -70 dBm from one dish does not put a nearby dish at risk within the frequency range specified in Fig. 17. However, -18 dBm of power radiated around the core area could possibly damage the receiver even when the telescopes are in stowed positions and powered down; especially, during on-site RFI measurement campaigns where various radiating equipment are used.


5. CONCLUSION
The application of computational modelling has increasingly become a reliable research tool in EMC aspects particularly in our research group. A CEM scale model has been verified with scaled and full-scale measurements for RF coupling studies on the MeerKAT telescope structure. The investigations show that our actual measurement and simulation agree to within 5 dB except at two resonance points (70 MHz and 120 MHz). We have successfully illustrated the implementation of the MoM code in free space path loss predictions and ground reflections in order to fully account for their contribution in the coupling of EM signals on the MeerKAT structure. Our predictions show that MeerKAT systems at the core site are still safe when exposed to radiated power of -70 dBm. With more MeerKAT dishes being erected at the site less measurement opportunities are available due to the sensitivity of the facilities. Therefore, our validated CEM model can be used with confidence for further coupling studies as the SKA awaits full commissioning of the entire array of 64 dishes.
ACKNOWLEDGMENT
This work was supported by the South African SKA under Grant 87440. The author would like to thank A. Bester, S. Combrink and J. Andriambeloson for their help with measurements. FEKO licensing provided by Altair Hyperworks to Stellenbosch University has played part in our computational modelling. Our measurement campaign arrangements supported by C. Van der Merwe and N. Kriek from the SKA offices is very much appreciated. The author is also grateful to W. Croukamp for workshop technical support and D. Ludick for assisting in accessing the Centre for High Performance Computing (CHPC) in Cape Town, South Africa. Permission by Council for Scientific and Industrial Research (CSIR) to use CHPC is acknowledged.
REFERENCES
[1] Asimov, I., Eyes on the Universe, Andre Deutsch Ltd., London, England, 1976.
[2] Boonstra, A. J. and S. van der Tol, "Spatial filtering of interfering signals at the initial low frequency array (LOFAR) phased array test station," J. Radio sci., Vol. 40, 1-16, Aug. 2005. [ Links ]
[3] Zaroubi, S., G. van Diepen, A. R. Offringa, A. G. de Bruyn, S. Daiboo, and G. Harker, "The LOFAR radio environment," J. Astronomy and Astrophysics, Vol. 549, No. A11, 1-15, Jan. 2013. [ Links ]
[4] "Square Kilometre Array SKA Africa," Accessed on: July 2016. [online]. Available: http://www.ska.ac.za.
[5] Kuja, S. O., "Characterization of RF Signal Coupling into MeerKAT Telescopes." M. S. thesis, Dept. Elect. and Electron. Eng., Stellenbosch Univ., Stellenbosch, S. Africa, 2015. [ Links ]
[6] Jonas, J. L.,"MeerKAT-The South African Array With Composite Dishes and Wide-Band Single Pixel Feeds," Proc. IEEE, Vol. 97, No. 8, 1522-1530, Aug. 2009. [ Links ]
[7] Reader, H. C., P. S. van der Merwe, A. J. Otto, P. G. Wiid, P. K. Langat, J. Andriambeloson, and C. van der Merwe, "South African SKA demonstrator systems: Evolving RFI mitigation investigations," in GASS, 2011 XXXth URSI, Instanbul, Turkey, 1-4.
[8] Wiid, P. G., H. C. Reader, and R. H. Geschke, "Radio Frequency Interference and Lightning Studies of a Square Kilometre Array Demonstrator Structure," IEEE Trans. Electromagn. Compat., Vol. 53, No. 2, 543-547, May 2011. [ Links ]
[9] Wiid, P. G., and H. C. Reader, "Towards electromagnetic characterization of MeerKAT Telescope," in URSI GASS, 2014 XXXIth URSI, Beijing, China, 1-4.
[10] Reader, H. C., P. S. van der Merwe, A. J. Otto, P. G. Wiid, J. A. Andriambeloson, P. K. Langat, and B. Kruizinga, "EMC techniques for a complex project: Karoo Array Telescope," in Aerosp. EMC, 2012 Proc. ESA Workshop, Venice, Italy, 1-4.
[11] Kuja, S., and P. G. Wiid, "Characterization of RF signal coupling between MeerKAT telescope structures," in APWC, 2015 IEEE-APS Topical Conf, Turin, Italy, 1004-1007.
[12] Tokarsky, P. L., and S. N. Yerin, "Mutual coupling between antennas used as array elements for a low frequency radio telescope," in Antenna Theory Techniq. (ICATT), 2013 IX Int. Conf., 269-272.
[13] Kerkho, A., and H. Ling, "Use of a receive-based definition of coupling between two antennas to reduce mutual coupling effects in a low frequency radio telescope array," in IEEE Antennas Propag. Soc. Int. Symp., 1-4, July 2008.
[14] de Lera, A. E., N. Razavi-Ghods, D. G. Ovejro, R. Sarkis, and C. Craeye, "Compact representation of the effects of mutual coupling in non-regular arrays devoted to the SKA telescope," in Electromagn. Advanced Appl. (ICEAA), 2011 Int. Conf., 390-393.
[15] Daniel, J. P., "Mutual coupling between antennas for emission or reception-application to passive and active dipoles," IEEE Trans. Antennas and Propag., Vol. 22, No. 2, 347-349, Mar. 1974. [ Links ]
[16] Weston, D. A., "Comparison of techniques for prediction and measurement of antenna to antenna coupling on an aircraft," in 10th Int. Symp. Electromagn. Compat., 228-233, Sept. 2011.
[17] Medgyesi-Mitschang, L. N., "Coupling Effects on Electrically Small Antennas on Aircraft," in IEEE Int. Symp. Electromagn. Compat., 1-6, Aug. 1977.
[18] Romero, S. F., A. L. Morales, M. A. Cancela, and G. G. Gutirrez, "Validation procedure of low level coupling tests on real aircraft structure," in EMC EUROPE, 2012 Int. Symp., 1-6.
[19] "13.5 m MeerKAT Dual Offset Antenna: System Description Document." Vertex Antennentechnik GmbH, General Dynamics Company, 2013.
[20] Williams, T., EMC for Product Designers, 2nd ed. Newnes, ISBN: 0750624663, 1996.
[21] Wiid, P. G., "Lower uncertainty PCB-LPDA antenna measurement on open area test site," in IEEE ICEAA, 2013 Int. Conf., 911-914.
[22] Jakobus, U., and G. Smith, "State of the art of electromagnetic modelling in FEKO," in 6th EUCAP, 853854, Mar. 2012.
[23] Davidson, D. B., Computational Electromagnetics for RF and Microwave Engineering, Cambridge Univ. Press, New York, NY, USA, 2005.
[24] Ludick, D. J., E. Lezar, and U. Jakobus, "Characteristic mode analysis of arbitrary electromagnetic structures using FEKO," in IEEE ICEAA 2012 Int. Conf., 208-211.
[25] Wiid, P. G., "Lightning Protection and Radio Frequency Interference Mitigation for the Karoo Array Telescope," Ph.D. dissertation, Dept. Elect. and Electron. Eng., Stellenbosch Univ., Stellenbosch, S. Africa, 2010. [ Links ]
[26] Phillips, C., D. Sicker, and D. Grunwald, "A Survey of Wireless Path Loss Prediction and Coverage Mapping Methods," IEEE Commun. Surveys Tuts., Vol. 15, No. 1, 255-270, Feb. 2013. [ Links ]
[27] Pozar, D. M., Microwave Engineering, 4th ed., John Wiley & Sons, Inc., Hoboken, NJ, USA, 194-200, 2012.
[28] Phiri, T. J., D. B. Davidson, and P. G. Wiid, "Propagation modelling for the South African SKA site," in APWC, 2015IEEE-APS Topical Conf., Turin, Italy, 1329-1332.
[29] Seybold, J. S., Introduction to RF Propagation, John Wiley & Sons, Inc., Hoboken, NJ, USA, 2005.
[30] ITU-R, "Electrical Characteristics of the Surface of the Earth," Int. Telecommun. Union, Tech. Rep. Rec. ITU-R P.527-3, 1992.
[31] Hviid, J. T., J. B. Andersen, J. Toftgard, and J. Bojer, "Terrain-Based Propagation Model for Rural Area-An Integral Equation Approach," IEEE Trans. Antennas and Propag., Vol. 43, No. 1, 41-46, Jan. 1995. [ Links ]

