


Services on Demand
Article
 English (pdf)
 Article in xml format
 Article references
Indicators

Related links
-
 Cited by Google
 -
 Similars in Google
Share

 Permalink
SAIEE Africa Research Journal
On-line version ISSN 1991-1696
Print version ISSN 0038-2221
SAIEE ARJ vol.108 n.4 Observatory, Johannesburg Dec. 2017
On harmonic emission assessment: a discriminative approach
B.B. PetersonI; J. RensI; M.G. BothaI; J. DesmetII
IFaculty of Engineering: School of Electrical, Electronic and Computer Engineering, North-West University Potchefstroom, South Africa
IIGhent University, Campus Kortrijk, Belgium
ABSTRACT
An improvement in the assessment of harmonic emissions as contributed by renewable generation such as a Photovoltaic (PV) plant, at a Point of Connection (PoC) to a distribution network, is needed. Both the generating source and the distribution network contribute to the voltage harmonic distortion at the PoC and single-point measurements cannot be used to quantify the relative contributions of each source.
IEC 61000-4-30 Class A PQ measurements are used as a reference dataset for engineers and can be obtained simultaneously at different points in a network in an attempt to better understand the relative contribution by the source of distortion and the voltage supply network.
The opportunity to improve the CIGRE/CIRED C4.109 approach by means of multiple-point synchronized network data is shown to be significant in the qualification of the statistical method but lacks the quantification in calculating the harmonic emission of a non-linear load. The CIGRE/CIRED method can be improved by only considering those harmonic currents identified as emission as some harmonic currents could be the result of background harmonic voltages in the supply network.
Constraints in using IEC 61000-4-30 time-aggregated rms voltage and current values to support the assessment of harmonic emission using field-measured data is lastly shown as the calculation method and measurement uncertainty influence the compliance to grid code requirements on harmonic emissions.
Key words: harmonic emission; CIGRE/CIRED C4.109, IEC 61000-4-30, harmonic vector method; synchronized multiple-point measurement.
1. INTRODUCTION
Electrical utilities in many countries increasingly integrate sources of renewable energy into distribution networks. The injection of this energy has to comply with grid code requirements to ensure that the interaction of the Renewable Power Plant (RPP) with the utility network, causes minimal additional operational risk to the Distribution System Operator (DSO).
Harmonic emission is a key concern when Photovoltaic (PV) plants connect to the distribution network by means of inherently non-linear interfaces [1]-[3]. The IEC 61000-3-6 [2] guides utilities on how to determine the emission limits for sources of waveform distortion, i.e. how to apportion harmonic emission. These principles can be applied to both consumers of electrical energy (non-linear loads) and generators of electrical energy, such as PV plants, that can be considered as sources of harmonic currents.
While IEC 61000-3-6 advises on how to theoretically calculate harmonic emission limits, the problem lies in determining, by practical measurements, if the loads or RPPs are meeting the limits that the utilities have specified.
Sources of waveform distortion exist all over in a practical network. The voltage harmonic distortion at a PoC will be due to both the existing background harmonic voltages in the supply network (distribution system in this case) as well as the harmonic voltages resulting from harmonic currents injected by the RPP into a non-zero supply network impedance.
The use of single-point measurements of harmonic active power to assess harmonic emission is conclusive when only one source of waveform distortion exists in the network [3]. A practical network requires a different approach, such as measuring harmonic active powers at all nodes simultaneously and with sufficient accuracy in time-stamping.
Further complications on harmonic emission assessment are that results obtained in the present can be different in the future, as supply network impedances are not fixed and the emission of a specific RPP, the collective interaction between different RPPs and the distribution network is not fixed.
Many academic concerns and proposals on the measurement of harmonic emission can be found in literature [4]-[6]. However, engineers require a practical approach to assess the harmonic emission of an RPP once commissioned. The measurement methodology in use may not compromise electrical network theory. It has to be fair to both the owner of the distribution system and the RPP.
Opportunities to be used in a practical distribution network for the measurement of harmonic emission at RPPs are investigated in this paper with the view to a pragmatic solution to be used by engineers.
The assessment of harmonic emission described by the CIGRE/CIRED C4.109 working group [6] and IEC 61000-3-6 is first evaluated to understand if the deficiency of single-point measurements could be improved by using synchronized multiple-point measurements. Practical field data obtained at a 10 MVA PV plant connected to a 22 kV distribution system is subjected to known methods [7] with the objective of discriminating between values emitted from a non-linear load and those values being absorbed by the non-linear load within the constraint of an rms 10 minute aggregated value. Measurement uncertainty contributed by the different elements in the instrumentation chain is lastly shown to be an important consideration in the assessment of harmonic emission.
2. HARMONIC EMISSION: THEORETICAL CONSIDERATIONS
IEC 61000-3-6 [2] defines the principle of emission as a phenomenon by which electromagnetic energy emanates from a source of electromagnetic disturbance. The injection of a harmonic current into the distribution system is generally modelled by a Norton current source as illustrated in Figure 1.
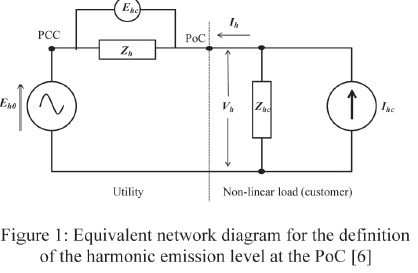
Where:
Vh: Harmonic voltage phasor at the PoC.
Ih, : Harmonic current phasor.
Eho : Background (in the supply system) harmonic voltage phasor at Point of Common Coupling (PCC).
Zh: Complex supply impedance.
Zhc : Complex impedance (consumer/RPP installation).
Ihc ' Harmonic sources present in the consumer/RPPs installation.
Ehc ' Voltage harmonic emission phasor.
It is evident that the harmonic phase angle difference between Vhand Eh0will determine the extent of Ehc.
The IEC 61000-3-6 document defines harmonic emission in context of voltage as a harmonic voltage phasor (Uhi) at each harmonic number as illustrated in Figure 2 below.

Once a distorting load has been connected to a node in the network, the voltage harmonic phasor U4(pre connection) at that node will change to a new value U4(post connection) due to the harmonic emission at a harmonic number h contributed by a distorting load i, denoted UM.
The challenge from a technical point of view is to assess the emission contributed at the PoC by a RPP if background harmonics already exist in the distribution system. Fundamental principles of measurement methodologies are briefly considered next.
3. PARAMETERS TO BE MEASURED FOR HARMONIC EMISSION ASSESSMENT
3.1. Coherent network data based on IEC 61000-4-30
Coherent data (where both voltage and current data are measured simultaneously and synchronized over different measurement instruments) could support the better understanding of dynamic conditions in a power system.
IEC 61000-4-30 Class A specifications [8] set the requirements of recording power quality parameters to be accurate, repeatable and comparable, regardless of the measurement equipment as long as it is Class A compliant.
Aggregation reduces the fundamental measurement quantities derived from 200 ms voltage and current phasors (also known as the 10/12- cycle block values) to 3 s, 10 min and 2 hour rms values [9] as visualized in Figure 3. Phase angle information is lost during the aggregation process.

Of special interest is the synchronization requirement of IEC 61000-4-30 Class A, Edition 3 document. A 10/12-cycle block is determined by counting the number of zero crossings in the reference voltage waveform. The instantaneous frequency [10] due to localized reactive power control can change continuously, resulting in different time lengths of sequential 10/12 cycle blocks. Re-synchronization is then needed at the boundaries [8] and the method to do this, is prescribed by the IEC 61000-4-30.
Time-stamping of voltage and current phasors is implemented by means of GPS, an accuracy better than 1 μs in absolute time is achieved, regardless of the geographical location of the instrument. The 10/12-cycle phasor values obtained from two different instruments are then coherent and comparable. Zero crossings of the voltage waveform at each measurement location will have negligible impact on the 1 μs uncertainty.
To ensure coherent data the travelling time of a waveform is calculated. The travel time of a signal in a lossy transmission [11] line is:

Where:
t : time [s].
l : length [m].
vp : phase velocity [m/s].
L : series inductance per unit length [H/m].
C : series capacitance per unit length [F/m].
A 22 kV overhead distribution line, as evaluated in this paper in Figure 5, for example, causes a negligible delay in the zero crossing of the voltage waveform [12] due to a travelling time of around 50 ns.


Coherent harmonic voltage and current phasors have to be considered to fully understand harmonic emission. A referenced measuring methodology such as the IEC 61000-4-30 10/12-cycle block values cause a huge volume of the data that compromise the practical use.
The fundamental principle of emission set by Figure 1, requires coherent recordings of the source voltage harmonic phasor at the PCC (Eh0) and at the PoC (Vh) to determine, (a) the emission voltage value Ehcand (b) to test for | Vh| > |Eh0|. When | Vh| < |Eh0|, the RPP is regarded as "absorbing" the harmonic current and those current harmonics should then not be included in the assessment of harmonic emission.
Application of the CIGRE/CIRED C4.109 harmonic assessment method is based on the aggregated voltage and current harmonics, resulting in the loss of phasor information. It is possible, due to accurate time-stamping of the 10-12-cycle block values, to obtain aggregated voltage and current rms harmonic values that are perfectly aligned (coherent), but it requires consideration of the aggregation interval to recognise the dynamic conditions in a network. Different sources of harmonics in the network interact differently with each other when the network state changes.
Within the above constraints, this paper evaluates if coherent recording of IEC 61000-4-30 Class A PQ parameters can improve the CIGRE/CIRED C4.109 assessment of harmonic emission. The aim is to discriminate between those harmonic currents being emitted by the RPP and those harmonic currents resulting from the network harmonic voltages.
3.2. Consideration on IEC61000-4-30 data aggregation
The IEC 61000-4-30 standard assumes [9] steady state operation with a nearly constant frequency. Aggregation will then not change the statistical mean and variance of parameters.
The volume of 10/12-cycle block measured data is first reduced by a factor of 15 for 3-s values and then again to 10-min values, an additional reduction factor of 200.
These IEC 61000-4-30 aggregation intervals are compared in [13]. It is shown by a statistical approach that large variation in the minimum and maximum levels exist when different aggregation time intervals are considered, however little variation is reported when applying statistical confidence levels such as the 99th, 95th, 5th and 1st percentile to the aggregated data based on the different aggregation intervals. It is concluded that the time interval of aggregation is negated when a statistical approach is taken.
4. CIGRE/CIRED C4.109: HARMONIC EMISSION ASSESSMENT
CIGRE/CIRED working group C4.109 [6] aims to provide a practical solution to the analysis of harmonic emission. Single-point measurements of the power system in the steady state condition are used. Switching of the distorting load to induce a transient condition is not always practical as used by other methods [14], [15] and this is why the CIGRE/CIRED method seems to be a preferred and practical method of harmonic emission assessment.
Voltage and current harmonic rms values are recorded at the PoC (single-point measurement) in Figure 1. The source and load impedance is then superimposed onto a scatter plot of the voltage and current harmonic rms values as shown in Figure 4. The goal is to identify the most dominant contributor to the voltage waveform distortion. Supply network harmonic impedance is normally known and supplied by the utility, but the impedance of the RPP could be a challenge as it is not necessarily fixed and not easy to model accurately [16].
If the points on the scatter plot concentrate around the system impedance locus Zh, then the load (RPP) is the dominant emitter at the point of evaluation. The opposite is true when the points concentrate around the load impedance locus Zhc. Should the values concentrate between the two loci, then the load and the network both contribute towards harmonic emission. This method is evaluated by application on field data, in section 6.
The voltage harmonic emission |EhC| in Figure 1 is then calculated in (4) by multiplying the 95th percentile value of the harmonic current Ihwith the reference network impedance Zh:

Ehc is regarded as harmonic emission when | Vh| > |Eh0|. This criterion aims to discriminate between current harmonics "absorbed" and "generated" by the load (RPP).
5. THE "GLOBAL PQ INDEX" AND THE "TOLL ROAD" METHOD: COHERENT DATA
A multiple-point measurement system collecting synchronized voltage and current measurements is reported [17] to be able to identify the contribution to harmonic distortion of a single source of harmonics in a network with sources of distortion located all over. First, a "Global PQ Index", vk, identifies the harmonic source. Then, the "Toll Road" method aims at assigning a "contribution" to emissions by a specific source of distortion. It was shown [17] that both methods yield inconsistent results, even though the "Toll Road" method is based on synchronous multiple-point measurements.
Synchronized measurements are reported [18] as successful by finding the R, L and C values of nodes from the measured voltage and current values derived from IEC 61000-4-30 [8] 10/12-cycle phasor values. Norton equivalent circuits are then used in modelling the system under investigation [18]. However, a practical implementation requires detailed and accurate network parameter information and advanced analysis skills. Generalization of the method could be constrained, as each case of integrating a RPP will be unique from a network fault level and configuration perspective.
6. FIELD APPLICATION OF CIGRE/CIRED C4.109 METHOD
IEC 61000-4-30 voltage and current harmonics, up to the 63rd , were coherently measured at the PoC of a PV plant and at the PCC as shown in Figure 5.
6.1. Analysis of single-point measurements
The CIGRE/CIRED C4.109 method [6] defines emission as the condition when | Vh|> |Eh0| since a zero supply network contribution does not exist [19] in real networks. For the purposes of illustration, the analysis in this paper is limited to the 5th and 7th harmonic.
The scatter plot of the voltage and current harmonics at the PV plant PoC is presented in Figure 6 for the 5th harmonic using the 10-min aggregated values and in Figure 7 for the 3-s values. Figure 8 and Figure 9 present similar scatter plots for the 7th harmonic.


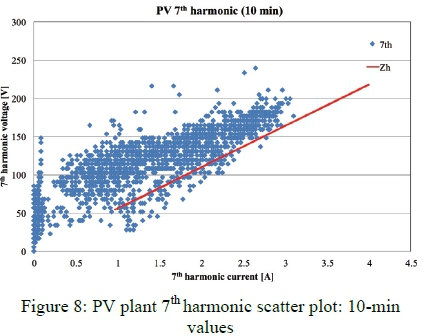

Zh is the network system impedance calculated from the fault level at the PV plant, assuming a linear relationship with respect to frequency. No information on the RPP impedance exists, however [16] indicates that the RPP impedance is not required in this method for harmonic emission assessment.
Figure 6 and Figure 7 indicate that both the RPP and distribution network contribute to harmonic emission at the 5th harmonic as distinct groupings are observed in 2 different areas. The results for 10-min and 3-s values are similar.
Figure 8 and Figure 9 indicate the dominance of the RPP to emission at the 7th harmonic, as all values are located around Zh(impedance of the distribution system). The RPP may be considered as the source of the 7th harmonic distortion at the measurement point.
The results of Figures 6 - 9 shows that qualification on harmonic emission is achieved by the CIGRE/CIRED C4.109 method, but it lacks quantitative information on the relative contribution by a single RPP and by the distribution network. The value of these scatterplots is in the confirmation that contribution to the 5th harmonic cannot be based by simply assuming that all current harmonics are injected by the RPP as emission. The resolution of the time aggregation did not add value to the interpretation, as results obtained by 3-s and 10-min values are similar due to only rms values being taken into consideration. Qualitatively, the 3-s and 10-min values will not change the interpretation of the results.
Synchronized 3-s measurements at the upstream 22 kV PCC busbar (Eh0) and at the PoC of the PV plant (Vh), were used to test for emission based on the condition | Vh|> |Eh0|. This enabled a reduction of the dataset used in an assessment of harmonic emission, aiming at fair results.
Results of Figure 6 showed that the 5th order voltage harmonic is a result of harmonics injected by both the RPP and the supply network. The value of discrimination is demonstrated in Figure 10 and Figure 11 by the comparison of 5th harmonic voltage and current 3-s values over a 24-h period based on the principle that |Vh| > | Eh0| signifies emission.
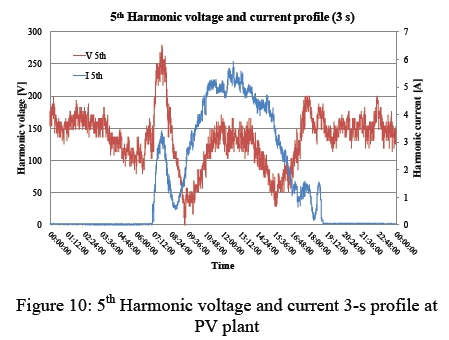

The voltage and current profile in Figure 11 is the result of discrimination between "emission" and "absorption". Some voltage and current harmonic values were rejected based on the emission principle depicted by Figure 1 and are highlighted by means of green circles. The data set in Figure 10 is reduced to only reflect emission.
Revised scatterplots based on the above principle are now possible as shown in Figure 12. Only the 3-s values are used for this purpose. Figure 12 does not change significantly if compared to Figure 9 except for the indicated area. Two distinct groupings remain.

Note in Figure 11 that discrimination does not remove values near the peak of production. All current harmonics are classified as emission when production is significant for the 5th harmonic. The 95th percentile value will thus yield similar results for all methods irrespective of discrimination or time integration as only values at low power output is removed from the data set.
Application of the discrimination criteria for the 7th harmonic voltage and current 3-s values do not change the results significantly as shown in Figure 13. The PV plant is confirmed as the dominant contributor of the 7th harmonic with all values concentrated around the impedance profile of the supply network.

7. CALCULATION OF HARMONIC EMISSION
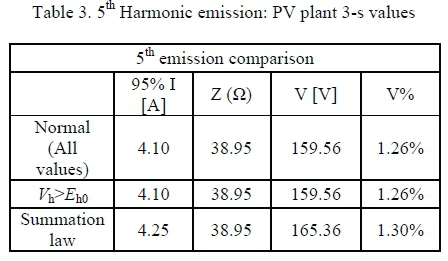
The selection of the harmonic emission calculation methodology will affect the grid code compliance status of an RPP. This section presents the results from different emission calculation methods applied to the same data set.
The PV plant's emission is calculated based on the CIGRE/CIRED C4.109 method, but using three different approaches:
1. Using all single-point data measured at the PV plant.
2. Using all multiple-point values that qualify as emission as per | Vh | > |Eh0| criteria [6].
3. By application of the IEC 61000-3-6 general summation law [2].
For method 3, the voltage drop across the line is obtained from synchronized recordings at the PoC and PCC and then divided by the impedance of the 22 kV line, resulting in the emission current |Ih| of Figure 1. The general summation law compensates for the lack of phasor measurements as it estimates the rms value of the emission phasor in Figure 2.
A conservative summation exponent is used in the general summation law [20]. It is based on rms values as data aggregation retains only rms values. Correct summation requires knowledge of the harmonic phasors.
The 95th percentile of the harmonic currents is used in the CIGRE/CIRED C4.109 method and 95th percentile of the harmonic voltages is used for the summation law. Table 1 and 2 list the results for the 5th and 7th harmonic respectively for the 10-min values.

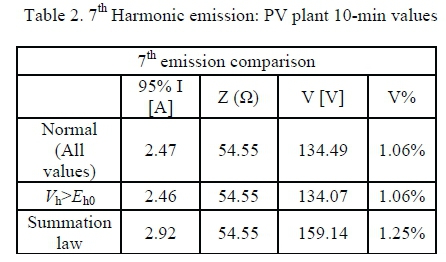
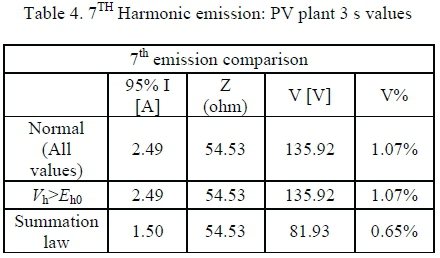
A larger difference exists between the 10-min and the 3-s emission values for the 7th harmonic when obtained from the summation law. This is due to the small difference between the rms values at the PoC and at the PCC.
For a pragmatic engineer required to design a filter to mitigate the harmonic emissions, the deviations in results of the calculation methods presented will hold no significance; however, in grid code compliance the method selected will hold significance especially when the RPP is marginally exceeding the harmonic emission limit for compliance.
7.1. Measurement uncertainty
An aspect often neglected in grid code compliance is the accuracy of the measured data, which may further impact the RPP's compliance status.
Measurement is an estimation of the measurand [21] due to the variability around the accuracy of the measurement equipment employed. Uncertainty in the measurement can be calculated as a qualitative level of confidence in the measurements, which forms an integral part in proving grid code compliance
Figure 5 details the high voltage network where measurements took place. Instrument transformers and measurement equipment enable the quantification of high voltages and high currents [22], however, these instrument transformers and measurement equipment contain inaccuracies and uncertainties, which will influence the resultant measurements.
A guide [21] exist detailing methods on how uncertainty may be qualified. This guide details the combined standard uncertainty by taking the positive square root of the combined variances (5) of each component in the measurement circuit.

Where:  is the sensitivity coefficient (selected to 1 in this case)
u2(xi) is the value of square of the equipment variance
Table 5 is a list of the components used within the current measurement system (Figure 14) and the related variances. Table 6 is a list of the components used within the voltage measurement system (Figure 14) and the related variances.
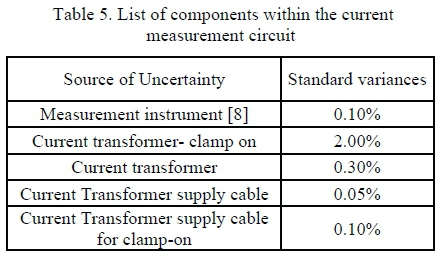


Using a rectangular distribution, the uncertainty in the current and voltage measurand is calculated at 1.16% and 0.13% respectively. It is noticed that the clamp-on current transformer is the major contributor towards the measurement uncertainty within the current measurand. The uncertainty in the current measurand can be greatly reduced to 0.14% if a direct current measurement system is employed.
The uncertainty in measurement must be taken into consideration for the measured data used in the calculation of emission in Table 1 to 4, used for grid code compliance. Uncertainty in measurement becomes significant when RPPs emissions are near the emission limits; disputes often arise as grid compliance is absolute, meaning non-compliance can result in a license being revoked.
8. CONCLUSION
Due to the injection of harmonic currents by sources of renewable energy into distribution systems, voltage waveform distortion is a concern. Utilities have the responsibility to contain the overall voltage distortion by apportioning the emission of harmonic currents allowed when an RPP connects to the network.
The need for a pragmatic engineering solution is required as the number of renewable energy sources is on the increase. An assessment methodology that is scientifically sound, but also practical is required.
The deficiencies of existing approaches to the assessment of harmonic emissions are well published. Single-point measurements, the most accessible approach to engineers, have been shown to lack information in the quantification of a single source of harmonic distortion. Most of these methods make use of the direction of harmonic active power measured at a single point and cannot be used when more than one source of distortion is connected to the network under investigation.
In the absence of phasor data, the CIGRE/CIRED C4.109 working group proposed a methodology to analyse the harmonic emission from a distorting load. It is based on the principle that the rms value of the distorting load's harmonic voltage phasor | Vh|must be greater than the rms value of the network's harmonic voltage phasor |Eh0|. The problem lies in the quantification of the different voltage phasors, |Vh|and |Eh0|by using single-point measurements at the PoC. Mostly, only (| Vh|) is measured and |Eh0|is not measured or considered at all.
Practical distribution systems have sources of waveform distortion connected all over. In addition, network configurations and system state are dynamic. Eh0 cannot be ignored.
The deficiency of the CIGRE/CIRED C4.109 approach in quantifying the emission at an RPP by means of singlepoint measurements was demonstrated by analysis of practical field data. Application of synchronized multiple-point measurements was shown to improve the CIGRE/CIRED method by eliminating harmonic currents not classified as emission. Quantitatively, the use of statistical confidence levels to discriminated harmonic currents does not significantly affect the calculation of the harmonic emission levels, |Ehc|. An improvement in the qualitative assessment of the CIGRE/CIRED method was, however found.
A discriminatory approach is even more important when penalties or rewards are to be incurred by the distorting load or when grid code compliance is at stake. IEC 61000-4-30 aggregated data results in a reduction of the volume of data to be analysed but information on the angle of the phasor is lost affecting the certainty of the assessment results.
The aggregation period of data was also shown to be not significant in the calculation of harmonic emission in the study case thpresented, due to the removal of data lower than the 95 percentile in the study case.
Two important aspects were shown to influence the results of a grid code compliance assessment on harmonic emission, namely 1) the calculation method employed, and 2) the measurement uncertainty. It was shown that both could affect the compliance to harmonic emission limits, particularly when a RPP is marginally non-compliant.
9. REFERENCES
[1] G. Chicco, J. Schlabbach, and F. Spertino, "Characterisation and assessment of the harmonic emission of grid-connected photovoltaic systems," in 2005 IEEE Russia Power Tech, PowerTech, 2005, pp. 1-7.
[2] IEC, "IEC-61000-3-6 Assessment of emission limits for the connection of distorting installations to MV, HV and EHV power systems," Geneva, Switzerland, 2008.
[3] A. P. J. Rens and P. H. Swart, "On Techniques for the Localisation of Multiple Distortion Sources in Three-Phase Networks: Time Domain Verification," Eur. Trans. Electr. Power, vol. 11, no. 5, pp. 317-322, 2001. [ Links ]
[4] W. Xu, S. Member, X. Liu, and Y. Liu, "An Investigation on the Validity of Power-Direction Method for Harmonic Source Determination," vol. 18, no. 1, pp. 214-219, 2003.
[5] T. Pfajfar, B. Blazi, and I. Papi, "Methods for Estimating Customer Voltage Harmonic Emission Levels," in Harmonics and Quality of Power, 2008. ICHQP 2008. 13th International Conference, 2008, pp. 1-8.
[6] E. DE Jaeger, "Disturbance Emission Level Assessment Techniques ( CIGRE / CIRED Joint Working Group C4-109)," in 20th International Conference on Electricity Distribution, 2009, no. 470, pp. 8-11.
[7] B. Peterson, J. Rens, G. Botha, and J. Desmet, "A Discriminative Approach to Harmonic Emission Assessment," in IEEE International Workshop on Applied Measurements for Power Systems (AMPS), 2015, no. June.
[8] IEC, "IEC61000-4-30 Testing and measurement techniques - Power quality measurement methods," Geneva, Switzerland, 2015.
[9] M. Calin, A. M. Dumitrescu, M. Asprou, E. Kyriakides, and M. Albu, "Measurement Data Aggregation for Active Distribution Networks," Appl. Meas. Power Syst. (AMPS), IEEE Int. Work., pp. 144-149, 2013.
[10] J. Rens, J. De Kock, W. Van Wyk, and J. Van Zyl, "The effect of real network phase disturbances on the calculation of IEC 61000-4-30 parameters," in Proceedings of International Conference on Harmonics and Quality of Power, ICHQP, 2014, pp. 303-306.
[11] D. M. Pozar, Microwave Engineering. 2012.
[12] L. S. Christensen, M. J. Ulletved, P. Sorensen, T. Sorensen, T. Olsen, and H. K. Nielsen, "GPS Synchronized high voltage measuring system," in Nordic Wind Power Conference 2007, 2007, vol. 1, no. November, pp. 1-2.
[13] S. Elphick, V. Gosbell, and S. Perera, "The effect of data aggregation interval on voltage results," 2007 Australas. Univ. Power Eng. Conf., 2007.
[14] X. Huang, P. Nie, and H. Gong, "A new assessment method of customer harmonic emission level," in Asia-Pacific Power and Energy Engineering Conference, APPEEC, 2010.
[15] F. M. Fernandez and P. S. Chandramohanan Nair, "Estimation of supply side harmonics by using network impedance data," in 2010 Joint International Conference on Power Electronics, Drives and Energy Systems, PEDES 2010 and 2010 Power India, 2010, pp. 1-6.
[16] T. Pfajfar and I. Papic, "Harmonic emission level estimation based on measurements at the point of evaluation," in IEEE Power and Energy Society General Meeting, 2011, pp. 1-5.
[17] C. Muscas, L. Peretto, S. Member, S. Sulis, R. Tinarelli, and A. G. P. Q. Index, "Investigation on Multipoint Measurement Techniques for PQ Monitoring," IEEE Trans. Instrum. Meas., vol. 55, no. 5, pp. 1684-1690, 2006. [ Links ]
[18] O. Unsar, O. Salor, I. Cadirci, and S. Member, "Identification of Harmonic Current Contributions of Iron and Steel Plants Based on Time-Synchronized Field Measurements - Part I : At PCC," IEEE Trans. Ind. Appl., vol. 50, no. 6, pp. 4336-4347, 2014. [ Links ]
[19] I. N. Santos, V. Cuk, P. M. Almeida, M. H. J. Bollen, and P. F. Ribeiro, "Considerations on hosting capacity for harmonic distortions on transmission and distribution systems," Electr. Power Syst. Res., vol. 119, pp. 199-206, Feb. 2015. [ Links ]
[20] R. Kniel, P. a. Schnieper, and W. G. Sherman, "Summation of harmonics with random phase angles," Proc. Inst. Electr. Eng., vol. 121, no. 7, p. 708, 1974. [ Links ]
[21] Joint Committee for Guides in Metrology, "Evaluation of measurement data - Guide to the expression of uncertainty in measurement," 2008.
[22] N. Locci, C. Muscas, S. Sulis, and S. Member, "Investigation on the Accuracy of Harmonic Pollution Metering Techniques," IEEE Trans. Instrum. Meas., vol. 53, no. 4, pp. 1140-1145, 2004. [ Links ]

