


Services on Demand
Article
 English (pdf)
 Article in xml format
 Article references
Indicators

Related links
-
 Cited by Google
 -
 Similars in Google
Share

 Permalink
SAIEE Africa Research Journal
On-line version ISSN 1991-1696
Print version ISSN 0038-2221
SAIEE ARJ vol.108 n.3 Observatory, Johannesburg Sep. 2017
Development of a Sem-Quantitative approach for risk based inspection and maintenance of thermal power plant components
S Narain SinghI, II; J.H.C PretoriusII
IEskom, Group Technology, Production Engineering Integration Coal Department Eskom Enterprises Park, Building No 1,2ndfloor, Simba road, Sunninghill, Johannesburg, 2000 P.O. Box 10091, Johannesburg, 2000 South Africa
IIFaculty of Engineering and the Built Environment, University of Johannesburg, P O Box 524, Auckland Park, 2006, South Africa
ABSTRACT
This paper deals with the development of a semi-quantitative Risk Based Inspection programmes for the Eskom fossil fired generating fleet. This study comes as a result of internal and external factors that affect Eskom from producing electricity in a safe, sustainable manner to ensure security of electricity supply. Eskom has embarked on a risk based maintenance approach to meet the statutory and safety requirements as stipulated by the Depart of Labour as well as to potentially reduce outage costs. The European CWA15740 approach was used to develop the Risk Based Management System.
Key words: Risk Based Inspection, Probability of Failure, Consequence of Failure, Component damage mechanism, Pressure Equipment Regulation, Multi Level Risk Assessment, Pressure Equipment Regulation (PER), Risk Based Inspection and Maintenance Application Procedures (RIMAP), Energy Availability Factor (EAF), Unplanned Unit Capability Loss Factor (UCLF), Planned Unit Capability Loss Factor (PCLF)
1. INTRODUCTION
Eskom currently faces the challenge of balancing ever tightening production, safety, economic and statutory pressures in an environment where Specialist skills and resources are critically scarce on a global scale. The current Eskom fleet is often operated to the maximum design limit and sometimes beyond to meet the current electricity demand[1].
Over the last few years Eskom's performance has declined from and EAF perspective[2]. Eskom's philosophy of 90:7:3 (90 % energy availability, 7 % planned maintenance and 3% unplanned maintenance) cannot be achieved[3].
Eskom's third Multi Year Price Determination process started in 2012 after the end the MYPD2 determination with Eskom asking NERSA for a tariff increase of 16% of a period of 5 years[4]. The application proved unsuccessful as Eskom was only granted an 8% increase. and Eskom now finds itself with a funding gap of R255 billion[5].
Plant performance has steadily decreased with up to 9000 MW (20% of the installed EAF) of unplanned maintenance (UCLF) being done [2, 6]and at some stages as much as 25% of EAF has been unavailable [7]. The use of gas turbines to get more power onto the grid has substantially affect costs[2, 8]. This unavailability of electricity has led to regular load shedding with the cost of load shedding being six times more than the cost to run the gas turbines[9].
The introduction of the new Pressure Equipment Regulation which regulates the pressure equipment operations have further added complexity to the Eskom operating environment. This new regulation states that all equipment operating at a pressure >50kPa are regarded as pressure equipment and as such must be hydrostatically pressure tested at a test pressure 1.25 times the design pressure at a frequency of 36 months. Eskom currently pressure tests at a 72 month interval, however the new regulation does not permit the 72 month interval.
Reverting to a 36 month philosophy would lead to further complexity as the operating philosophy of 80:10:10 [3] cannot be achieved as PCLF would double. As an alternative to the requirement for periodic 36 month pressure tests, the PER offers an option of implementing a certified Risk Based Inspection (RBI) programme as part of a plant life cycle management strategy.
This paper outlines the development of a multi level risk assessment process that allows Eskom to comply with the statutory requirement of the PER while maintaining security of supply and achieving future savings to make up some cost savings to supplement the 8% tariff increase. The European RIMAP (Risk Based Inspection and Maintenance Application Process) CWA15740 process.
Initial literate surveys indicate that the Risk Based approach on fossil fired power stations is the first of its kind both nationally and internationally. The European methodology of CWA154740 has not been rolled out in its entirety at any utility; most risk approaches have followed the API580 methodology.
2. RISK BASED APPLICATION IN THE POWER INDUSTRY
Risk Based approaches have gained favour over the traditional maintenance approaches mainly due to the risk process's ability to accurate assess the condition of functionally important components and to then optimise operating and maintenance planning [10]. In the nuclear industry maintenance professionals are becoming involved in carrying out risk based evaluations[11]. Historically knowledge of risk based activities have existed in the field of Probabilistic Safely Assessments (PSA), a field in which maintenance professionals do not play a major role. The nuclear industry as well as Regulators are now using risk approaches to rationalise regulations as well as to optimise resource utilisation[11].
Application of RBI within the coal fired power generation is limited with few coal fired power stations applying this philosophy. National thermal Power Corporation in India is the world's third largest power utility. The utility has successfully applied RBI to all of its 105 power units ensuring that the units run safely and reliably[12]. Progress Power in the United States applied RBI to 19 of its power generating units. The risk based approach enabled the utility to replace 140 of its major tube components for $70 million less that the convention approach which treats all hazards equally[12]. In power distribution systems the crucial areas of Asset Management are maintenance and re-investment decisions.
Risk Based Inspection is a technology that assists in prioritising maintenance activities[13]. Experience in power distribution systems has shown that the majority of system failures are contributed from a small number of high risk components. Risk Based inspection can be used to identify and prioritise maintenance activities of these high risk components effectively prolonging the useful life of the component while achieving the same level of risk[13]. Swedish law requires Distribution System Operators (DSO) to compensate customers if they experience outages for period's greater than 12 hours. A major portion of the DSO's costs have gone to customer compensations [14]which can be up to 50% of the customers annual tariff depending on the duration of the outage. DSO's are now moving to a risk based approach to minimise customer outages[15].
3. THE RIMAP APPROACH
The RIMAP process started out as a European project to with the aim to develop a unified risk based decision making process within the inspection and maintenance arena. This process would be applicable to the power, chemical, petrochemical and steel industries respectively[16]. The research into the development of RIMAP was partly funded by the European Commission. Risk-based planning and execution of inspection and maintenance (RBIM) is a comprehensive philosophy for managing asset integrity. RIMAP provides guidance for RBIM, quality assurance and follow-up of activities and work processes within an organisation that is used for risk based asset management. It is important to maintain the link between the engineering planning and the actual execution of RBIM (RIMAP workbook). The Process to assess risk is based on a combination of the probability and consequence of failure. This combination of probability and consequence is assessed using a bow tie model[16]. The outcomes of the assessment is then used to prioritise maintenance interventions.
3.1. The RIMAP Process
General Requirements:
The RIMAP process relies on the application of sound engineering practices as it is based mainly on expert input. It is necessary to ensure that the risk acceptance criteria and the objectives of the assessment are clearly defined.
The assessment team must comprise of a multi-disciplinary team with competencies in inspection, maintenance, materials, corrosion, electrical, fixed and rotating equipment, safety, health plant knowledge and risk and reliability assessment
Initial Planning:
In this step the objectives of the study are defined and the boundaries for the assessment are identified. The assessment team is setup and the data sources are identified. The necessary software required are defined.
Data Collection and Validation:
Once the data sources have been identified the data is gathered. This data is generally collected from multiple sources. The possibility that the data could be of poor quality is high therefore it is necessary for the data to be validated by the assessment team and the data is then stored in a well-structured database.
Multi Level Risk Analysis:
In this step the PoF, CoF and overall risks are calculated. The multilevel risk analysis ranges from an initial screening step to a very detailed quantitate assessment. The screening analysis is meant to be relatively fast, simple and cost effective. The components are analysed using criteria such as high, medium and low risk. A components that fall into the high and medium risk criteria should be considered for further analysis whereas low risk components would follow a minimum surveillance maintenance approach, this is done to ensure that the assumptions made during the assessment are valid.
The detailed risk assessment follows the same principles as the screening analysis although in greater detail.
Damage mechanisms are identified per component and degradation rates are determined. Additional criteria are used in refining the PoF, CoF and overall risk determination.
Decision Making and Action Plan:
Based on the outcomes of the risk assessment the team develops the optimal inspection strategy. The strategy should ensure resource and cost optimisation.
Execution and Reporting:
The maintenance plan developed by the risk assessment is executed and the findings of the maintenance interventions are recorded noting the condition of the component. These findings are then fed into the risk assessment for further risk refinement.
Performance Review:
The purpose of the evaluation of the risk-based decision-making process is to assess its effectiveness and impact in establishing the inspection and maintenance programs thus allowing for continuous improvement. The evaluation process involves both internal and external assessment conducted by the operating organization and by independent experts, respectively. Internal assessment can be triggered by a deviation from the process, or a change in knowledge or the plant that requires a risk reassessment.
The RIMAP methodology is a guide; it is not prescriptive making it industry independent. The process is based on best practices and it gives guidance on what a comprehensive RBI process should entail. These factors make it an ideal process for Eskom to adopt. There are however limitation this methodology in that it is heavily dependent on good quality data, it applies to equipment on in the in service phase and is it applicable o to the secondary plant in a nuclear power stations. Further the documentation supporting the RIMAP process is of a large quantity and it may prove difficult for and individual to go through all this documentation[17].
4. DATA GATHERING
The data gathering aspect of the RBI process is vital for an effective RBI assessment[18, 19]. The data used for the risk assessment must be of a high quality [20] as poor and ambiguous data could lead to the results of the risk assessment being conservative in nature in that may of the risks associated with the components being assessed may be overstated. All data collected must be verified and validated to ensure that the data is accurate and applicable to the risk study.
Data required for a RBI assessment is divided into two categories namely design data and operating data. Design data provides information on the construction and design criteria of a component. Operating data gives information on the conditions (operating temperature, operating pressure, etc.) under which the component is in service. In doing a RBI assessment a minimum or base data set is required for the assessment.
For the Eskom project the following data was collected:
4.1. Design and Construction Data
The design and construction data is required to assess aspects of structural integrity. This data is generally used as a benchmark against which test and inspection activities can be compared to. The quality of the material used in construction of the component can also be determined of records of fabrication inspections are available. These inspections would typically indicate issues such as poor materials, weld defects, weld repairs and construction concessions. This information is useful in determining areas of possible deterioration. NDT reports during component construction can give an indication of the quality of workmanship that was involved during construction.
4.2. Test and Inspection Reports
Inspection reports can be used to trend deterioration rates of a period of time. These trends can then be used by the RBI assessment team to determine the safe operating regime of a component. It is necessary to ensure that all inspection reports are analysed on not just the latest report. It is also important to assess the NDT techniques listed in the inspection reports to determine the effectiveness of the chosen technique.
4.3. Modifications and Repairs
Any repairs or modification carried out on equipment under assessment must be reviewed to ensure that it was repaired according to the necessary codes of construction. It is also necessary to determine the reason behind the repair or modification to assess if this would have an impact of the probability of failure determination.
4.4. Maintenance Records
Maintenance records are required to assess the effectiveness of the maintenance interventions. The records also give an indication of "as found" conditions. These "as found" conditions need to be assessed by the RBI team to determine if there are active damage mechanisms present as well as to assess if the maintenance interventions are effective enough to arrest any active damage mechanisms.
4.5. Protective Devices
The type and condition of protective devices should be reviewed to establish their suitability under a RBI regime. Protective devices can present particular problems as they usually operate infrequently, or may never operate at all; they may be susceptible to the external environmental conditions or be affected by the contents of the system.
Data storage within Eskom is spread across fourteen power stations over four provinces (Mpumalanga, Limpopo, Free State and the Western Cape) and the head office, Megawatt Park in Johannesburg. This spread of information makes the gathering of data somewhat complex. To ensure that the relevant and accurate data was collected multiple teams were used with resources from both the head office and relevant power stations being used.
Data storage was done using Microsoft Excel and collaboration with the data gathering teams and the power stations was done using Microsoft SharePoint. This ensured quicker updates of data sets and at the same time created a record and paper trail of all changes to the data. All final data sets were then stored for use by the RBI assessment team in the Eskom Document Management System, Hyperwave.
Data validation is performed to ensure that the data collected is accurate and relevant. There are various levels of validation to ensure data accuracy. Initial validation is carried out by the data collectors as the data is collected, this is an informal approach and the Excel spreadsheet filter function is used in this validation and a 100% check is performed on all the data captured. The second check is performed by the head office lead engineer in conjunction with the power station system engineer. A 100% check is once again performed on the data.
The third validation is performed by the relevant plant Specialist. This is a sample check and depending on the amount of errors found the sample size increases. Once all checks are completed the data is signed off by the Power Station Engineering Manager and the relevant plant Specialist. The data is then loaded onto the document management system for use by the risk assessment team.
The data gathering aspect is an important step in the Risk Based Inspection process as errors and inaccuracies in data will affect the outcomes of the assessment. The validation steps are necessary to improve data accuracy thus ensuring an effective risk assessment.
5. THE SEMI QUANTITATIVE RISK BASED MODEL
The risk model is based on the RIMAP CWA15740 methodology. In conjunction with the ISO31000 standard rules were developed to ensure a robust process was developed that conforms to international norms. The model consists of three levels of assessment:
• A level one risk assessment that is qualitative in nature
• A level two risk assessment that is semiquantitative in nature, and,
• A level three assessment that is quantitative in nature
5.1. Level One Risk Assessment
The level one assessment is a fully qualitative assessment in which screening is performed to screen out the very low risk components. The level one assessment assesses probability and consequence of failure of the component under study and the risk for the component is calculated based on the result of the PoF and CoF assessment.
Determining level one probability of failure:
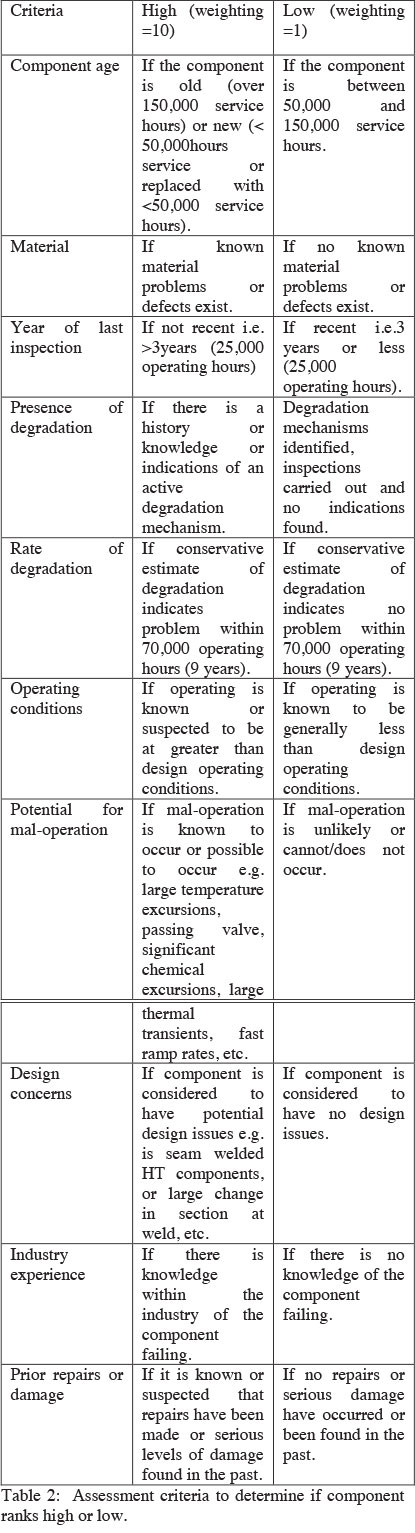
The first level of assessment is a screening assessment that is used to screen components that pose a low risk to the organisation. A simple evaluation of PoF is carried out by determining which of a number of specific criteria will influence the probability of a failure occurring. For example, if a component is operating at conditions above the design parameters it will be more likely to fail than if it were operating at conditions below the design parameters. Hence for this case a response of "high" would be the input for the criterion "operating conditions" whereas if it is known that the component operates below design the input would be "low". The terms "high" and "low" equate to high and low score respectively. In performing the level one screening assessment only the most likely active damage mechanisms must be considered and the worst case scenario in terms of failure must be considered together with the probability that this failure would occur.
The following rules are applied for the level one screening assessment:
• The risk assessment must always be conservative.
• If there is any uncertainty associated with any factor or if no information is available then the default position is always "high".
A total of ten criteria are assessed to determine the probability of failure
Figure 1 lists the criteria used to determine the probability of failure along with the weighting applied to each criteria.
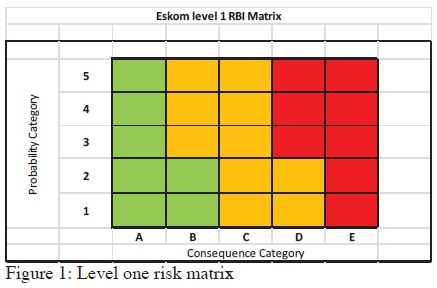
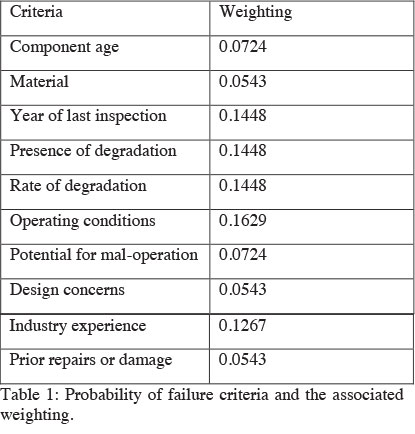
Table two lists the elements used to determine whether a criteria ranks either high or low when determining probability.
Each criterion is weighted according to the level of influence it has on the probability of causing failure. For each component assessed, each criterion is scored relative to a qualitative measure of how likely it is to affect the component. As indicated above for the level 1 assessment this is a simple "high" or "low" which in the assessment equates to a numerical score.
Probability of failure scoring:
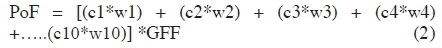
Each criterion is given a score relative to High = 10 or Low = 1. This score is then multiplied by the weighting of the criterion. Each criterion is similarly evaluated then all criteria scores are summed together, Equation (1).
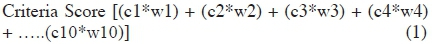
Where
cl = criterion 1, 2, 3...10
wl = weighting 1, 2, 3...10
This gives the component Probability score. However in order to produce an indicative probability of failure (PoF) the score needs to be modified by a Generic Failure Frequency (GFF). The Generic Failure Frequency (GFF) is a methodology that is used based on experience to identify failure frequencies of various components. It is typically developed using expert judgement and history of failures of components. The GFF for the Eskom study for the level 1 assessment are based on the DNV system[21].
For each component being assessed the RBI assessment Team will determine the appropriate GFF for the component. The cumulated criteria score is then multiplied by the assigned GFF as follows:
Using the GFF together with the score provides an indication of the Probability of Failure in any given year. Since the majority of damage mechanisms are time dependant, the probability of component failure would increase with time. To take account of this a factor is used with the GFF such that the longer the period required between inspections, the higher the risk. This multiplier is exponentially based such that in
• Year 1 the factor is 1,
• Year 6 the factor is 10 and
• Year 12 the factor is 100
This allows the risk of a component to be evaluated and compared over time e.g. if the risk of a component in year 1 is 1x10⁻⁴, it will be 1x10⁻³ after 6 years of further service and 1 x 10⁻² after 12 years of further service. This aids decision making around the acceptable service interval between inspections.
Level one consequence of failure calculation
For the Eskom RBI process three major categories are taken into account:
• Safety and health
• Business
• Environmental
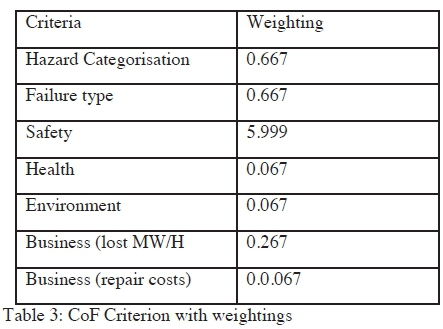
The Safety and health category takes precedence over the business and Environmental category The above criteria are used together with the Hazard Category (SANS 347 Pressure Classification), and the nature of failure (leak or Burst). As in the case of the PoF determination a "High", "Low" classification is used for each Criterion except for the Hazard category which has 3 main Classes (IV highest to Class II). Lower classifications (Category I and Sound Engineering Practice (SEP) do not require a RBI process to be used to manage their integrity. The criteria used are shown in Table 3. A logarithmic numeric is used for the high criteria (10) and low criteria (0.1) is used for scoring. For each component to be assessed the RBI Team will assign a score which will be factored by the weighting. The Hazard category is based on the dimensions/volume of the component and the contents. This produces a component CoF.
If the calculated risk lies within the Green area the risk is at an acceptably low level and no other assessment is required. Here the current routine maintenance strategy is to be reviewed for applicability and updated where necessary. If the calculated risk lies in the Yellow (medium risk) or Red (high risk) regions then the component must go forward to be evaluated under level two.
5.2. Level two risk assessment
During the level one risk assessments all low risk components were screened out and all high risk components are elevated to a level two semi quantitative assessment. Unlike the level one PoF assessment which was high level in nature, the level two PoF assessment is of a greater detail. In this assessment the number of criteria to which the component under study is assessed against is greater than the level one assessment.
Level two probability of failure assessment:
A total of nineteen criteria are used in the level two PoF assessment. These criteria are:
• Component Age (since installed)
• Total Starts per year
• Typical start-up rate /Loading rate
• Potential Material Problems
• Repairs / damage
• Time since Last inspection
• Adequacy of scope (for the damage mechanism considered)
• Adequacy of Techniques (for the damage mechanism considered)
• Calculated Rate of Degradation
• Quality of Water/Steam Chemistry
• Potential for Mechanical Fatigue stressing
• Potential for Thermal Fatigue Stresses
• Potential for Local mechanical over-stressing
• Presence of Local Hot spots
• Nominal operating temperature
• Corrosion susceptibility
• Frequency of temperature excursions
• Severity of Temperature excursions
• Design Concerns
The aim of the level two PoF assessment is to determine in greater detail the factors that may affect or influence the identified damage mechanisms for the component under study. Not all criteria listed above may affect the potential damage mechanism however they will be assessed to ensure all possible criteria have been taken into consideration. For the component under study all feasible damage mechanisms as well as failure types are considered. All inactive damage types are noted and recorded.
Level two scoring
The scoring system for each criterion is expanded into 5 classes:
• Very low (weighting 0.01)
• Low (weighting 0.1)
• Medium (weighting 1)
• High (weighting 10)
• Very high (weighting 100)
The criteria above are related to a score that is logarithmic in nature. The score for each criterion is multiplied by a weighting and is then summed up to provide the score for the component under study. The total of all the criteria scores is normalised by dividing each cumulative score by the sum of the criterion weights, Equation (3). This is carried out to ensure that selection of mid-point values results in a mid-range PoF value irrespective of the weighting assignment on each criterion.
The Generic Failure Frequency (GFF) is once again used but for the level two actual failure frequencies from industry experience are used where available. In instances where there is no industrial GFF data then the team will revert to the DNV GFF values that are used in the Level one PoF determination.
Level two consequence of failure assessment:
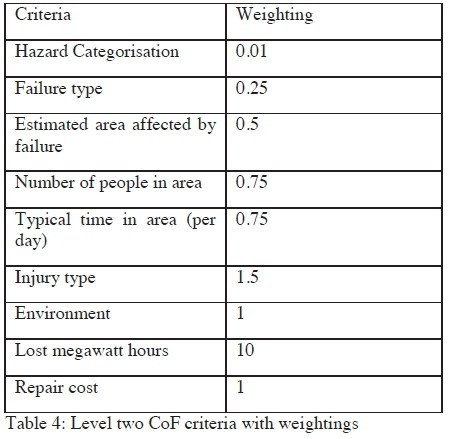
The Level two CoF calculation follows the same methodology as the level one calculation. However additional criterion and new weighting are assessed as illustrated in table 4, however the logarithmic weighting used in the PoF assessment remains unchanged.
Calculation of the Safety CoF is carried out as follows:
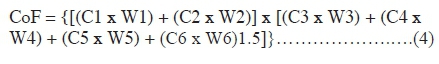
Calculation of the Business CoF is carried out as follows:
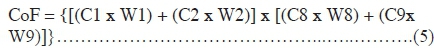
Calculation of the Environmental CoF is carried out as follows:

Calculation of the level two risk:
The Level two risk calculation is performed in the same manner as the Level one risk calculation (Risk = PoF x CoF). When dealing with multiple damage mechanisms the RIMAP bowtie approach is used in which the overall risk associated with the component is calculated used by multiplying the highest CoF value of all the active damage mechanisms with the sum of the PoF values of all the active damage mechanisms. Once the overall risk for the component under study is calculated the risk is plotted onto the level two Risk Matrix (figure 2).
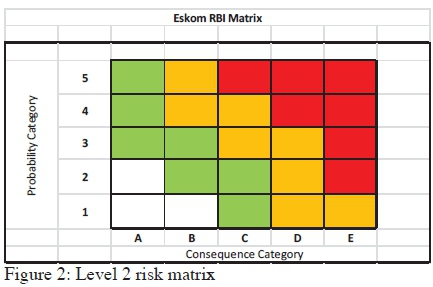
This risk matrix is broadly split into categories of equivalent risk, but extended to capture High Impact Low Probability events (HILPS). Each colour represents a risk category with an associated action as follows:
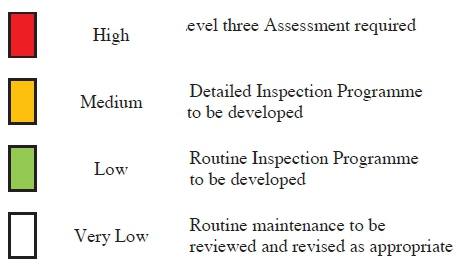
As indicated above, if the calculated risk is within the White area the risk is at an acceptably low level and no other assessment is required and the current routine maintenance strategy applies.
If the risk resides in the Green region the risk level is considered to be low but a routine inspection programme is to be developed.
If the component risk is in the yellow region then the risk level is relatively high and more information of the condition of the component is required, hence detailed inspection and/or further more detailed assessments should be carried out.
The red zone indicates that the risk level is unacceptable and the component must go forward to be evaluated using a level three quantitative assessment;
Each type of risk (safety & health, environmental and business) is plotted separately and again the business related risk acceptance level may be higher than that for safety or environmental provided the risk levels of the latter are low.
5.3. Level three risk assessment
The level three assessment is a fully quantitative process and is based on based on detailed calculations of remaining life until failure occurs. The specifics of the calculation approaches to be used are varied and will dependant on the component design, material condition and the operating conditions.
The level three calculation process would ideally start with a simple calculation to determine remaining life. If the simple calculation indicates that there is an acceptable time interval before failure occurs then no further calculations would be necessary. Alternatively if the simple calculation reveals an unacceptable time interval to failure then a more detailed calculation would be carried out to refine acceptability.
Level three probability of failure calculation:
The level three analysis is essentially calculations to determine remaining life of the component under study. These assessments will be carried out by the Specialist Metallurgists and relevant Plant Specialists.
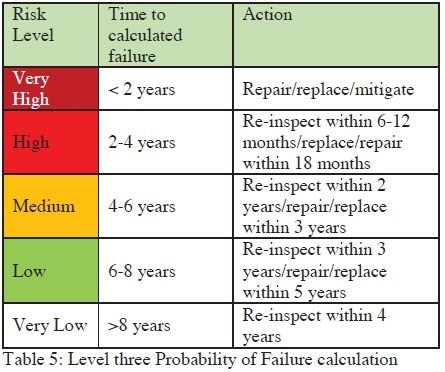
Level three probability of failure scoring:
The scoring for level three considers only the calculated time for failure. This is illustrated in table 5.
Level three consequent of failure assessment
The level two consequence of failure criteria are once again used in the assessment of the level three consequence of failure assessment.
Level three risk assessment:
The PoF and CoF of the level three assessment are plotted on the Level two matrix once again. The risk rankings of the level two criteria are also followed.
Development of mitigation strategy for level 3 high risk components:
If a component is found to have a very high risk ranking once the level three assessment is completed then a mitigation strategy document is developed by the Level three RBI assessment team.
This strategy document summarises the results of the level three analysis and includes recommendations. If the recommendations indicate that the risk level is very high and that immediate action is required, the report is then presented to the Technical Governance Committee for review, approval and implementation by the affected power station.
Where mitigation is possible, the RBI risk level is updated to reflect the refined risk level. Monitoring is developed to ensure compliance is undertaken by an appropriate means, such as a Temporary Operating Instruction or a Safety Instruction.
5.4. Development of test and inspection plans
For the high or very high risk components a detailed inspection is required. A RBI Inspection, Maintenance and Test (IMT) plan development team shall be convened to develop the appropriate RBI IMT Plan. The Plan is reviewed by the Subject Matter Experts for the component under study to assure that the plan is adequate, relevant and will mitigate the risks identified. All Outage Tasks are scheduled for the next Outage by the Plant System Engineer. Quality Control Plans are to be developed by Maintenance/Plant System Engineer and these QCP's have been approved upfront by the AIA. Finally all plans are implemented during the planned unit outage.
5.5. Post outage risk assessment
The RBI Team will evaluate the inspection reports after the Outage and re-assess the degradation rates etc. ready for the revised risk assessment.
The RBI Team is then re-convened to the repeat Level 2 Risk Assessment using the new inspection information to determine the current Risk Level. The level of risk after 6 years will be determined. Any components in the high risk category may require re-inspection earlier than 6 years.
The findings shall be compiled in a formal RBI Report and presented to the Site RBI Steering Committee for Approval.
6. CONCLUSION
This RBI model that has been developed using the European CWA 15740 standard. This developed risk model consists of 4 distinct phases namely:
• Data gathering and validation phase in which the relevant component data pertaining to design, operation and test and repair information is collected as the input for the risk assessment to be performed. This data is verified and validated to ensure that,
• A level one screening assessment in which qualitative criterion are employed to determine component risk. Based on the qualitative criterion if a component is perceived to be of a high risk then a further level of assessment is required
• A level two assessment in which a mix of qualitative and quantitate criterion (semiquantitative) are used to determine component risk
• Finally a level three assessment which is fully quantitative is employed to deal with unacceptably high risks based on the outcomes of the level two assessments.
This model was developed with the aim of ease of application and availability of resources (people, information and technology) in mind.
7. REFERENCES
[1] Bezuidenhout, M., et al., Risk Management of Plants with Finite Design in Eskom. 2012.
[2] Nani, C., Kendal Power Station Five Year Improvement Plan. 2015, Eskom Johannesburg. p. 125.
[3] Govender, T., Integrated Sustainability Strategy for Eskom Generation. 2013, Eskom: Johannesburg. p. 136.
[4] Eskom, Unpacking MYPD3 Eskom's Third Revenue and Tariff Application in Eskom Eskom, Editor. 2012, Eskom Johannesburg. p. 57.
[5] Gopal, D., Introducing Generation Specific Value Packages. 2014.
[6] Lacock, R., Tutuka Power Station Five Year Improvement Plan. 2015, Eskom Johannesburg. p. 41.
[7] Ntsokolo, M., Group Executives Dashboard. 2015, Eskom: Eskom
[8] Conradie, T., Lethabo Power Station Five Year Improvement Plan. 2015, Eskom Johannesburg. p. 52.
[9] Eskom, Media Assessment 2015 Eskom Johannesburg. p. 18.
[10] Coble, J.B., et al., Incorporating Equipment Condition Assessment in Risk Monitors for Advanced Small Modular Reactors. 2013, Pacific Northwest National Laboratory (PNNL), Richland, WA (US).
[11] IAEA, Implementation Strategies and Tools for Condition Based Maintenance at Nuclear Power Plants, in Nuclear Power Engineering. 2007: Austria.
[12] American Society for Mechanical Engineers. Inspectors Harness the Power of Probability. 2011 [cited 2011 May 2015]; Available from: https://www.asme.org/engineering-topics/articles/safety-and-risk-assessment/inspectors-harness-the-power-of-probability
[13] Jalili, L., et al., Designing A Financially Efficient Risk-Oriented Model for Maintenance Planning of Power Systems: A Practical Perspective.
[14] Wallnerstrom, C.J. and L. Bertling. Risk management applied to electrical distribution systems. in Electricity Distribution-Part 1, 2009. CIRED 2009. 20th International Conference and Exhibition on. 2009. IET.
[15] Wallnerström, C.J., et al. Review of the Risk Management at a Distribution System Operator. in Probabilistic Methods Applied to Power Systems, 2008. PMAPS08. Proceedings of the 10th International Conference on. 2008. IEEE.
[16] Kauer, R., et al. Plant Asset Management: RIMAP (Risk-Based Inspection and Maintenance for European Industries)-The European Approach. in ASME/JSME 2004 Pressure Vessels and Piping Conference. 2004. American Society of Mechanical Engineers.
[17] Shepherd, B., Safety implications of european risk based inspection and maintenance methodology. HSE Research Reports. UK: Prepared by Mitsui Babcock Technology for the Health and Safety Executive, UK, 2005.
[18] Ablitt, C. and J. Speck. Experiences in implementing risk-based inspection. in 3rd MENDT-Middle East Nondesctructive Testing Conference,(November 2005), Bahrain. 2005.
[19] Wintle, J.B., et al., Best practice for risk based inspection as a part of plant integrity management. 2001: Great Britain, Health and Safety Executive.
[20] RIMAP Consortium, Risk Based Inspection and Maintenance for the European Industries (RIMAP). 2008, European Committee for Standardisation: Brussels. p. 60.
[21] Mathieson, P., F. Saint-Victor, and A. Hussain, RBI Upstream Working Procedures and Guidance S. Angelsen, Editor. 2000, Det Norske Veritas: Europe. p. 42.

