


Services on Demand
Article
 English (pdf)
 Article in xml format
 Article references
Indicators

Related links
-
 Cited by Google
 -
 Similars in Google
Share

 Permalink
SAIEE Africa Research Journal
On-line version ISSN 1991-1696
Print version ISSN 0038-2221
SAIEE ARJ vol.108 n.2 Observatory, Johannesburg Jun. 2017
Specific emitter identification for enhanced access control security
J.N. SamuelI; W.P. du PlessisII
IDepartment of Electrical, Electronic and Computer Engineering, University of Pretoria, South Africa. Email: jeevanninansamuel@gmail.com,
IIDepartment of Electrical, Electronic and Computer Engineering, University of Pretoria, South Africa. Email: wduplessis@ieee.org
ABSTRACT
The application of specific emitter identification (SEI) to access control using radio-frequency (RF) access remotes is presented. Existing RF access remotes are vulnerable to a number of attacks including replay attacks due to their reliance on digital codes. SEI can overcome many vulnerabilities by exploiting the effect of hardware tolerances on the analogue signals transmitted by access remotes. A proof-of-concept SEI system was developed to investigate whether it is possible to distinguish between the RF signals produced by nominally-identical access remotes. It was determined that it is possible to distinguish between the access remotes with an accuracy of 98% with no false positives, even when tested against unknown remotes with the correct digital code and replay attacks.
Key words: Specific emitter identification (SEI), access control, software-defined radio (SDR).
1. INTRODUCTION
Radio-frequency (RF) access remotes such as the one shown in Fig. 1 are used to open gates to residential estates, and doors to houses and garages. On this basis they provide security as only people having an access remote with the correct code are able to gain access to these areas, akin to a key. However, the digital signal produced by these access remotes can easily be determined using low-cost RF receivers and reproduced by an RF transmitter [1-3]. This process allows illegitimate access to residential estates, houses and garages. This observation motivates the need for making the systems that receive signals from RF access remotes more robust to access remotes being cloned. This paper demonstrates how conventional RF access remotes can be uniquely identified using low-cost software-defined radio (SDR) receivers and specific emitter identification (SEI), thereby increasing security.

The fact that the coded signal transmitted by access remotes is digital makes it extremely simple to clone a static code [1], and in fact, many types of access remote are programmed by cloning an existing signal [4]. In an attempt to minimise this problem, codes which vary each time an access remote is used are employed in newer access remotes, but even access remotes using such rolling codes are subject to attack by cloning the digital signal [2, 3]. The problem with digital codes is inherently that they are simple to intercept and reproduce.
By comparison, SEI, also known as radio-frequency fingerprinting (RFF) or physical-layer identification, is a technique used to uniquely identify RF transmitters, even those of the same make and model, using the analogue characteristics of their transmitted RF signals [5]. This means of identification is possible due to the hardware tolerances of the RF circuitry having unique, measurable effects on the analogue signal without affecting the digital data being transmitted [6]. SEI is thus able to alleviate the mimicing or spoofing of the identities of RF devices as the analogue identifying characteristics exploited by SEI are inherently difficult to spoof [7, 8]. In this way, SEI can be used to enhance the security of access-control systems using RF access remotes.
A proof-of-concept SEI system for access control using RF access remotes is described. This system is able to distinguish access remotes with an accuracy of 98% and correctly rejects all unknown signals presented to it. Only 1.2 s of training data is required per remote which should be granted access, and access control is accomplished with single 23.5-ms bursts. The system was tested against a number of challenging attacks including unknown remotes with the correct digital code and replay attacks. Only the receiver system has to be changed, leaving the access remotes unmodified, thereby removing the expense associated with more complex remotes. The success of this demonstration suggests that this is a viable approach to increasing the security which can be achieved using even the most basic conventional RF access remotes.
This work is based on the research supported in part by the National Research Foundation of South Africa (NRF) (Grant specific unique reference number (UID) 85845). The NRF Grantholder acknowledges that opinions, findings and conclusions or recommendations expressed in any publication generated by the NRF supported research are that of the author(s), and that the NRF accepts no liability whatsoever in this regard.
Section 2 presents the design and implementation of a proof-of-concept software system that performs SEI to distinguish between two nominally-identical access remotes. Section 3 describes the results obtained from the study. Section 4 concludes the paper.
2. SYSTEM DESCRIPTION
The overall SEI system depicted in Fig. 2 consists of the elements which will are considered below.
1. The acquisition system acquires the RF signals produced by the access remotes. It then stores the data in a digital format for later processing.
2. Signal processing is then performed on the stored RF signals to remove any arbitrary variances in the signals that may distort the signals and affect signal classification.
3. The feature-extraction subsystem then extracts distinct features from the processed RF signals.
4. The classifier subsystem then takes the extracted features and builds an association between the RF signals and the transmitters from which they were produced. It then uses this association to classify and identify RF bursts produced by an access remote.

2.1 Operating Characteristics of RF Access Remotes
The RF access remotes considered in this study operate in the portion of the industrial, scientific and medical (ISM) band at 403.55 MHz [4]. This band is intended for the operation of equipment designed to use local RF energy for purposes other than telecommunications [9].
These access remotes transmit a modulated sequence of bits to the receiver in order to open or close the gate. Fig. 3 shows a portion of a signal received from an access remote. The modulation takes the form of pulse width modulation (PWM) in which a very long pulse denotes the start of a burst, followed shorter pulses of differing lengths which denote the code bits [1]. The code of the signal in Fig. 3 would be 100000000001 if wide and short data pulses correspond to ones and zeros respectively. This simple modulation makes these access remotes susceptible to replay attacks allowing illegitimate access to residential estates, houses and garages.

For the development of this system, eleven RF access remotes with the same digital access code were considered (Remotes 1 to 11). Remote 1 was also tested using a different digital code (Remote 12). To test the effect of replay attacks, the signals of Remotes 1 to 3 were recorded and replayed to the receiver system using a HackRF One SDR [10], shown in Fig. 4, with a sampling rate of 10 Msps to test whether cloning can be countered (Remotes 13 to 15).

2.2 Signal Acquisition
The signal acquisition system consists of two processes, namely the recording process and burst-extraction process.
For signal recording, an RTL2832U SDR with an R820T tuner, shown in Fig. 5, was utilised with the low-level free and open-source software (FOSS) drivers available online [11]. The selected SDR that performs quadrature sampling at up to 2.56 Msps without missing samples and has 8-bit analogue-to-digital converter (ADC) resolution [12] and is relatively inexpensive with prices ranging from $15 to $25 [13]. The SDR receiver was configured to have a centre frequency of 403.5 MHz and a sampling rate of 1 Msps.

Five 1-s recordings of each of the fifteen access remotes were made, and the recorded samples were stored in a binary files for later processing.
2.3 Signal processing
The recorded signals were further processed in order to remove any arbitrary variances in the bursts that are due to noise, amplitude variances and frequency offsets.
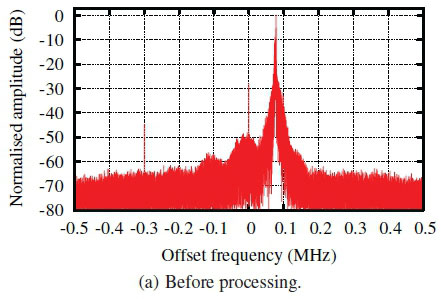
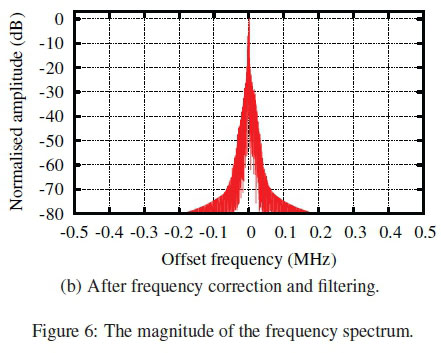
The spectrum of a signal recorded from an access remote is shown in Fig. 6(a), where noise, spurious signals and a frequency offset of approximately 75 kHz can be seen. The first step taken in processing was thus to mix the signal to a centre frequency of 0 Hz to ensure that all the signals are within the passband of the filter applied in the next step. The next step was to reduce the noise through filtering. A 40-coefficient finite impulse response (FIR) filter with a Blackman window was used due to its low sidelobes [14]. The spectrum after frequency correction and filtering is shown in Fig. 6(b).
Following filtering, the amplitude representation of each burst was normalised to make the median of the high signal level 1 as shown in Fig. 7. This normalisation prevents the feature-extraction subsystem from producing feature vectors that differ due to amplitude variances between bursts. This would cause the misclassification of bursts even if they were produced from the same access remote.
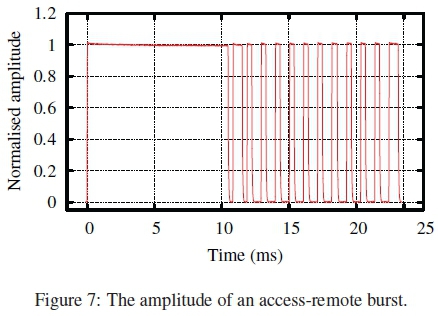
The individual bursts are all identical for a given code, so the next step was to extract the bursts from the stored RF signals produced by each access remote. A threshold of 0.5 was utilised to determine the positions of the rising edges of each pulse. The rising edges were used rather than the falling edges as the positions of the falling edges vary depending on the values of the data bits.
The durations of the various portions of a burst are shown in Table 1 where a period is the time from one rising edge to the next, while a width is the time from a rising edge to the next falling edge. Despite the large variations in the analogue parameter values, the same digital code is transmitted. A start pulse was identified as having a period of over 10.5 ms. A burst was then taken as starting 100 samples before the rising edge of the current start pulse and ending 100 samples before the rising edge of the next start pulse. The offset of 100 samples ensured that the rising edge of the start pulse is included in the burst which contains the start pulse as shown in Fig. 7.

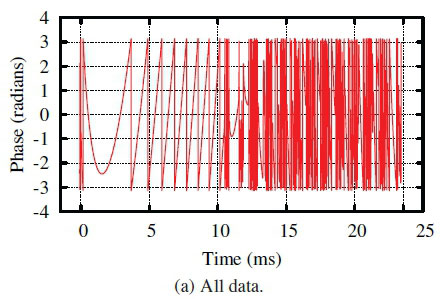
It must be noted that the phase sections corresponding to parts of the burst where the access remote is not transmitting are random, as seen in Fig. 8(a), and will negatively affect the classification. As a result, an amplitude threshold is applied to remove samples that correspond to data when the access remote is not transmitting. The phase representation that results from applying a threshold of 0.5 to the signal amplitude and unwrapping the phase is shown in Fig. 8(b). As seen in Fig. 8(b), the random fluctuations due the portions of the burst where the access remote is not transmitting have been removed, leaving only those signal artifacts that correspond to the access remote's hardware tolerances. The signal samples that do not correspond to active transmission of the access remote are thus discarded prior to feature extraction for both amplitude and phase.

A further problem with using phase information is that phases are subject to arbitrary offsets. This characteristic is clearly seen in Fig. 8(b), where each segment of phase information has a different initial phase value. These arbitrary phase offsets carry no information about the transmitter properties but can still have a significant influence on the output of a classifier. Frequency inherently provides the same information as phase as frequency is simply the gradient of phase. However, frequency is not subject to arbitrary offsets as can be seen by comparing the phase of a burst in Fig. 8(b) to the frequency of the same burst in Fig. 9. As a result, the frequency of the signal was used rather than the phase.

Table 2 lists the number of bursts extracted for each remote. In all cases, the first four 1-s recordings were used as training data, with the final 1-s recording being used as test data (see Section 2.6). Remote 4 has fewer bursts than the other remotes as its bursts are significantly longer than those of the other remotes (> 25.7 ms versus a maximum of < 23.6 ms), so it transmits fewer bursts during the 1-s recordings.
2.4 Signal difference inspection
Once signal processing is complete, the true differences between the signals produced by each access remote be determined. For SEI to be successful, it is imperative that the characteristics of the signal produced by a specific transmitter be consistent for all signals produced by that transmitter, while being appreciably distinct from the characteristics produced by another transmitter.
The amplitude and phase representations of the first bursts produced by Remote 1 on consecutive recordings are shown in Fig. 10. While there are differences between the two recordings, the overall responses display remarkable similarities. While not shown, the responses of all remotes display similarly consistent results, thereby satisfying the first condition for SEI to be successful.

The amplitude and phase representations of the first bursts produced by Remotes 1 and 2 are compared in Fig. 11. The amplitude responses of the two remotes in Fig. 11(a) display only minor differences, which is anticipated as the modulation used depends on signal amplitude. Based on this observation, the amplitude representations of the access remotes are unlikely to achieve the ultimate goal of classifying the bursts emitted by the access remotes. Observing the differences between the phase representations in Fig. 11(b), it is seen that the phase representations for each access remote differ significantly. These phase differences are more distinct than the differences seen in the amplitude representation. While not shown, the amplitude differences of some of the other remotes differ more significantly than those shown in Fig. 11(a), and the phase differences between all remotes are significant. On this basis, the phase representations of the access remotes are expected to be better for the purposes of SEI, and the second criterion for successful SEI is thus fulfilled.


2.5 Feature Extraction
While it is possible to present the entire amplitude or phase representation to the classifier, this would be inefficient and may hinder classification accuracy. This is because each sample in the phase and amplitude representations would be treated as a feature leading to an exorbitant number of features, and each remote would have a different number of features due to the varying burst lengths. Instead, a set of values that effectively summarises the shape of each representation and which ensures that all bursts have the same number of values is calculated. These values then serve as the features for each signal representation, and the process is called feature extraction [15].
Statistical measures are typically used in the SEI of wireless devices such as Global System for Mobile Communications (GSM) cellular telephones [16]. For the development of this system, statistical feature extraction was utilised. Each burst was divided into five equally sized sub-regions [16], with the mean, variance, skewness and kurtosis were calculated for both the amplitude and phase being computed for each sub-region. This led to a total of 40 features per signal representation (5 regions, each with 4 statistical measures for both amplitude and phase), which together represent a single feature vector.
2.6 Signal Classification
Once a set of feature vectors have been established, classification can take place. In order to perform classification, the feature vectors have to be segmented into training and test sets for each access remote. Once this is done, a classifier should be selected, trained and evaluated.
The training feature vectors serve to build an association between the feature vectors and the access remotes from which they were derived. This is done by presenting the classifier with a feature vector and an associated access remote label for all feature vectors in the training group. The test group of feature vectors is then used to evaluate the performance of the classifier. In this phase, each feature vector in the test group is presented to the classifier without a label, and the classifier returns the label of the access remote it deems most likely to correspond to the feature vector [17]. It is important to note that the training and test groups of feature vectors must be derived from different bursts. For the development of this system, training feature vectors were derived from the first four recordings of each access remote, while test feature vectors were derived from the fifth recording of each access remote.
As the object of this work was not to study classifiers, an off-the-shelf classifier from the Octave nan toolbox was used [18]. This toolbox implements a large number of classifiers, and of these, the naive Bayes classifier was selected. This classifier produces a distance metric (a form of confidence) for each of the known classes (remotes), with the class with the largest distance metric being returned as the result. The distance metric is much greater than 1 for high confidence and far smaller than 1 for low confidence, so unknown classes can be included in the results by adding an additional unknown class with a distance metric of 1. When a class is classified with high confidence, the distance metric is » 1, and the result will be the relevant class. However, low confidence in the classification will lead to a distance metric which is C 1, so the result will be the unknown class. In this way, unknown remotes and cases where there is low confidence in the classification can be flagged by the system.
3. RESULTS
The results obtained using the system described above will be considered below. The first question is whether remotes can be correctly identified using the proposed SEI system, and the more important question is whether known and unknown remotes are correctly distinguished. Initially, the use of all the available training bursts will be considered, but later results will evaluate the effect of using fewer bursts for training.
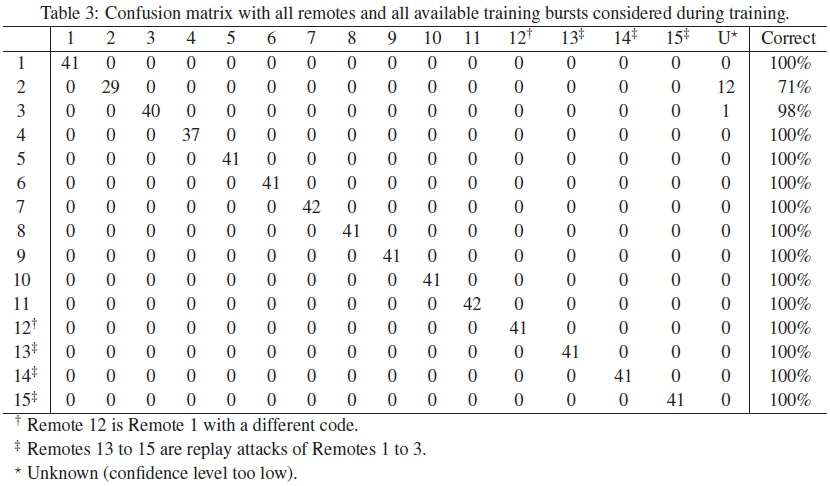
Table 3 shows the confusion matrix which resulted when all of the available remotes were considered and all of the available training bursts were utilised for training. The most important observation from Table 3 is that the system did not confuse any of the remotes as all results are either a correct classification or a uncertain outcome.
Examining the results more closely shows that only Remotes 2 and 3 produce uncertain results with all the other remotes being correctly classified in all cases. But even in these two cases, over 70% of the bursts transmitted by a specific remote were still correctly identified.
These results are encouraging because 98% of the test bursts were correctly identified, and more than 70% of the test bursts of any remote were correctly identified. Perhaps more significantly, the use of a known remote with a different code (Remote 12) and the inclusion of replay attacks (Remotes 13 to 15) did not affect the classification of the relevant remotes (Remotes 1 to 3) suggesting that the system is able to distinguish between different codes and between the original and recorded versions of the same remote.
A more important test from the perspective of access control is whether known and unknown remotes are correctly distinguished. Tables 4 and 5 show the confusion matrices which resulted when Remotes 10 to 15 and Remotes 6 to 15 were excluded from the training data respectively, and all available training bursts were used. The unknown remotes comprised unknown remotes (Remote 6 to 11), one known remote with a different code (Remote 12) and three replay attacks (Remotes 13 to 15). These unknown remotes thus tested all the major potential vulnerabilities of the system.
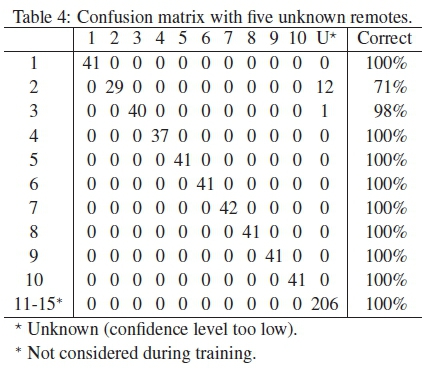

Remarkably, Tables 4 and 5 show that the unknown remotes were correctly rejected in all cases (there were no false positives), despite the fact that all but one of the remotes transmit the same digital code. Furthermore, all the known remotes were correctly classified, with the exception that 13 bursts transmitted by known remotes were incorrectly classified as unknown remotes (3% and 6% false negatives in Tables 4 and 5 respectively). Of the false negatives, 12 (92%) were generated by Remote 2, and even then, 71% of the bursts from Remote 2 were correctly classified.
The system is thus capable of correctly distinguishing between known and unknown remotes on the basis of the analysis of single bursts 98% of the time. This excellent performance is achieved despite the unknown remotes including a number of remotes with the same code, a known remote with a different code, and replay attacks.
Of importance in an access-control scenario, the system erred on the side of classifying known remotes as unknown rather than vice versa, thereby rather restricting than allowing access when there was doubt about whether a remote is known or not. Even in the worst case (Remote 2), 71% of the transmitted bursts were correctly identified, so access will not be unnecessarily withheld. Even assuming that the 12 bursts which were incorrectly rejected in the worst case (Remote 2) were transmitted one after the other, a delay of less than 330 ms (13 χ 23.5 ms = 329 ms) will be incurred to ensure an accepted burst is received.
The above results all consider the case where all of the available training bursts are used. While this means that only 4 s of data was required for training, requiring fewer training bursts would speed the training process. Fig. 12 shows the system performance as a function of the number of bursts per remote used for training.


As observed above, the system erred on the side of rejecting remotes, so the false negative rates (incorrectly rejecting a known remote) in Fig. 12 are initially high and then decrease as the number of training bursts increases. However, this behaviour also means that the false positive rate (incorrectly accepting an unknown remote) is zero throughout. The number of bursts used for training thus only affects whether known remotes are granted access with unknown remotes always being denied access.
No improvement in the performance of the system is achieved when more than 51 bursts are used for training with ten known remotes (Fig. 12(a)) and after 27 bursts for five known remotes (Fig. 12(b)). This behaviour is anticipated as identifying ten remotes is more complex than identifying five remotes. The one apparent anomaly in Fig. 12 is that the case with ten known remotes correctly identifies known remotes more accurately than the case with five known remotes, which is surprising as identifying a greater number of remotes is more complex. However, this apparent anomaly is explained by noting that the 13 false negative results for Remotes 2 and 3 form a greater portion of the total number of test bursts for known remotes when fewer known remotes are considered. Significantly, the results for systems trained with 51 and 27 bursts are identical to those trained with all the available training bursts, so over-fitting does not appear to be a problem in this system.
The system is thus capable of being successfully trained with comparatively short recordings. When ten known remotes are considered, only 1.2 s of data are required to obtain the 51 bursts necessary for optimum training (51 χ 23.5 ms = 1.2 s). The time necessary to train the system is thus not prohibitive.
But more importantly, the number of training bursts does change the fact that unknown remotes are always rejected by the system. This characteristic is extremely important in access-control systems where unauthorised access must be prohibited.
4. CONCLUSION
In conclusion, the development of a proof-of-concept SEI access control system for RF access remotes proved successful.
Offline classification was performed on RF bursts produced by access remotes using recordings obtained with a low-cost SDR receiver. Individual bursts could be identified as belonging to a specific known access remote or to an unknown access remote with an accuracy of 98%. More significantly, all bursts from unknown access remotes were correctly rejected by the system. This performance was achieved despite considering unknown remotes, a known remote with a different code, and replay attacks, so the system is shown to be robust against the main attack classes.
In light of these observations, SEI has been shown to hold tremendous potential to enhance the security of RF access remotes without changing the access remotes or significantly increasing cost of the receiver. This improvement is achieved by providing physical-layer identification of the individual access remotes rather than relying only on the digital code transmitted.
ACKNOWLEDGEMENT
The authors would like to express their sincere thanks to the anonymous reviewers for their valuable comments and suggestions.
REFERENCES
[1] T. Watorowski. (2016, July) H4ck33D - hacking a 433MHz remote control. [Online]. Available: http://mightydevices.com/?p=300
[2] S. Kamkar. (2016, December) Opensesame: hacking garages in seconds. [Online]. Available: http://samy.pl/opensesame/
[3] A. Nohawk. (2016, December) Bypassing rolling code systems. [Online]. Available: https://andrewmohawk.com/2016/02/05/bypassing-rolling-code-systems/
[4] (2016, December) SENTRY learning 1/3/4 button (403MHz) (binary, trinary, french). [Online]. Available: http://www.martin-electronics.co.za/Leaming_B_T_F_<%20403Mhz.aspx
[5] K. I. Talbot, P. R. Duley, and M. H. Hyatt, "Specific emitter identification and verification," Technology Review Journal, vol. 11, pp. 113-133, June 2003.
[6] B. Danev, D. Zanetti, and S. Capkun, "On physical-layer identification of wireless devices," ACM Computing Surveys, vol. 45, no. 1, pp. 6:1-6:29, December 2012.
[7] M. Williams, M. A. Temple, and D. Reising, "Augmenting bit-level network security using physical layer RF-DNA fingerprinting," in Global Telecommunications Conference (GLOBECOM), Miami, USA, December 2010, pp. 1-6.
[8] D. R. Reising, M. A. Temple, and M. J. Mendenhall, "Improving intra-cellular security using air monitoring with RF fingerprints," in IEEE Wireless Communications and Networks Conference (WNC10), Sydney, Australia, April 2010.
[9] ITU. (2016, July) Article 1: Terms and definitions. [Online]. Available: http://life.itu.int/radioclub/rr/art01.htm
[10] (2017, January) Great Scott Gadgets - HackRF One. [Online]. Available: https://greatscottgadgets.com/hackrf/
[11] (2016, December) Github - osmocom/rtl-sdr. [Online]. Available: https://github.com/osmocom/rtl-sdr
[12] (2016, July) rtl-sdr - OsmoSDR. [Online]. Available: http://sdr.osmocom.org/trac/wiki/rtl-sdr
[13] (2016, December) NooElec - software defined radio. [Online]. Available: http://www.nooelec.com/store/sdr.html?SID=t9c2n3lqampvb1fvejusq7gbt 3&dir=asc&limit=all&order=price
[14] F. J. Harris, "On the use of windows for harmonic analysis with the discrete Fourier transform," Proc. IEEE, vol. 66, no. 1, pp. 51-83, January 1978.
[15] R. O. Duda, P. E. Hart, and D. G. Stork, Pattern Classification, 2nd ed. New York, USA: Wiley-Interscience, 2000.
[16] D. R. Reising, M. A. Temple, and M. J. Mendenhall, "Improved wireless security for GMSK based devices using RF fingerprinting," International Journal ofElectronic Security and Digital Forensics, vol. 3, no. 1, pp. 41-59, March 2010.
[17] S. Russell and P. Norvig, Artificial Intelligence A Modern Approach. New Jersey, USA: Pearson Education, 2010.
[18] (2016, December) The 'nan' package. [Online]. Available: https://octave.sourceforge.io/nan/

