


Services on Demand
Article
 English (pdf)
 Article in xml format
 Article references
Indicators

Related links
-
 Cited by Google
 -
 Similars in Google
Share

 Permalink
Water SA
On-line version ISSN 1816-7950
Print version ISSN 0378-4738
Water SA vol.50 n.1 Pretoria Jan. 2024
http://dx.doi.org/10.17159/wsa/2024.v50.i1.4055
RESEARCH PAPER
Seepage behaviour through earth dams with zones of different filling materials
Mahmoud M MostafaI, II; Shen ZhenzhongI
ICollege of Water Conservancy and Hydropower Engineering, Hohai University, Nanjing 210098, China
IICivil Engineering Department, Assiut University, Assiut71516, Egypt
ABSTRACT
Since more than one-third of dam failures have been attributed to uncontrolled seepage, it is of great mportance to investigate the behaviour of this phenomenon in order to achieve the maximum degree of safety for such dams. The present work investigated the influence of the permeability coefficient of the different materials used in zoned earth dams on different seepage parameters. For the modelling and analysis processes, the Seep/w and Seep2D software were employed. The numerical results prove that the optimum relative hydraulic conductivity between the inner and transition shells is about 0.001, and it is Detter to use filling materials with less hydraulic conductivity in the upstream transition and outer shells than η the downstream ones. A good agreement was noted between the obtained results from Seep/wand those Tom Seep2D. Reducing the hydraulic conductivity of both the upstream and the downstream shells, or of the downstream shells only, causes the pore water pressure in the dam body to increase significantly, and causes a remarkable reduction in the seeped water quantity and velocity. A moderate reduction in the different seepage parameters is achieved by reducing the hydraulic conductivity of the upstream transition shell, and a small reduction is noticed by reducing the hydraulic conductivity of the upstream outer shell.
Keywords: earth dams, hydraulic conductivity, phreatic line, seepage analysis, Seep/w, Seep2d
INTRODUCTION
In the context of water management and dam construction, a dam serves multiple purposes, such as flood control, hydropower generation, and irrigation. Dams can be single-purpose or multipurpose structures (Modi, 2014). Among various types of dams, embankment dams are widely used due to their economic feasibility. Approximately 70% of dams globally are embankment dams (Fu et al., 2018). Zoned embankment dams are constructed with an impermeable core surrounded by permeable upstream (US) and downstream (DS) shells. These permeable shells protect the core and the entire dam structure. The upstream shell enhances stability during rapid drawdown, while the downstream shell acts as a drainage system to control seepage within the dam (Javdani et al., 2015).
The seepage study is one of the most important studies in the design of embankment dams, and is used to determine the quantity of the seeped water from the reservoir, estimate the different seepage characteristics - including the pore pressure, hydraulic slope, and velocity - and locate the seepage surface. Seepage can occur within the embankment body or its foundation. Notably, many dam failures, particularly among homogeneous and zoned embankment dams, result from overtopping and piping (Zhang et al., 2009). Statistics indicate that about 35% of dam failures are attributed to seepage-related issues (Garg, 2013). Management of seepage-related concerns includes accurately estimating seepage quantities for reservoir storage and ensuring the dams safety against seepage-related effects (Aboelela, 2016).
Many practical recommendations should be carried out to avoid failures due to seepage through embankment dams (Flores and Lopez, 2011). Al-Janabi (2013) studied the seepage flow through embankment dams using different models. The results illustrated that if a sufficient quantity of silty sand soil was available, the homogeneous embankment dam with a downstream filter was the optimum among the different types. Alternatively, a zoned dam with a core was recommended under material scarcity. Fattah et al. (2014) focused on an embankment dam in Iraq, and it was found that the impermeable core had a great influence on the hydraulic slope reduction. A remarkable reduction of the seeped water quantity was noticed with an impervious core in the embankment dam (Sazzad et al., 2014).
The upstream and downstream slopes had a negligible effect on seepage if an impervious core was found in the embankment dam (Sazzad et al., 2015). Impermeable cores were found to be crucial in reducing pore pressure and seepage, as observed in the study by Khassaf and Madhloom (2017). Some instruments, such as piezometers, settlement gauges, and those enabling seismic activity measurements, have to be provided in the dam (Omofunmi et al., 2017). Reducing the core's hydraulic conductivity led to substantial seepage reduction (Salem et al., 2019). A simplified method for assessing seepage in embankment dams with horizontal drains was introduced by Li et al. (2020).
Comparative investigations, such as that by Sazzad and Alam (2020), revealed higher seepage in zoned dams compared to other types. Beiranvand and Komasi (2021) investigated the seepage flow and pressure head of an embankment dam in Iran. The pressure head on the downstream side of the cut-off wall was dropped, which showed a significant effect on the seepage through the dam. Kos et al. (2021) investigated the use of dam reservoir sediments in constructing embankment dams. By using a core made of these sediments, the seepage volume decreased significantly, and the seepage line did not reach the downstream side of the dam. Zhang et al. (2021) studied the seepage and stability of an embankment dam in China, and it was found that the used model can effectively analyse the seepage flow and stability of such dams.
Previous research has primarily concentrated on core characteristics' effects on seepage. The present study aimed to investigate the influence of upstream and downstream shells on diverse seepage parameters in zoned earth dams. This aspect has not been extensively studied in prior research. The study employed Seep2D and Seep/w numerical models, first investigating the effect of the inner shells hydraulic conductivity, then extending the study to explore upstream and downstream shells' hydraulic conductivities using Seep/w. This investigation contributes to a better understanding of seepage behaviour in zoned earth dams.
DIMENSIONAL ANALYSIS
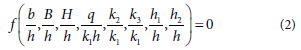
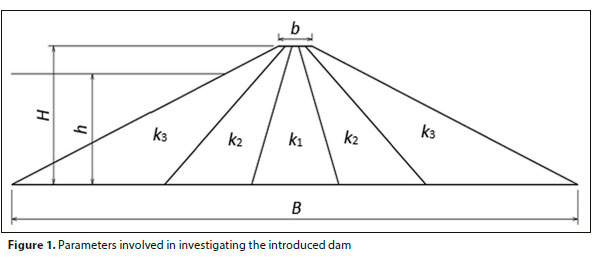
The equation governing the various parameters in this study, as illustrated in Fig. 1, can be given as:

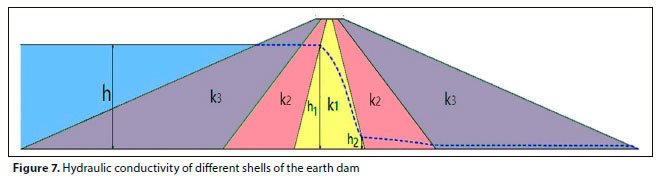
where: B is bottom width, b is top width, H is height of the dam, h is upstream head, k1 is hydraulic conductivity of the inner shell, k2 is hydraulic conductivity of the transition shells, k3 is hydraulic conductivity of the outer shells, q is seeped water quantity, h1 is seepage level at the upstream face of the inner shell, and h2 is seepage level at the downstream face of the inner shell.
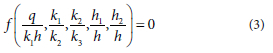
Assuming constant parameters for gravitational acceleration and water density, and applying Buckingham's π theorem, the relationship can be shown as:
Taking the dimensions of the dam and upstream head as constants, the equation relating the variables becomes:
METHODOLOGY
Numerical models
The primary goal of this research was to analyse the impact of the varying hydraulic conductivity of different shells on seepage within an embankment dam structure. In the present study, the numerical models were carried out using the Seep2D (Aquaveo, 2021) and Seep/w (Geo-slope, 2018) numerical models. Seep/w, operating as a finite element model, facilitates the simulation of water movement within diverse embankment configurations. The model relies on the principles outlined in Darcy's equation to depict the subsurface water flow within the soil. This equation can be expressed as follows:
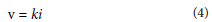
where: ν is the velocity, k represents the permeability coefficient, and i is the hydraulic slope.
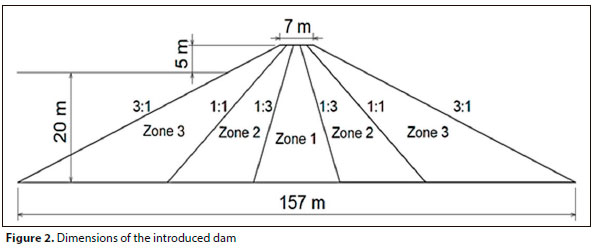
In tandem, the Seep2D numerical model is employed to simulate seepage flow through the application of the 2D finite element method. Seep2D facilitates the analysis of various seepage scenarios by enabling users to delineate dam geometry, set material properties, define boundary conditions, and specify mesh granularity. The geometry of the control model of the zoned earth dam which is considered in this study is illustrated in Fig. 2. The earth dam dimensions and geometry were selected according to the recommendations of the USBR (2012).
Material properties
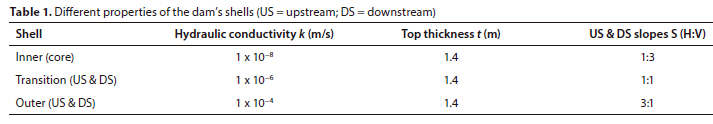
In this study, the characteristics of the shells in the control numerical model are selected based on recommendations from previous research and are illustrated in Table 1.
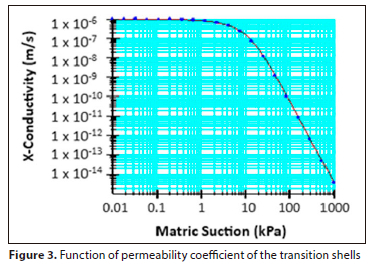
The sample function method is used with a saturated water content of 0.5 m3/m3 for the inner shell (clay), 0.4 m3/m3 for the transition shell (silt), and 0.3 m3/m3 for the outer shell (sand). While the hydraulic conductivity (k) remains constant for every saturated shell, for unsaturated zones it varies based on the matric suction value, as shown in Fig. 3 as an example.
Numerical modelling program
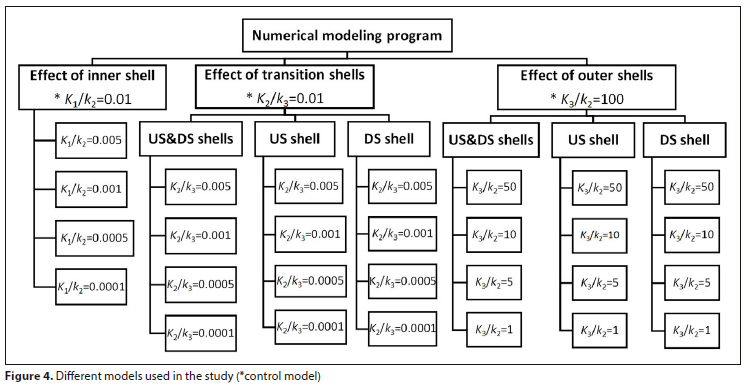
The study begins with an analysis of the control numerical model. Subsequently, the effect of the hydraulic conductivity of each shell is investigated while keeping the other hydraulic conductivities constant. Figure 4 illustrates the different models employed in this study
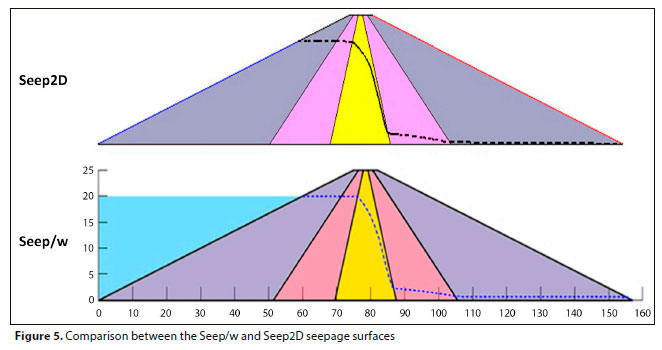
Comparison between Seep2d and Seep/w results
Initially, both Seep/w and Seep2D are applied to the first group of models to study the influence of the inner shell's hydraulic conductivity. Figure 5 provides a comparison of the seepage surfaces obtained from Seep/w and Seep2D.
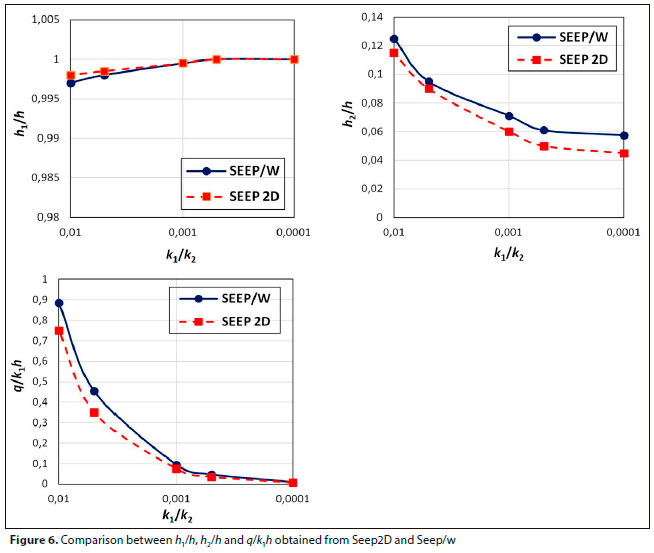
The comparison indicates a high agreement between the results of the Seep/w and Seep2D models in terms of plotting the seepage surface and calculating the seeped water quantity, as shown in Fig. 6. It is worth noting that the discharge coefficient (q/k1h) obtained from Seep/w is a little higher than that from Seep2D, primarily because Seep/w offers a more detailed representation of the soil, thus enhancing the accuracy of seepage discharge determination. As a result, Seep/w is employed to investigate the influence of various zones.
RESULTS AND DISCUSSION
Effect of the hydraulic conductivity of the inner shell
In a previous study (Mostafa and Shen, 2021), 5 numerical models were used, with a relative hydraulic conductivity between the inner and transition shells (k1/k2) ranging from 0.01 to 0.0001, for investigating the influence of the permeability coefficient of the inner shell on the seepage flow in the introduced earth dam, as shown in Fig. 7. It was concluded that reducing the relative hydraulic conductivity between the inner and transition shells to about 0.001 significantly reduces the seepage properties; for ratio values lower than 0.001 the influence was negligible.
Effect of the hydraulic conductivity of the transition shells
Effect of the upstream and downstream transition shells
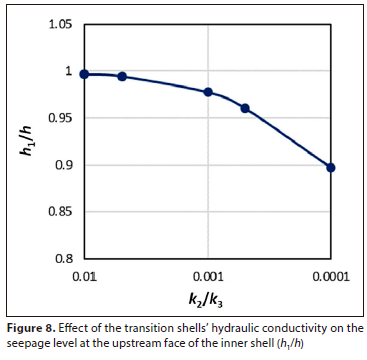
For determining the influence of the permeability coefficient of the transition shells on the seepage flow in the introduced earth dam, 5 numerical models are used with a relative hydraulic conductivity between the transition and outer shells (k2/k3) ranging from 0.01 to 0.0001.
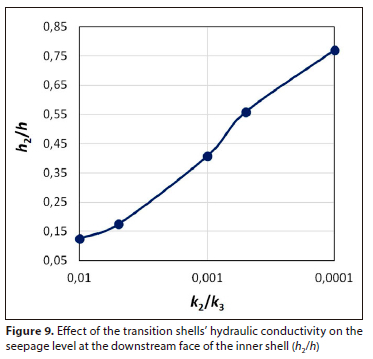
Figure 8 shows the effect of the transition shells' hydraulic conductivity on the seepage surface at the upstream face of the inner shell (h1/h). The chart illustrates that reducing the hydraulic conductivity of the transition shells causes a small reduction in the seepage surface at the upstream face of the inner shell (about 10%). The effect of the transition shells' hydraulic conductivity on the seepage surface at the downstream face of the inner shell (h2/h) is illustrated in Fig. 9. Reducing the hydraulic conductivity of the transition shells increases the seepage surface at the downstream face of the inner shell (by 226% at k2/k3 = 0.001 and 516% at k2/k3 = 0.0001).
The effect of the transition shells' hydraulic conductivity on the discharge coefficient (q/k2h) is shown in Fig. 10. It is clear that the seeped water quantity is reduced by reducing the hydraulic conductivity of the transition shells (by 18% at k2/k3 = 0.001 and 67% at k2/k3 = 0.0001). Figure 11 illustrates the effect of the transition shells' hydraulic conductivity on the pore pressure (PWP). From the chart, reducing the hydraulic conductivity of the transition shells causes a slight reduction in the pore pressure at the upstream face of the inner shell (with 10%), while it increases the pore pressure at the downstream face of the inner shell (by 160% at k2/k3 = 0.001 and 400% at k2/k3 = 0.0001).
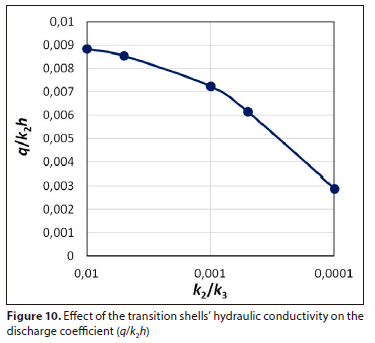
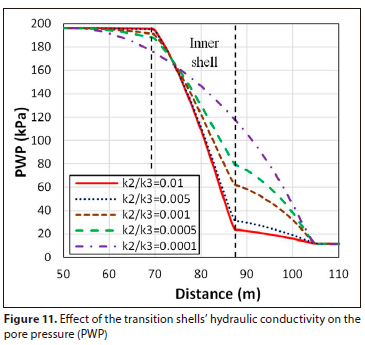
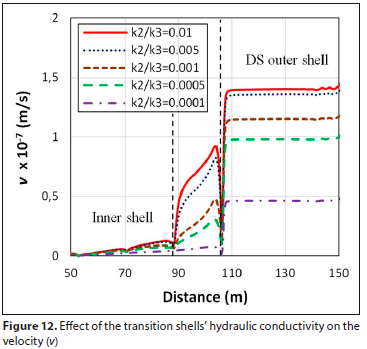
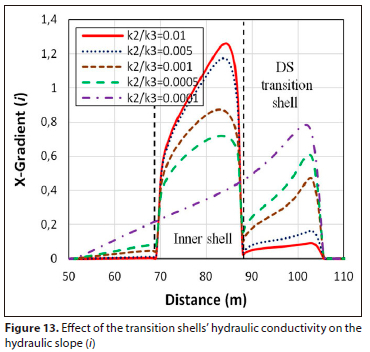
Figure 12 shows the effect of the transition shells' hydraulic conductivity on the water velocity in the horizontal direction (v). The chart illustrates that the velocity at the downstream outer shell is reduced with the reduction of the hydraulic conductivity of the transition shells (by 18% at k2/k3 = 0.001 and 67% at k2/k3 = 0.0001). The effect of the transition shells' hydraulic conductivity on the hydraulic slope in the horizontal direction (i) is illustrated in Fig. 13. The chart shows that reducing the hydraulic conductivity of the transition shells increases the hydraulic slope in the downstream transition shell (by about 410% at k2/k3 = 0.001 and 690% at k2/k3 = 0.0001).
Effect of the upstream transition shell
For investigating the influence of the permeability coefficient of the upstream transition shell on the seepage flow in the introduced embankment dam, 5 numerical models were used with a relative hydraulic conductivity between the upstream transition and outer shells (k2/k3) ranging from 0.01 to 0.0001.
The effect of the upstream transition shells hydraulic conductivity on the seepage surface at the upstream face of the inner shell (h1/h) is shown in Fig. 14. The chart illustrates that reducing the hydraulic conductivity of the upstream transition shell causes a reduction in the seepage surface at the upstream face of the inner shell (with about 17%). Figure 15 illustrates the effect of the upstream transition shells hydraulic conductivity on the seepage surface at the downstream face of the inner shell (h2/h). Reducing the hydraulic conductivity of the upstream transition shell reduces the seepage surface at the downstream face of the inner shell (with 19%).
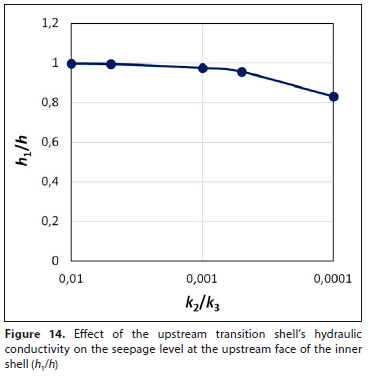
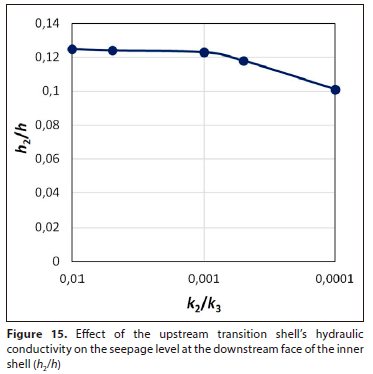
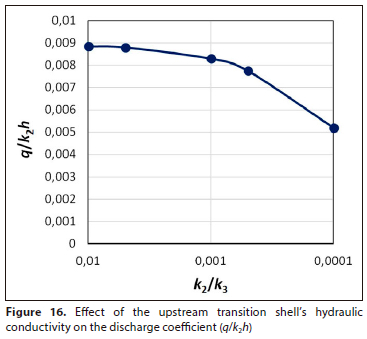
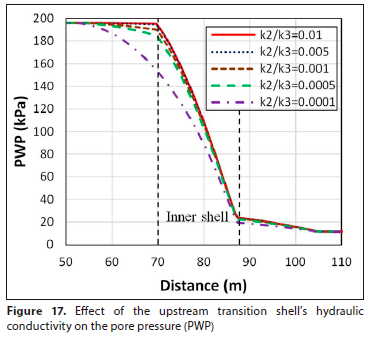
Figure 16 shows the effect of the upstream transition shells hydraulic conductivity on the discharge coefficient (q/k2h). It is concluded that the seeped water quantity is reduced by reducing the hydraulic conductivity of the upstream transition shell (with about 41%). The effect of the upstream transition shell's hydraulic conductivity on the pore pressure (PWP) is illustrated in Fig. 17. From the chart, reducing the hydraulic conductivity of the upstream transition shell causes a reduction in the pore pressure at the inner shell (by about 18%).
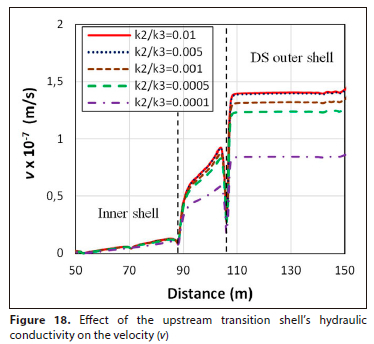
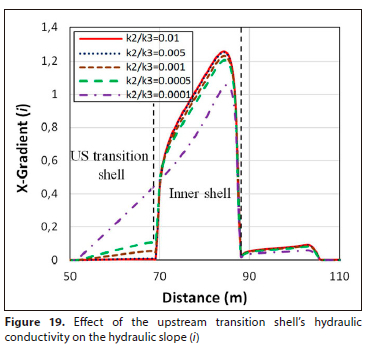
The effect of the upstream transition shell's hydraulic conductivity on the water velocity in the horizontal direction (v) is shown in Fig. 18. The chart illustrates that the velocity at the downstream outer shell is reduced with the reduction of the hydraulic conductivity of the upstream transition shell (by about 40%). Figure 19 illustrates the effect of the upstream transition shell's hydraulic conductivity on the hydraulic slope in the horizontal direction (i). The chart shows that reducing the hydraulic conductivity of the upstream transition shell increases the hydraulic slope in the upstream transition shell (by 91%).
Effect of the downstream transition shell
To know the influence of the permeability coefficient of the downstream transition shell on the seepage flow in the introduced embankment dam, 5 numerical models were used with a relative hydraulic conductivity between the downstream transition and outer shells (k2/k3) ranging from 0.01 to 0.0001.
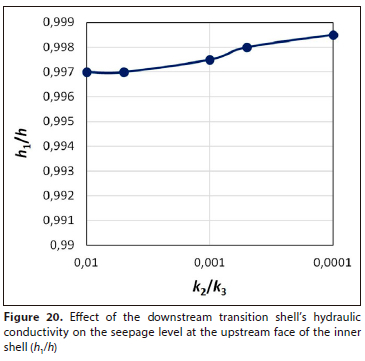
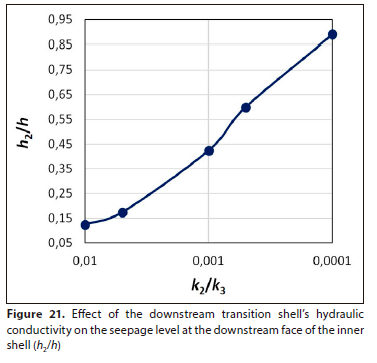
Figure 20 shows the effect of the downstream transition shell's hydraulic conductivity on the seepage surface at the upstream face of the inner shell (h1/h). The chart illustrates that reducing the hydraulic conductivity of the downstream transition shell causes a slight increase in the seepage surface at the upstream face of the inner shell. The effect of the downstream transition shell's hydraulic conductivity on the seepage surface at the downstream face of the inner shell (h2/h) is illustrated in Fig. 21. Reducing the hydraulic conductivity of the downstream transition shell increases the seepage surface at the downstream face of the inner shell (by about 240% at k2/k3 = 0.001 and 613% at k2/k3 = 0.0001).
The effect of the downstream transition shell's hydraulic conductivity on the discharge coefficient (q/k2h) is shown in Fig. 22. It is clear that the seeped water quantity is reduced by reducing the hydraulic conductivity of the downstream transition shell (with about 56%). Figure 23 illustrates the effect of the downstream transition shell's hydraulic conductivity on the pore pressure (PWP). From the chart, reducing the hydraulic conductivity of the downstream transition shell causes an increase in the pore pressure at the downstream face of the inner shell (by 170% at k2/k3 = 0.001 and 446% at k2/k3 = 0.0001).
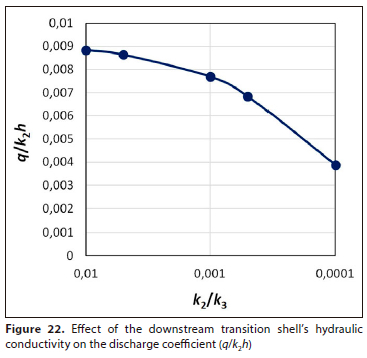
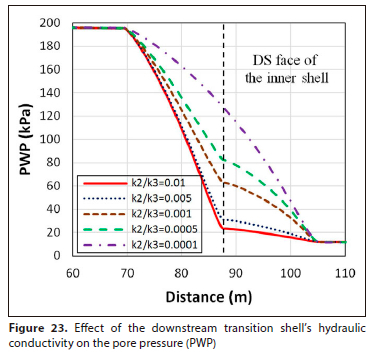
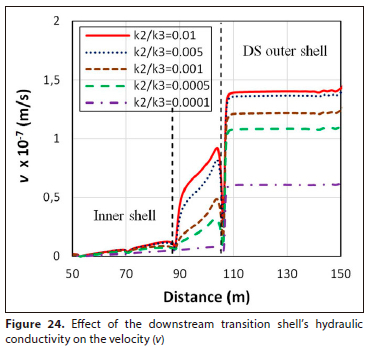
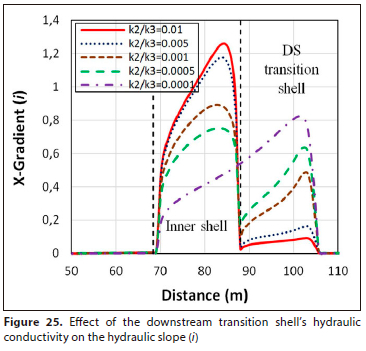
Figure 24 shows the effect of the downstream transition shell's hydraulic conductivity on the water velocity in the horizontal direction (v). The chart illustrates that the velocity at the downstream outer shell is reduced with the reduction of the hydraulic conductivity of the downstream transition shell (By 14% at k2/k3 = 0.001 and 57% at k2/k3 = 0.0001). The effect of the downstream transition shell's hydraulic conductivity on the hydraulic slope in the horizontal direction (z) is illustrated in Fig. 25. The chart shows that reducing the hydraulic conductivity of the downstream transition shell increases the hydraulic slope in the downstream transition shell (by about 420% at k2/k3 = 0.001 and 720% at k2/k3 = 0.0001).
Effect of the hydraulic conductivity of the outer shells
Effect of the upstream and downstream outer shells
To determine the influence of the permeability coefficient of the outer shells on the seepage flow in the introduced embankment dam, 5 numerical models were used with a relative hydraulic conductivity between the outer and transition shells (k3/k2) ranging from 100 to 1.
The effect of the outer shells' hydraulic conductivity on the seepage surface at the upstream face of the inner shell (h1/h) is shown in Fig. 26. The chart illustrates that reducingthe hydraulic conductivity of the outer shells causes a small reduction in the seepage surface at the upstream face of the inner shell. Figure 27 illustrates the effect of the outer shells' hydraulic conductivity on the seepage surface at the downstream face of the inner shell (h2/h). Reducing the hydraulic conductivity of the outer shells increases the seepage surface at the downstream face of the inner shell (by 97%).
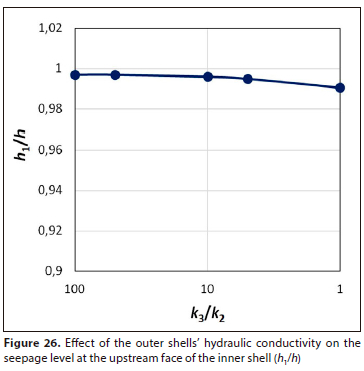
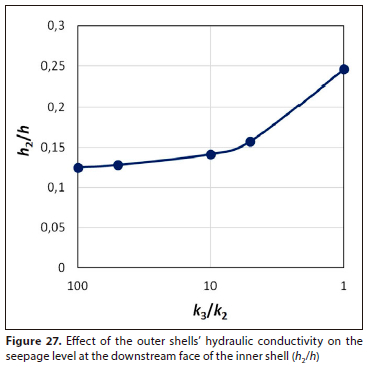
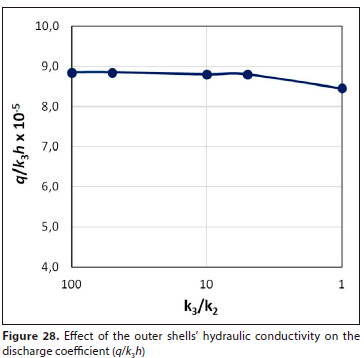
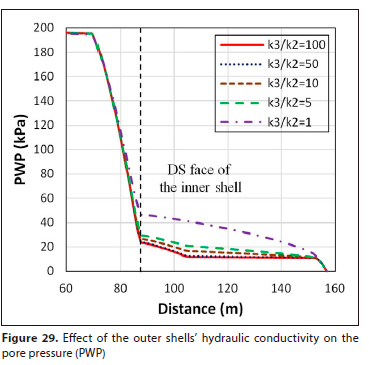
Figure 28 shows the effect of the outer shells' hydraulic conductivity on the discharge coefficient (q/k2h). It is concluded that the seeped water quantity is reduced slightly by reducing the hydraulic conductivity of the outer shells (by about 5%). The effect of the outer shells' hydraulic conductivity on the pore pressure (PWP) is illustrated in Fig. 29. From the chart, reducing the hydraulic conductivity of the outer shells increases the pore pressure at the downstream face of the inner shell (by 98%).
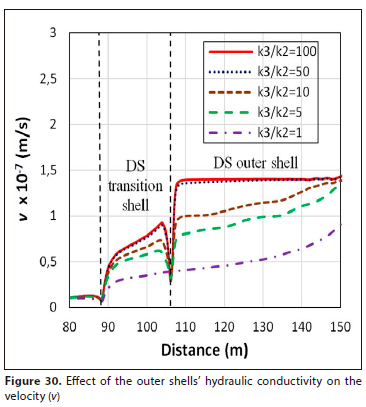
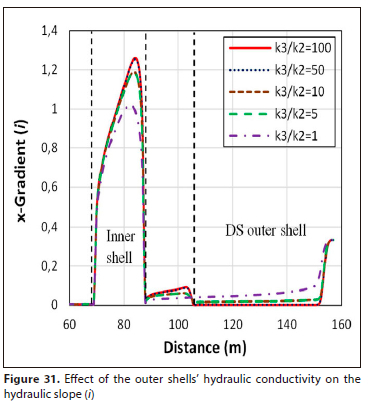
The effect of the outer shells' hydraulic conductivity on the water velocity in the horizontal direction (v) is shown in Fig. 30. The chart illustrates that the velocity at the downstream outer shell is reduced with the reduction of the hydraulic conductivity of the outer shells (by about 35%). Figure 31 illustrates the effect of the outer shells' hydraulic conductivity on the hydraulic slope in the horizontal direction (i). The chart shows that reducing the hydraulic conductivity of the outer shells increases the hydraulic slope in the downstream outer shell.
Effect of the upstream outer shell
To investigate the influence of the permeability coefficient of the upstream outer shell on the seepage flow in the introduced embankment dam, 5 numerical models were used with a relative hydraulic conductivity between the upstream outer and transition shells (k3/k2) ranging from 100 to 1.
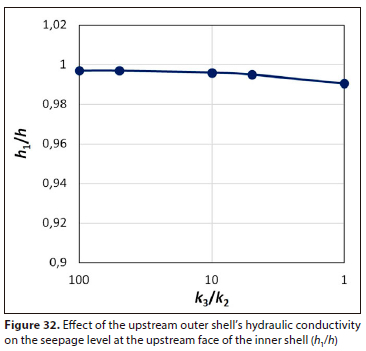
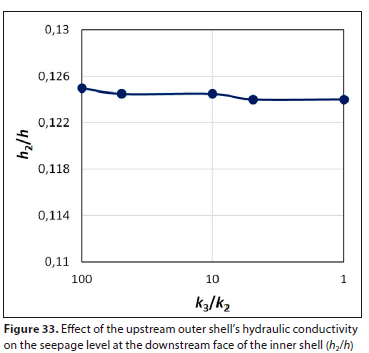
Figure 32 shows the effect of the upstream outer shell's hydraulic conductivity on the seepage surface at the upstream face of the inner shell (h1/h). The chart illustrates that reducing the hydraulic conductivity of the upstream outer shell causes a small reduction in the seepage surface at the upstream face of the inner shell. The effect of the upstream outer shell's hydraulic conductivity on the seepage surface at the downstream face of the inner shell (h2/h) is illustrated in Fig. 33. Reducing the hydraulic conductivity of the upstream outer shell slightly reduces the seepage surface at the downstream face of the inner shell.
The effect of the upstream outer shell's hydraulic conductivity on the discharge coefficient (q/k3h) is illustrated in Fig. 34. It is noticed that the seeped water quantity is reduced slightly by reducing the hydraulic conductivity of the upstream outer shell. Figure 35 illustrates the effect of the upstream outer shell's hydraulic conductivity on the pore pressure (PWP). From the chart, reducing the hydraulic conductivity of the upstream outer shell causes a slight reduction in the pore pressure at the upstream transition shell.
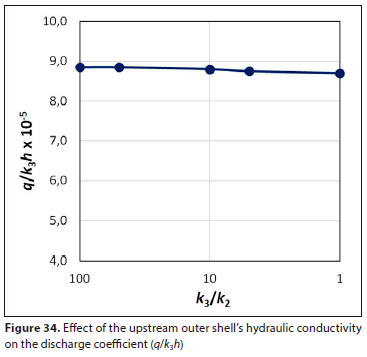
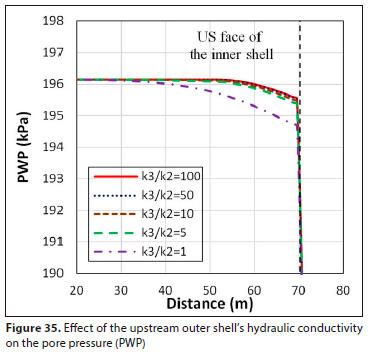
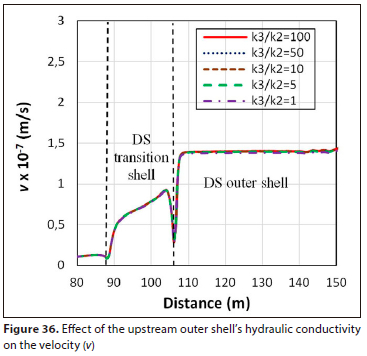
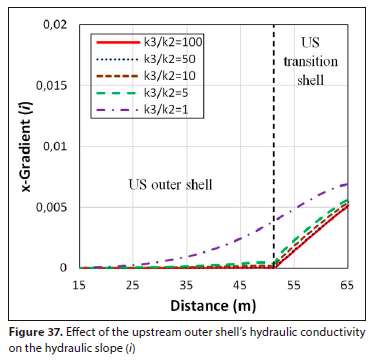
Figure 36 shows the effect of the upstream outer shell's hydraulic conductivity on the water velocity in the horizontal direction (v). The chart illustrates that the velocity is reduced very slightly with the reduction of the hydraulic conductivity of the upstream outer shell. The effect of the upstream outer shell's hydraulic conductivity on the hydraulic slope in the horizontal direction (i) is illustrated in Fig. 37. The chart shows that reducing the hydraulic conductivity of the upstream outer shell slightly increases the hydraulic slope in the upstream outer shell.
Effect of the downstream outer shell
To determine the influence of the permeability coefficient of the downstream outer shell on the seepage flow in the introduced embankment dam, 5 numerical models were used with a relative hydraulic conductivity between the downstream outer and transition shells (k3/k2) ranging from 100 to 1.
The effect of the downstream outer shell's hydraulic conductivity on the seepage surface at the upstream face of the inner shell (h1/h) is shown in Fig. 38. The chart illustrates that reducing the hydraulic conductivity of the downstream outer shell causes a small increase in the seepage surface at the upstream face of the inner shell. Figure 39 illustrates the effect of the downstream outer shell's hydraulic conductivity on the seepage surface at the downstream face of the inner shell (h2/h). Reducing the hydraulic conductivity of the downstream outer shell increases the seepage surface at the downstream face of the inner shell (by 98%).
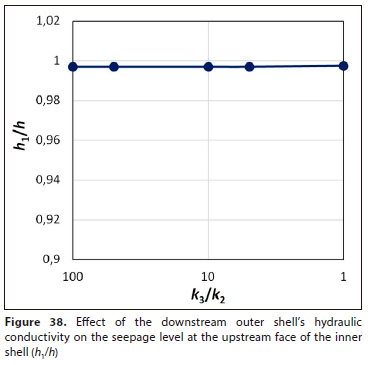
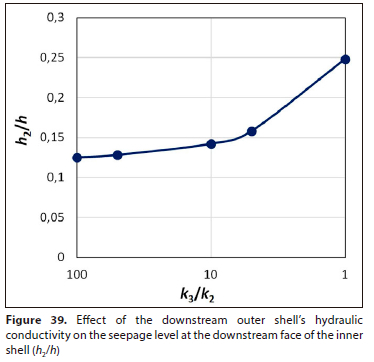
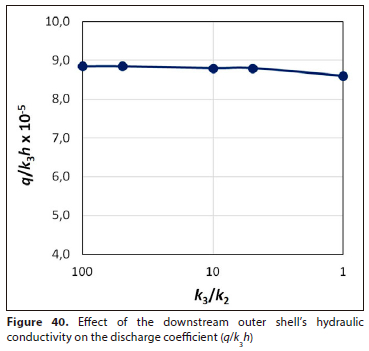
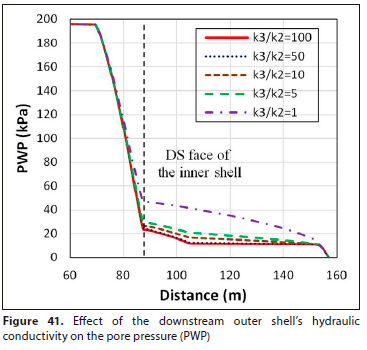
Figure 40 shows the effect of the downstream outer shell's hydraulic conductivity on the discharge coefficient (q/k3h). It can be seen that the seeped water quantity is reduced slightly by reducing the hydraulic conductivity of the downstream outer shell. The effect of the downstream outer shell's hydraulic conductivity on the pore pressure (PWP) is illustrated in Fig. 41. From the chart it is noted that reducing the hydraulic conductivity of the downstream outer shell causes an increase in the pore pressure at the downstream face of the inner shell (with 100%).
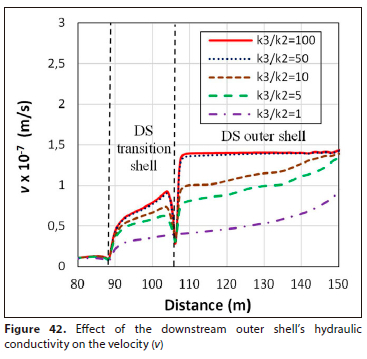
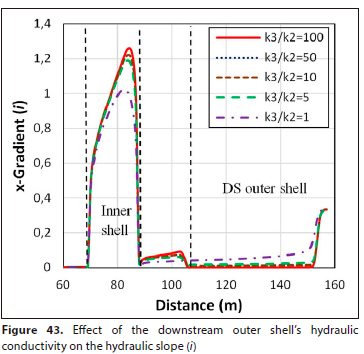
The effect of the downstream outer shell's hydraulic conductivity on the water velocity in the horizontal direction (v) is shown in Fig. 42. The chart illustrates that the velocity at the downstream outer shell is reduced by the reduction of the hydraulic conductivity of the downstream outer shell (by about 34%). Figure 43 illustrates the effect of the downstream outer shell's hydraulic conductivity on the hydraulic slope in the horizontal direction (i). The chart shows that reducing the hydraulic conductivity of the downstream outer shell increases the hydraulic slope in the downstream outer shell.
Comparison between the different shells of the earth dam
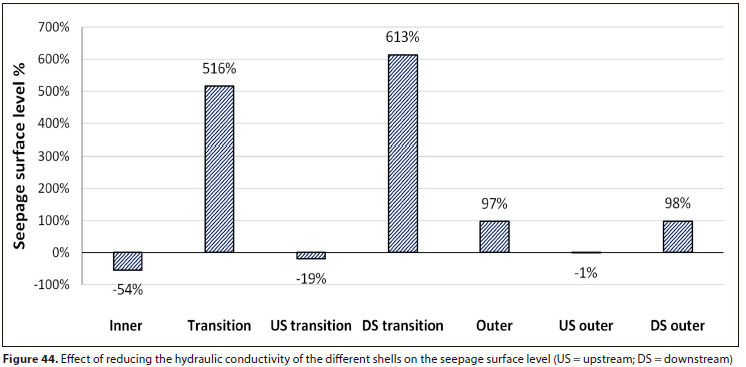
Effect on the seepage surface level
Figure 44 shows the effect of reducing the hydraulic conductivity of the different shells on the seepage surface level. The seepage surface level is reduced by reducing the hydraulic conductivity of the inner and upstream shells, while it increases with the reduction of the hydraulic conductivity of both the upstream and downstream shells or the downstream shells only.
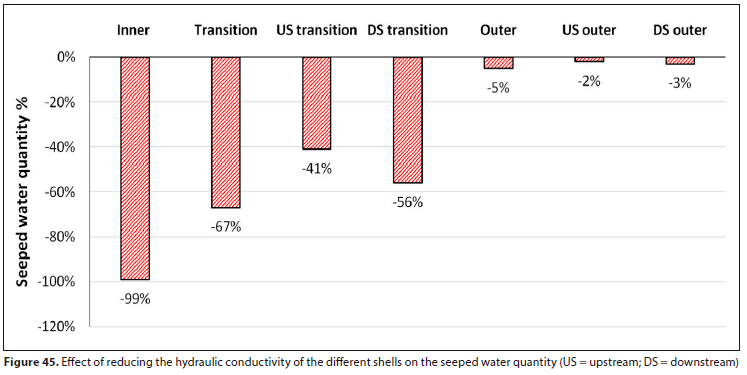
Effect on the seeped water quantity
Ihe influence of reducing the hydraulic conductivity of the different shells on the seeped water quantity is illustrated in Fig. 45. It is seen that a remarkable reduction in the seeped water quantity is achieved by reducing the hydraulic conductivity of the inner and transition shells, where a slight reduction is obtained for the outer shells.
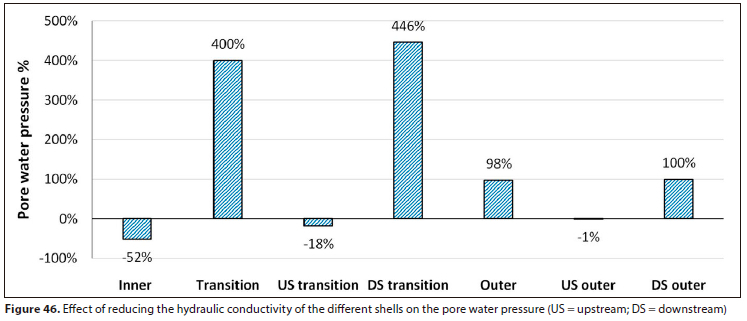
Effect on pore pressure
Figure 46 shows the effect of reducing the hydraulic conductivity of the different shells on the pore pressure. From the chart, it is concluded that the pore water pressure is reduced by reducing the hydraulic conductivity of the inner and upstream shells, while pore water pressure is increased by reducing the hydraulic conductivity of both the upstream and downstream shells or the downstream shells only.
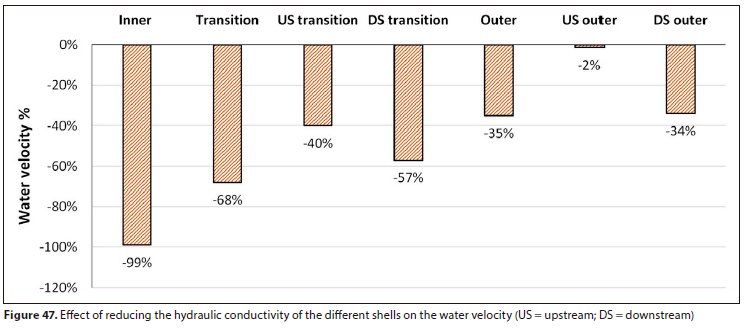
Effect on water velocity
The effect of reducing the hydraulic conductivity of the different shells on the water velocity is shown in Fig. 47. The chart illustrates that a noticeable reduction in the water velocity occurs by reducing the hydraulic conductivity of the different shells. The maximum reduction is for the inner shell followed by the downstream shells.
CONCLUSIONS
• The numerical results obtained using Seep/w are in good agreement with those using Seep2D.
• The optimum value of the relative hydraulic conductivity between the materials used in the inner and transition shells is about 0.001.
• It is recommended to use materials that have less hydraulic conductivity in the upstream transition and outer shells compared to the downstream shells.
• The pore water pressure in the dam body increases significantly when using low hydraulic conductivity materials in both upstream and downstream shells or the downstream shells only, while a remarkable reduction is obtained in the quantity of the seeped water and velocity.
• A moderate reduction in the different seepage parameters is achieved by reducing the hydraulic conductivity of the upstream transition shell, where a small reduction occurs with the upstream outer shell.
SYMBOLS
B: bottom width of the dam (L)
b: top width of the dam (L)
H: height of the dam (L)
h: upstream water head (L)
h1 seepage level at the upstream face of the inner shell (L)
h2: seepage level at the downstream face of the inner shell (L)
i: hydraulic slope (dimensionless)
k1:. hydraulic conductivity of the inner shell (L/T)
k2: hydraulic conductivity of the transition shells (L/T)
k3: hydraulic conductivity of the outer shells (L/T)
PWP: pore water pressure (M/(LT2))
q: seeped water quantity (L/T)
v: water velocity (L/T)
AUTHOR CONTRIBUTIONS
Mahmoud M Mostafa: investigation, methodology, formal analysis, writing - original draft. Shen Zhenzhong: supervision, conceptualization, writing - review and editing.
ORCIDS
Mahmoud M Mostafa: https://orcid.org/0000-0003-4141-1837
Shen Zhenzhong: https://orcid.org/0000-0002-6049-8221
REFERENCES
ABOELELA MM (2016) Control of seepage through earth dams based on pervious foundation using toe drainage systems, J. Water Resour. Protect. 8 (12) 1158-1174. https://doi.org/10.4236/jwarp.2016.812090 [ Links ]
AL-JANABI AMS (2013) Study of seepage through earth-fill dam using physical and numerical models. Doctoral dissertation, University Putra Malaysia, Seri Kembangan, Malaysia. https://doi.org/10.29252/acadpub.jrh.8.1.68 [ Links ]
AQUAVEO (2021) Groundwater modelling system (GMS) - SEEP2D. URL: https://www.aquaveo.com/software/gmsseep2d (Accessed January 2022). [ Links ]
BEIRANVAND B and KOMASI M (2021) An investigation on performance of the cut off wall and numerical analysis of seepage and pore water pressure of Eyvashan earth dam. Iran. J. Sci. Technol. Trans. Civ. Eng. 45 (3) 1723-1736. https://doi.org/10.1007/s40996-021-00613-y [ Links ]
FATTAH MY, AL-LABBAN SN and SALMAN FA (2014) Seepage analysis of a zoned earth dam by finite elements. Int. J. Civ. Eng. Technol. 5 (8) 128-139. [ Links ]
FLORES-BERRONES R and LOPEZ-ACOSTA NP (2011) Internal erosion due to water flow through earth dams and earth structures. Intech Open 284-294. https://doi.org/10.5772/24615 [ Links ]
FU X, GU CS, SU HZ and QIN XN (2018) Risk analysis of earth-rock dam failures based on fuzzy event tree method. Int. J. Environ. Res. Public Health 15 (5) 1-22. https://doi.org/10.3390/ijerphl5050886 [ Links ]
GARG SK (2013) Irrigation Engineering And Hydraulic Structures (23rd rev. edn). Khanna Publishers, New Delhi. [ Links ]
GEO-SLOPE (2018) Seepage Modelling with SEEP/W - An Engineering Methodology (July 2018 edn). GEO-SLOPE International. URL: http://www.geo-slope.com (Accessed August 2021). [ Links ]
JAVDANI A, YUSEFZADEH-FARD M and MORADI G (2015) A study on the effect of implementing waterproof membrane on reduction of water seepage from earthen dams (case study: Shahid madani earthen dam, Tabriz, Iran). Cumhuriyet Üniversitesi Fen Edebiyat Fakultesi Fen Bilimleri Dergisi 36 (3) 2693-2717. [ Links ]
KHASSAF SI and MADHLOOM AM (2017) Effect of impervious core on seepage through zoned earth dam (case study: Khassa Chai dam). Int. J. Sci. Eng. Res. 8 (2) 1053-1064. [ Links ]
KOS K, GRUCHOT A and ZAWISZA E (2021) Bottom sediments from a dam reservoir as a core in embankments-filtration and stability: a case study. Sustainability 13 (3) 1-19. https://doi.org/10.3390/su13031221 [ Links ]
Li G, SHEN Z and YANG C (2020) A simplified calculation method of seepage flux for slope-wall rock-fill dams with a horizontal blanket. Appl. Ssi. 10 (11) 1-20. https://doi.org/10.3390/appl0113848 [ Links ]
MODI PN (2014) Irrigation water resources and water power engineering. (9* edn). Standard Book House, New Delhi, India. [ Links ]
MOSTAFA MM and SHEN Z (2021) A review on analysis of seepage in zoned earth dams. 2nd International Conference on Civil Engineering: Recent Applications and Future Challenges, Hurghada, Egypt 2 (1) 137-146. [ Links ]
OMOFUNMI OE, KOLO JG, OLADIPO AS, DIABANA PD and OJO AS (2017) A review on effects and control of seepage through earth-fill dam. Curr. J. Appl. Sei. Technol. 22 (5) 1-11. https://doi.org/10.9734/cjast/2017/28538 [ Links ]
SALEM MN, ELDEEB HM and NOFAL SA (2019) Analysis of seepage through earth dams with internal core. Int. J. Eng. Res. 8 (1) 768-777. https://doi.org/10.17577/IJERTV8IS080168 [ Links ]
SAZZAD MM and ALAM S (2020) Numerical investigation of seepage through earth dam by FEM. Int. Conf Adv. Civ. Eng. 5 (1) 1-7. [ Links ]
SAZZAD MM, ROY M and RAHMAN MM (2015) FEM based seepage analysis through earth dam. Int. J. Adv. Struct. Geotech. Eng. 4 (3) 158-164. [ Links ]
SAZZAD MM, ROY M and RAHMAN MS (2014) Comparison between numerical and analytical solution of seepage flow through earth dam. 2nd International Conference on Advances in Civil Engineering 2 (1) 300-306. [ Links ]
USBR DESIGN STANDARDS (2012) No. 13., Embankment Dams. United States Department of the Interior Bureau of Reclamation. [ Links ]
ZHANG L M, XU Y and JIA J S (2009) Analysis of earth dam failures: A database approach. Georisk 3 (3) 184-189. https://doi.org/10.1080/17499510902831759 [ Links ]
ZHANG W, SHEN Z, REN J, BIAN J, XU L and CHEN G (2021) Multifield coupling numerical simulation of the seepage and stability of embankment dams on deep overburden layers. Arab. J. Sci. Eng. 1-16. https://doi.org/10.1007/sl3369-021-06112-6 [ Links ]
 Correspondence:
Mahmoud M Mostafa
Email: eng.mmm91@aun.edu.eg
Received: 8 February 2023
Accepted: 21 December 2023

