


Services on Demand
Article
 English (pdf)
 Article in xml format
 Article references
Indicators

Related links
-
 Cited by Google
 -
 Similars in Google
Share

 Permalink
Water SA
On-line version ISSN 1816-7950
Print version ISSN 0378-4738
Water SA vol.50 n.1 Pretoria Jan. 2024
http://dx.doi.org/10.17159/wsa/2024.v50.i1.4064
RESEARCH PAPER
Investigation of the effect of variable-sized energy dissipating blocks on sluice gate performance
Enes GülI; Zeyneb KiliçII; Erding IkinciogullariIII; M Cihan AydinIV
IDepartment of Civil Engineering, Inonu University, Malatya, Türkiye
IIDepartment of Civil Engineering, Adiyaman University, Adiyaman, Türkiye
IIIDepartment of Civil Engineering, Bingol University, Bingol, Türkiye
IVDepartment of Civil Engineering, Bitlis Eren University, Bitlis, Türkiye
ABSTRACT
The present research used a combination of experimental and numerical methods to investigate energy dissipation blocks of different heights placed downstream of a sluice gate in an open channel flow. Numerical model simulations were performed using a 3D computational fluid dynamics (CFD) technique, using the Reynolds-averaged Navier-Stokes (RANS) equations with the volume of fluid (VOF) and k-ε turbulence models. The accuracy of the numerical model and the grid sensitivity was assessed according to a recommended procedure in the literature. Different hydraulic and geometry conditions were investigated to understand the energy dissipation behaviour of the blocks. The hydrodynamic effects of different block spacings, heights and configurations were analysed by means of CFD simulations. The results show that the variable size blocks have a high energy dissipation efficiency in sluice gate flows, particularly at high Froude numbers. The energy dissipation efficiency of the blocks downstream of a sluice gate can reach up to 55% for high discharges (Q = 35 L/s). Interestingly, the energy dissipation performance of small gate openings exceeds that of large gate openings, reaching a peak efficiency of 40% for the same discharge. In addition, the block spacing has a minimal effect on the energy dissipation, while smaller block spacing results in a smoother water surface profile.
Keywords: sluice gate flow, energy dissipation, free surface flow, computational fluid
INTRODUCTION
Energy dissipation is a significant challenge for water structure designers. One solution to this problem is the utilisation of hydraulic jumps as an effective energy dissipator in hydraulic structures, such as spillways, sluice gates, and drops (Hager, 2013). However, the characteristics of the hydraulic jump can vary significantly depending on several factors, including the channel cross-section, the bottom slope, the surface roughness (Roushangar et al., 2022; Saghebian, 2019), and the presence of additional energy dissipation structures (Abdelkader, 2022). Engineers have employed baffle blocks and sills to enhance energy dissipation. This is particularly important because hydraulic jumps, while essential for reducing bed scour and other damage to hydraulic structures by decreasing heads and velocities, also require effective energy dissipation. By implementing efficient energy dissipation measures, the extent of the damage can be minimised, and the consequences reduced. However, in order for these solutions to be cost-effective, it is crucial to optimise the energy dissipation. To address these concerns and safeguard rivers and hydraulic structures from damage, the United States Department of the Interior, Bureau of Reclamation (USBR) has recommended various types of stilling basins and energy dissipators tailored to specific flow and spillway characteristics (Peterka, 1984). These devices have been shown to reduce the hydraulic jump length and increase energy dissipation performance (Peterka, 1978). The use of various types and configurations of energy dissipators has also been found to be effective in dissipating energy of the flow and accelerating the formation of hydraulic jumps (Habibzadeh et al., 2016; Habibzadeh et al., 2012; AlTalib et al., 2019). In terms of energy dissipation effectiveness, the angular blocks have demonstrated superior performance compared to oval-edged types (Peterka, 1984). Furthermore, Kang (2017) showed that the square block has the most favourable flow distribution among various shapes including square, round, equilateral triangle, trapezoidal, and stepped shapes (Kang, 2017). The wider the sill, the more vortices are released, resulting in increased energy loss (Daneshfaraz, Norouzi, Abbaszadeh, and Azamathulla, 2022). Similarly, energy dissipation increases as the size of the baffle blocks downstream of the sluice gate increases (Abdelkader, 2022). In the case of a submerged hydraulic jump, it was shown that the distance of the baffle blocks from the gate affects the flow regime but has little impact on energy dissipation efficiency (Habibzadeh et al., 2011). Based on experimental results, it was shown that placing 2 rows of blocks dissipates more energy than using a single row of blocks (Abbas et al., 2018). Furthermore, optimal performance is achieved when baffle blocks of equal height in 2 rows are placed at a distance ranging from 0.5 to 3 times the block width, with a distance equal to the block width being the most effective (Kaya, 2007). Oblique jumps and transverse contractions significantly affect the shape and size of the jets (Bijankhan and Kouchakzadeh, 2015; Bijankhan and Kouchakzadeh, 2015). The interactions between jets emerging from parallel gates can be reduced and the intensity of the oblique jump can be reduced by using longer pier walls (Guo et al., 2021).
Open channel flow investigations are commonly carried out using physical hydraulic models. However, advances in computational fluid dynamics (CFD) techniques have enabled the successful modelling of such hydraulic problems using numerical methods (Aydin and Isik, 2015; Aydin, 2016; Aydin et al., 2022; Kumcu, 2017; Aydogdu et al., 2022; Babaali et al., 2015; Gumus et al., 2013). For example, Gumus et al. (2013) used both experimental and numerical methods to investigate the submerged hydraulic jump under a sluice gate (Gumus et al., 2013). They tested various k-ε turbulence models and used the realizable k-ε turbulence closure to determine the free water surface profile and the submerged hydraulic jump geometry. Similarly, Gumus et al. (2016) employed both numerical and experimental analyses to investigate the hydraulic properties of a submerged hydraulic jump in open channel flow (Gumus et al., 2016). They preferred the Reynolds stress closure model to achieve more accurate predictions for horizontal velocities. Aydin and Ulu (2017) analysed the effects of sills with different sizes and shapes placed downstream of a sluice gate under submerged flow conditions using a two-dimensional numerical model (Aydin and Ulu, 2017). They found that the sills can effectively reduce the flow energy in a submerged sluice gate flow. Daneshfaraz et al. (2022) studied the effect of sills with different geometric conditions on the hydraulic properties of sluice gate flows by combining experimental and numerical methods (Daneshfaraz et al., 2022). They successfully used the Flow-3D software with the RNG turbulence model to simulate their hydraulic model. In addition, Aydin et al. (2022) conducted an experimental and numerical study to investigate the effects of slit-check dams composed of different-sized trapezoidal blocks on the flow hydraulics in subcritical open channel flow (Aydin et al., 2022). The resistance of the blocks to the flow and the formation of a hydraulic jump resulted in a total energy loss of 30%. The numerical modelling, carried out with Flow-3D using VOF and k-ε models, agreed with the experimental observations with a relative error of less than 8%.
As the design of energy dissipator blocks plays a crucial role in the effectiveness of energy dissipation and flow dynamics, it is essential to conduct further studies to provide guidance to designers. Therefore, the present study focused on contributing to the literature by investigating the hydrodynamic and energy dissipation performance of energy dissipator blocks of variable size placed in 3 rows downstream of a sluice gate in an open channel. This study builds on previous studies and enriches the knowledge of the effects of different block sizes and configurations on energy dissipation and flow dynamics.
Background
Sluice gates are a widely used to regulate water levels and flows in open channels. Sluice gates have been extensively studied both theoretically and experimentally (Rajaratnam and Subramanya, 1967a, b; Rajaratnam, 1977; Swamee, 1992; Lin et al., 2002; Habibzadeh et al., 2011). Figure 1 shows a schematic representation of a sluice gate operating in a free-flow scenario, where the upstream water depth, gate opening and gate tip geometry influence the discharge downstream of the gate. The discharge passing through a sluice gate can be related to the upstream water depth in both freeflow and submerged flow conditions (Alminagorta and Merkley, 2009), as indicated in Eq. (1):
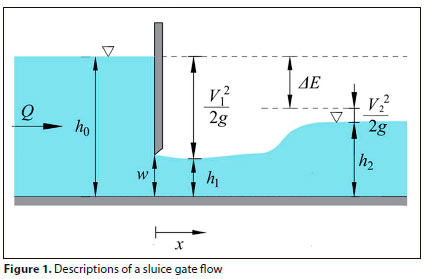
where q = discharge per unit width of the channel; Cd = discharge coefficient of the sluice gate; g = gravitational acceleration; and h0 = water depth upstream of the sluice gate.
A hydraulic jump can convert supercritical flow (Fr1 > 1) into subcritical flow (Fr1 < -1). The sequent water depths are calculated by the Belanger equation (Chow, 1959):
where Fr1 = Froude number at the supercritical section of the jump, and h1 and h2 = water depths at the supercritical and subcritical section of the jump, respectively.
The water depths before and after the hydraulic jump can be used to quantify the energy loss (ΔE) produced by the hydraulic jump (Fig. 1). The specific energy curve demonstrates that the specific energy of h2, E2, is, nevertheless, less than the specific energy of h1, E1. That energy was dissipated during the hydraulic jump (ΔE = E1 - E2). Therefore, the relative energy loss (η = ΔE/E1) may be written based on the specific energy theorem as follows:
where V1 and V2 = velocities at the supercritical and subcritical sections of the jump, respectively. The high turbulence created by hydraulic jumps using baffles and sills makes velocity measurements difficult (Hager, 2013). This is where the CFD technique can provide a significant advantage.
When numerous physical variables define a problem, dimensional analysis simplifies the transformation of the variables into dimensionless groups. This study used the Buckingham-π theorem, a dimensionless analysis method. The theorem's key steps involve categorising relevant variables, expressing them in terms of physical phenomena, converting the variables into dimensionless groups, and finally expressing all physical quantities in several main dimensions.
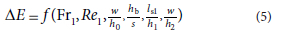
The method for enhancing hydraulic jump development and energy dissipation entails positioning energy dissipators downstream of the sluice gate. Figure 2 shows the geometric parameters of the channel, sluice gate, and blocks pertinent to this study. Energy dissipation in a rectangular channel with energy dissipator blocks can be expressed as a function of the parameters in Fig. 2 as follows:

where: μ denotes the dynamic viscosity of water, ρ represents the flow density, a signifies the baffle block dimensions, ls1 is the distance of the first row of blocks from the sluice gate, s is the distance between the row blocks, hb is the height of the block, and B is channel width.
To account for repetitive parameters with different dimensions, a selection is made corresponding to the number of dimensions the problem contains, typically three. In this research h1, g and μ, which are frequently encountered in flow problems, were selected as repetitive parameters, whereas a, s, ls1 and B were held constant.
Using the Buckingham-π theorem, the following 6 dimensionless parameters were derived:
METHODS
Physical model
The experiments for this study were conducted at the hydraulic laboratory of Inonu University (Turkey) to investigate the performance of energy dissipator blocks. The experimental setup consisted of a 12.00 x 0.60 x 0.385 m channel with glass sidewalls. The water was pumped back from the downstream reservoir to the upstream reservoir, with the flowmeter and pump communicating via the Modbus communication system (Fig. 2a). Discharge was measured using an electromagnetic flowmeter with an accuracy of ±0.01 m3/s. The water level was measured via a Mitutoyo digital meter with an accuracy of ±0.01 mm. The sluice gate was located 4.0 m from the inlet of the channel.
Peterka (1984) pointed out that the generalized design parameters of the baffled aprons for canal or spillway drops can be obtained from test results on several models of baffled chutes and from one model which was modified as necessary to obtain information of value in the design of a chute for any installation. As seen in Fig. 2, the baffle blocks were designed from the results of a series of preliminary tests, taking into account the design criteria of Peterka (1984) and laboratory facilities. The first row of blocks was placed 400 mm downstream of the gate to prevent the sluice gate flow from being directly affected by the flow conditions hitting the first blocks. Square blocks of 50 x 50 mm were preferred, taking into account the width of the test channel (approximately 1/8). Similar to Peterka's (1984) design, the distance between blocks in a row was chosen to be equal to the block width, and the 2nd and 3rd rows of blocks were placed consecutively, staggered. The height of the first row of blocks was taken as 25 mm and, to better accommodate the flow rising from the hydraulic jump, the heights of the 2nd and 3rd rows of blocks were increased by 50% and chosen as 37.5 mm and 56.25 mm, respectively (Fig. 2b). The spacing between the rows of blocks was chosen as a multiple of the block widths, 5 = 2a = 100 mm and 5 = 3a = 150 mm. Considering the laboratory constraints, the gate openings were set at 60 and 70 mm to ensure that the sluice gate flow was in the supercritical flow regime and that the blocks remained in submerged conditions (Fig. 3). The ratio of block width to block height (a/hb) is 1.40 on average, which is close to Peterka's (1984) design ratio. This design aims to achieve effective energy loss by producing momentum exchange and shear stresses between blocks and flow under free flow conditions.
Numerical model
A viscous Newtonian flow is generally governed by the continuity and momentum (Navier-Stokes) equations in a solution domain. These two equations are discretized by Flow-3D software using a numerical discretization method, such as the finite volume method. For incompressible single-phase fluid flows, the primary form of the momentum and continuity equations in Cartesian coordinates are given as the following equations, respectively:
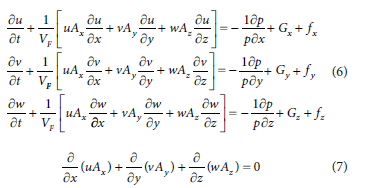
where: t is time; ρ is the fluid density; VF is the volume fraction open to flow; u, v, w are velocity components; Ax, Ay, Az are fractional areas open to flow in Cartesian coordinates; Gx, Gy, Gz are mass accelerations; fx, fy, fz are viscous accelerations. While Eqs 6 and 7 manage the fluid motion with mass and pressure forces through viscous effects, they can also track the free water surface by calculating the fluid fraction of each cell using the VOF model. Hirt and Nichols (1981) described the VOF formulation, which is most preferred method to describe a free interface (Hirt and Nicols, 1981):
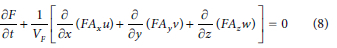
Here, F represents volume fraction occupied by the fluid for a single fluid. If F = 1 the cell is full of fluid, if F = 0 the cell is empty (void), and 0 < F < 1, the cell contains a free surface.
The k-ε model is the most preferred and has been successfully documented in the literature as a turbulence model for the free-surface problem (Yalcin et al., 2023). The k-ε turbulence model, which consists of two transport equations for the turbulent kinetic energy k and its propagation ε, was preferred in this study. Turbulent kinetic energy is the mean kinetic energy per unit mass associated with eddies in turbulent flow. In the k-epsilon model, k is one of the two transported variables that are used to calculate the turbulent viscosity and the Reynolds stresses.
Turbulent kinetic energy is the specific kinetic energy associated with turbulent velocity fluctuations in flow:
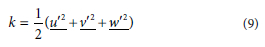
in which, u, v and W are turbulent fluctuation components. Another important parameter in the k-ε model, the turbulent dissipation rate, epsilon, is a measure of how fast the turbulent kinetic energy is converted into thermal energy by viscous forces in a turbulent flow. An additional transport equation is solved for the turbulent dissipation (ε).

in which C1, C2 and C3 were defined as 1.44, 1.92 and 0.2, respectively, PT is the turbulent kinetic energy production, and GT is the buoyancy production term. The diffusion of dissipation, De, is:
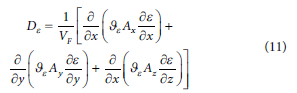
where υε is the diffusion coefficient of k computed based on the local value of the turbulent viscosity (Flow Science, 2019).
Solution grid and boundary conditions
To complement the physical laboratory test, a 3-D numerical model was developed to simulate the channel, as shown in Fig. 4. The numerical model considered the channel 1.0 m upstream and 3.0 m downstream of the sluice gate (Fig. 4a). The baffle blocks were modelled as solid objects, placed 400 mm downstream of the gate. The inlet and outlet boundaries were applied with adjustable water levels to provide similar upstream flow conditions to the physical model. The sidewall and bottom of the channel were defined as a no-slip wall boundary condition, while the upper part was defined as a symmetry boundary condition. The solution domain was meshed with orthogonal grid elements, with smaller conformal cell sizes used to achieve sharper boundaries on solid elements such as the gate and baffle blocks (Fig. 4b). An extensive grid sensitivity analysis was performed to ensure optimal mesh quality.
The numerical grid concept used by Flow-3D is presented in Fig. 5. In this schema, the fluid properties are defined at the cell centre and vector properties are defined on the cell surface (Fig. 5a). Flow-3D uses a modified volume of fluid method (TruVOF) based on the VOF method to track the free surface (Fig. 5b). FAVOR (fractional area/volume obstacle representation) techniques are employed to define the geometry, while TruVOF (modified volume of fluid) is used to define the free surface. In the FAVOR method, as illustrated in Fig. 5c, two distinct ratios are defined, namely the volume fraction (Vf) and area fraction (Af). Similarly, in the TruVOF method, the volume fractions determine the occupancy rate of cells open to flow. A cell is assigned a volume fraction of F = 1 if it is entirely filled with fluid, F = 0 if it is empty, and 0 < F < 1 if it is partially filled (e.g., containing an interface such as a free water surface). TruVOF identifies free surfaces through a 3-step process: first, determining the location of the interface; second, establishing a sharp interface between the fluid phases (or between the gap and the fluid in the case of single-phase flow); and, finally, applying boundary conditions to this interface to achieve zero shear stress and constant pressure (Flow Science, 2019).
Control of numerical accuracy
The grid convergence index (GCI) is a technique used to assess discretisation errors in CFD simulations, employing the Richardson extrapolation method. This method entails executing the simulation a number of times on successively finer meshes. As the mesh becomes finer (i.e., the number of cells in the solution domain increases) and the time step decreases, both the spatial and temporal discretisation errors asymptotically approach zero. By quantifying the numerical errors as a percentage relative to the mesh size, this method establishes the potential confidence interval of the numerical solution. The GCI approach recommended by ASME (Roache et al., 1986; Çelik et al., 2008) was used in this study to control the numerical analysis. This approach was applied as follows: First, to see the effect of mesh resolution on the solutions, 3 different grid sizes (fine, h1 = 7.7 mm, medium, h2 = 10 mm, and coarse mesh, h3 = 13 mm) were applied to the numerical model, considering the grid refinement ratio of r = 1.3. These mesh sizes were determined after a series of pre-processing analyses, taking into account computational time and the minimum mesh refinement factor of 30% recommended by ASME (gelik et al., 2008). The quality of the mesh elements is excellent, as cubic structural meshes are used in the solution domain. The apparent order (p) can be given for a constant apparent order as follows (r = h3/h2 = h2/h1 = 1.3):
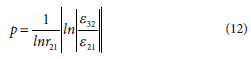
where: ε32 = φ3 - φ2, ε21 = φ2 - φ1, φι, denotes the solution on the kth grid. The extrapolated values are calculated as:
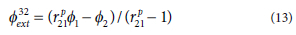
Similarly, the φ32ext value is calculated. After that, approximate relative error and extrapolated relative error are calculated, respectively, as follows:
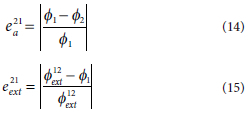
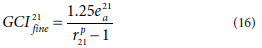
Then, the fine-grid convergence index can be estimated as:
Based on gelik et al. (2008), an average value of the apparent order calculated by Eq. 10 as p = pave was taken into account as a global value instead of a local p value in GCI calculations (gelik et al., 2008). In addition, for all analyses, iterative convergence was achieved with an at least 3 orders of magnitude decrease in the normalized residuals for each equation solved.
To assess the numerical uncertainty due to grid sensitivity, 3 different numerical outputs were used in this study. Fig. 6 shows the velocity and pressure contours for 3 different grid sizes. In addition, the free surface profiles along the channel axis (Fig. 7a and b), the horizontal velocity profiles between the blocks (Fig. 7c and d), and the velocity profiles along the flow depth downstream of the blocks (Fig. 7e and f) were also analysed. The results of the uncertainty analysis are presented in Table 1. According to these analyses, the maximum numerical uncertainty in the fine-grid solution was reported to be 7.31%, corresponding to ±6.8 mm for the free surface profiles, 6.22% corresponding to ±0.0422 m/s for the horizontal velocity profiles between the blocks, and 8.13% corresponding to ±0.0512 m/s for the downstream velocity profiles. The average numerical uncertainties were found to be 1.34%, 2.72% and 5.03% for the free surface level, the horizontal and the downstream velocities, respectively. These results suggest that all uncertainties due to the grid resolution are within reasonable limits and provide a good solution for the numerical uncertainty. Therefore, the medium mesh size was used in the analysis, taking into account the balance between solution time and reasonable accuracy.
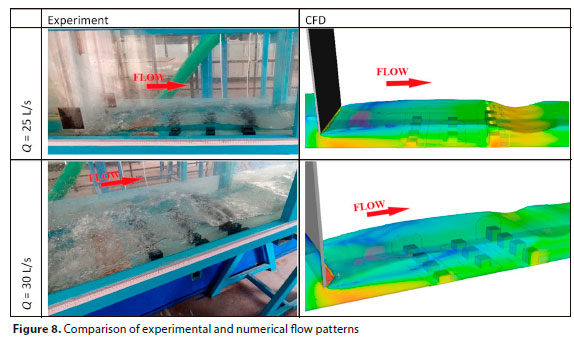
Figure 8 compares the flow conditions obtained from the physical and numerical models for 2 different discharges. Fig. 9 also compares the water surface profiles for the non-block. Figures 8 and 9 together demonstrate the successful modelling of the physical flow through numerical simulation, as the simulated results closely match the observed measurements.
Time-step control during iteration is a critical parameter that significantly affects the accuracy of the numerical solution. In FLOW-3D, the software automatically adjusts the time steps and recommends maintaining the maximum Courant number below 1.0. The Courant number, indicative of the accuracy of the approximation, represents the amount of fluid passing through a computational cell in a time step. The Courant number formula is C = UΔt/ΔH, where U is the fluid velocity, Δt is the time step, and Ah is the characteristic size of the computational cell. A larger Courant number corresponds to a less accurate approximation (Flow Science, 2019).
RESULTS AND DISCUSSION
The water surface profiles obtained from the CFD analyses to observe the effect of different geometric (where w = gate opening and s = baffle block spacing) and hydraulic conditions are plotted in Fig. 10. In these graphs, x = 0 indicates the upstream point of the gate, and x = 0.40 m indicates the starting point of the baffle blocks. It is observed that at low flows (i.e. Q = 25 L/s in Fig. 10), partially submerged flow conditions occur downstream of the cap due to the flow clinging to the downstream side of the sluice gate. This situation is also seen at the medium flow discharge for the high gate opening due to the lower flow velocity of the sluice gate (w = 70 mm) but not at the lower gate opening due to higher flow velocity (i.e., w = 60 mm). Furthermore, while the water surface is quite turbulent in free flow conditions due to the effect of the energy dissipating blocks, a smoother water surface is observed in partially submerged conditions. This fluctuation also indicates that the blocks generate high turbulence, which plays a crucial role in dissipating the energy of the flow. The effect of the block spacing is particularly evident in the difference between Figs 10c and 10d. For the small block spacing (s = 100 mm), a smooth water surface appears after a significant hydraulic jump due to the blocks. However, at the larger block spacing (i.e., s = 150 mm), significant fluctuations occur on the water surface after the hydraulic jump. Although these fluctuations can be effective in energy dissipation, a smoother water surface profile, as shown in Fig. 10c, is more favourable for hydraulic design. To see the effect of block spacing on the water surface more clearly, the dimensionless graphs in Fig. 11 were plotted. The effect of block spacing on the water surface is not very obvious, especially for low flow discharges and sluice gate openings. However, this effect is evident for large gate openings and high flow discharges.
Figure 12 illustrates numerical velocity profiles along the channel axis for maximum and minimum flow discharges in different geometric conditions. For low-flow discharges, a hydraulic jump occurs just downstream of the sluice gate due to the energy dissipating blocks, resulting in a partially submerged condition. In low-flow discharge scenarios, the flow velocity is low in the upper parts of the downstream flow, and reversible flows can even occur. As expected, the low pressure and low velocity regions immediately downstream of the blocks dissipate the energy of the flow. In addition, a second hydraulic jump is formed at the end of the blocks. At high-flow discharge, the fluctuations are observed in a region closer to the gate, due to the decrease in the flow velocity as the gate opening increases. Conversely, fluctuations are observed in a region further away from the blocks owing to the increase in momentum as the gate opening decreases. The model in Fig. 12f (s/w = 1.43) shows a reduction in flow velocity over a shorter distance and is therefore considered to be more successful in this respect.
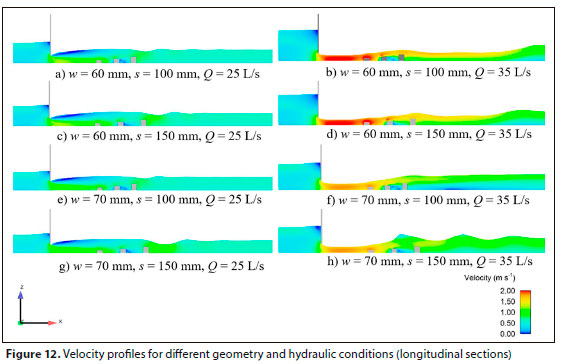
Figure 13 presents the pressure contours across the channel bottom for different sluice gate openings and block spacings at low and high flow rates. Increasing hydrostatic pressure means increasing flow depth and decreasing dynamic pressure. In this regard, observing the hydrostatic pressure change gives some indication of the energy dissipation performance of the models. While hydrostatic pressures are effective in the upstream region of the gate, the effect of the dynamic pressures also manifests itself in the downstream region where the flow velocity is high. The structural resistance of the blocks to the hydrodynamic pressures on them is an issue that needs to be considered separately. After the first two blocks that meet the flow, it can be seen that the dynamic pressures on the third block decrease. This low pressure has a positive effect on the strength of the last row of blocks, which is more fragile due to its taller and slender shape. A comparison of Figs 13b and 13d with Figs 13f and 13h shows that higher hydraulic jumps lead to an increase in hydrostatic pressure of about 600-700 Pa at the downstream channel bottom.
This increase in hydrostatic pressure corresponds to lower velocity values, consistent with the observations in Fig. 12. These figures indicate that the blocks with closer spacing are more favourable in terms of the downstream flow characteristics.
Figures 14 and 15 depict the velocity and turbulent energy distributions, respectively, of the flow along the horizontal plane near the bottom of the channel, for different flow and geometric conditions. In general, the flow velocity increases between the blocks and then decreases immediately downstream of the blocks. Thanks to the staggered arrangement of the blocks, the high velocity flows passing between the blocks are decelerated by the next row of blocks. This effect is particularly noticeable at higher approach Froude numbers (Fr1) and large flow discharges. Reducing the block spacing for large gate openings results in lower downstream flow velocities (Fig. 14e, f, g, h). Conversely, increasing the block spacing for smaller gate openings (Figs 14a, b, c and d) results in lower downstream velocities. Notably, smaller differences in velocities are observed for smaller gate openings. As can be seen in Fig. 15, in contrast to the velocity distribution, high turbulent energy is generated in the low-velocity regions immediately downstream of the blocks. These high-turbulence regions contribute significantly to the dissipation of the flow energy. This effect is more pronounced at high approaching Froude numbers (Fr1). Increasing the block spacing, especially at the large gate openings, plays an effective role in increasing the turbulent energy (i.e., Fig. 15e, g vs. f, h, respectively). This effect is less pronounced for small gate openings (Fig. 15a-d).
Table 2 evaluates the energy dissipation efficiency of the blocks under different geometric and hydraulic conditions. It can be seen that as the flow discharge through the sluice gate increases, the energy dissipation efficiency of the blocks also increases. This is a crucial aspect to consider in hydraulic structures, especially at high flow discharges. The energy dissipation rate can reach impressive levels, such as 55%, at high flow discharges. In terms of gate opening, the energy dissipation rates for low gate openings (W = 60mm) are approximately 40% higher than those for higher gate openings (w = 70 mm) for high discharge. This phenomenon is attributed to the heightened momentum resulting from the increased flow velocity caused by the reduction in the gate opening. According to Newton's third law of motion, the forces exerted by two objects on each other are always equal and opposite in direction. Therefore, according to the action-reaction principle, it is inferred that the energy dissipation rate increases as the blocks apply a greater opposing force. The energy dissipation rate of the larger block spacing (s = 150 mm) is slightly higher (about 3%) than that of the smaller block spacing (s = 100 mm) for high discharge. However, it should be noted that narrower block spacing provides a more favourable hydraulic condition in terms of free surface profiles, as previously discussed. The variation of the energy dissipation ratio (η) with the Froude number (Fr1) is almost linear, as shown in Fig. 16. The correlation of the linear changes for the experimental and numerical data is high, at 99%.
This plot also demonstrates the agreement of the experimental data with the numerical data.
CONCLUSION
This study investigates the hydrodynamic effects and energy dissipation performance of energy dissipator blocks of different sizes arranged in 3 rows downstream of a sluice gate in an open channel, using both experimental and numerical analysis. The robustness of the findings is supported by a thorough grid independence assessment and validation of a 3-dimensional numerical model. The results highlighted the significant impact of staggered and variable-sized dissipator blocks on the energy dissipation and sluice gate flow dynamics.
At low-flow discharges and approaching Froude numbers, the sluice gate flow exhibits partial submergence and a smooth downstream water surface. In contrast, higher flow discharges lead to a significant hydraulic jump and subsequent water surface fluctuations, particularly noticeable with larger block spacing. The study found that the last row of blocks, being taller and more fragile, experiences lower dynamic pressure than the first two rows, ensuring their structural integrity. In addition, due to their position in deeper flow resulting from a hydraulic jump, they exert a greater influence on the flow regulation, while their increased turbulence production enhances energy dissipation, especially at higher flow rates. This study observed an energy dissipation performance of up to 55% at high flow rates, with better performance (up to 40%) at lower gate openings. Although block spacing has a minimal effect on energy dissipation, closer block spacing results in smoother water surface profiles. Notably, at higher Froude numbers (Fr1), increasing block spacing is expected to improve efficiency by shifting the flow events causing energy dissipation further downstream of the blocks. Furthermore, the study established a linear relationship between the energy dissipation rate and the Froude number of approaching flow downstream of the sluice gate, corroborated by a good agreement between the experimental and numerical results.
The study pointed out that the energy dissipation performance depends on multiple parameters, such as block shape, size, configuration, channel shape, roughness, slope, and flow characteristics. By focusing on fundamental block shapes and configurations, this research aims to contribute to a deeper understanding of these factors by choosing effective and basic block shapes and configurations. It is recommended that future research consider similar objectives, with particular emphasis on real-world problems requiring the investigation of geometric parameters.
DECLARATION OF COMPETING INTEREST
The authors declare there is no conflict of interest.
FUNDING
The authors did not receive support from any organization for the submitted work.
REFERENCES
ABBAS A, ALWASH H and MAHMOOD A (2018) Effect of baffle block configurations on characteristics of hydraulic jump in adverse stilling basins. MATEC Web of Conferences 162 26-32. https://doi.org/10.1051/matecconf/201816203005 [ Links ]
ABDELKADER M (2022) Effect of various kinds of stilling basin's baffle blocks arrangement on river bed scour. Int. J. Environ. Sci. Nat. Resour. 30 (4). https://doi.org/10.19080/ijesnr.2022.30.556295 [ Links ]
ALMINAGORTA O and MERKLEY GP (2009) Transitional flow between orifice and nonorifice regimes at a rectangular sluice gate. J. Irrig. Drainage Eng. 135 (3) 382-387. https://doi.org/10.1061/(asce)ir.1943-4774.0000071 [ Links ]
ALTALIB AN, MOHAMMED AY and HAYAWI HA (2019) Hydraulic jump and energy dissipation downstream stepped weir. Flow Meas. Instrum. 69 (January) 101616. https://doi.org/10.1016/j.flowmeasinst.2019.101616 [ Links ]
AYDIN MC (2016) Investigation of a sill effect on rectangular side-weir flow by using CFD. J. Irrig. Drainage Eng. 142 (2) 1-8. https://doi.org/10.1061/(asce)ir.1943-4774.0000957 [ Links ]
AYDIN MC and ISIK E (2015) Using CFD in hydraulic structures. Int. J. Sci. Technol. Res. 1 (5) 107-15. URL: www.iiste.org [ Links ]
AYDIN MC and ULU AE (2017) Numerical modelling of sluice gates with different sill types under submerged flow conditions. Bitlis Eren Univ. J. Sci. Technol. 7 (1) 1-1. https://doi.org/10.17678/beuscitech.310157 [ Links ]
AYDIN MC, AYTEMUR HS and ULU AE (2022) Experimental and numerical investigation on hydraulic performance of slit-check dams in subcritical flow condition. Water Resour. Manage. 36 (5) 1693-1710. https://doi.org/10.1007/s11269-022-03103-6 [ Links ]
AYDOGDU M, GUL E and DURSUN OF (2022) Experimentally verified numerical investigation of the sill hydraulics for abruptly expanding stilling basin. Arab. J. Sci. Eng. https://doi.org/10.1007/s13369-022-07089-6 [ Links ]
BABAALI H, SHAMSAI A and VOSOUGHIFAR H (2015) Computational modeling of the hydraulic jump in the stilling basin with convergence walls using CFD codes. Arab. J. Sci. Eng. 40 (2) 381-395. https://doi.org/10.1007/s13369-014-1466-z [ Links ]
BIJANKHAN M and KOUCHAKZADEH S (2015) The hydraulics of parallel sluice gates under low flow delivery condition. Flow Meas. Instrum. 41 140-148. https://doi.org/10.1016/j.flowmeasinst.2014.10.017 [ Links ]
BIJANKHAN M and KOUCHAKZADEH S (2015) Free hydraulic jump due to parallel jets. J. Irrig. Drainage Eng. 141 (2) 04014049. https://doi.org/10.1061/(asce)ir.1943-4774.0000797 [ Links ]
CELIK IB, GHIA U, ROACHE PJ, FREITAS CJ, COLEMAN H and RAAD PE (2008) Procedure for estimation and reporting of uncertainty due to discretization in CFD applications. J. Fluids Eng. 130 (7) 078001. https://doi.org/https://doi.org/10.1115/1.2960953 [ Links ]
CHOW VT (1959) Open-channel hydraulics. [ Links ]
DANESHFARAZ R, NOROUZI R, ABBASZADEH H and AZAMATHULLA HM (2022) Theoretical and experimental analysis of applicability of sill with different widths on the gate discharge coefficients. Water Supply 22 (10) 7767-7781. https://doi.org/10.2166/ws.2022.354 [ Links ]
DANESHFARAZ R, NOROUZI R, ABBASZADEH H, KURIQI A and DI FRANCESCO S (2022) Influence of sill on the hydraulic regime in sluice gates: an experimental and numerical analysis. Fluids 7 (7). https://doi.org/10.3390/fluids7070244 [ Links ]
FLOW SCIENCE (2019) FLOW-3D User Manual. Theory, Flow Science, Inc. [ Links ]
GUMUS V, SIMSEK O and KIRKGOZ MS (2013) Experimental and numerical modeling of submerged hydraulic jump downstream of a sluice gate. ÍMO Teknik Dergi (399) 6379-6397. [ Links ]
GUMUS V, SIMSEK O, SOYDAN NG, AKOZ MS and KIRKGOZ MS (2016) Numerical modeling of submerged hydraulic jump from a sluice gate. J. Irrig. Drainage Eng. 142 (1) 04015037. https://doi.org/10.1061/(asce)ir.1943-4774.0000948 [ Links ]
GUO YX, GUO XL, WANG Y Sen, WANG T, FU H and LI JZ (2021) Flow condition identification and discharge calibration for submerged radial gates. J. Hydraul. Res. 59 (4) 683-690. https://doi.org/10.1080/00221686.2020.1818305 [ Links ]
HABIBZADEH A, LOEWEN MR and RAJARATNAM N (2012) Performance of baffle blocks in submerged hydraulic jumps. J. Hydraul. Eng. 138 (10) 902-908. https://doi.org/10.1061/(asce)hy.1943-7900.0000587 [ Links ]
HABIBZADEH A, VATANKHAH AR and RAJARATNAM N (2011) Role of energy loss on discharge characteristics of sluice gates. J. Hydraul. Eng. 137 (9) 1079-1084. https://doi.org/10.1061/(asce)hy.1943-7900.0000406 [ Links ]
HABIBZADEH A, LOEWEN MR and RAJARATNAM N (2016) Turbulence measurements in submerged hydraulic jumps with baffle blocks. Can. J. Civ. Eng. 43 (6) 553-561. https://doi.org/10.1139/cjce-2015-0480 [ Links ]
HAGER WH (2013) Energy dissipators and hydraulic jump. [ Links ]
HIRT CW and NICOLS BD (1981) Volume of fluid (VOF) method for the dynamics of free boundaries. J. Comput. Phys. 39 (1) 201-225. https://doi.org/10.1016/0021-9991(81)90145-5 [ Links ]
KANG J-G (2017) An experimental study on the dissipation effect of a baffle downstream of a weir. Engineering 09 (11) 937-949. https://doi.org/10.4236/eng.2017.911056 [ Links ]
KAYA N (2007) Investigation of energy dissipation raito of two rows energy dissipation blocks in stilling basin. Dogu Anadolu Bölgesi Arafttrmalart 5 (2) 40-47. [ Links ]
KUMCU SY (2017) Investigation of flow over spillway modeling and comparison between experimental data and CFD analysis. KSCE J. Civ. Eng. 21 (3) 994-1003. https://doi.org/10.1007/s12205-016-1257-z [ Links ]
LIN CH, YEN JF and TSAI CT (2002) Influence of sluice gate contraction coefficient on distinguishing condition. J. Irrig. Drainage Eng. 128 (4) 249-252. https://doi.org/10.1061/(asce)0733-9437(2002)128:4(249) [ Links ]
PETERKA AJ (1978) Hydraulic Design of Stilling Basins and Energy Dissipators. Fourth Printing. A Water Resources Technical Publication, Denver. [ Links ]
PETERKA AJ (1984) Hydraulic Design of Stilling Basins and Energy Dissipators. Eighth Printing. A Water Resources Technical Publication, Denver. [ Links ]
RAJARATNAM N (1977) Free flow immediately below sluice gates. J. Hydraul. Div. 103 (4) 345-351. https://doi.org/https://doi.org/10.1061/JYCEAJ.0004729 [ Links ]
RAJARATNAM N and SUBRAMANYA K (1967a) Flow equation for the sluice gate. J. Irrig. Drainage Div. 96 (3) 167-186. https://doi.org/https://doi.org/10.1061/JRCEA4.0000503 [ Links ]
RAJARATNAM N and SUBRAMANYA K (1967b) Flow immediately below submerged sluice gate. J. Hydraul. Div. 93 (4) 57-77. https://doi.org/10.1061/JYCEAJ.0001667 [ Links ]
ROACHE PJ, GHIA KN and WHITE FM (1986) Editorial policy statement on control of numerical accuracy. J. Fluids Eng. 108 (1) 2-6. https://doi.org/https://doi.org/10.1115/1.3242537 [ Links ]
ROUSHANGAR K, HOMAYOUNFAR F and GHASEMPOUR R (2022) Uncertainty analysis regarding evaluating effective parameters on the hydraulic jump characteristics of different shape channels. Water Supply 22 (1) 44-59. https://doi.org/10.2166/ws.2021.289 [ Links ]
SAGHEBIAN SM (2019) Predicting the relative energy dissipation of hydraulic jump in rough and smooth bed compound channels using SVM. Water Sci. Technol. Water Supply 19 (4) 1110-1119. https://doi.org/10.2166/ws.2018.162 [ Links ]
SWAMEE PK (1992) Sluice gate discharge equations. J. Irrig. Drainage Eng. 118 (1) 56-60. https://doi.org/https://doi.org/10.1061/(ASCE)0733-9437(1992)118:1(56) [ Links ]
YALCIN EE, IKINCIOGULLARI E and KAYA N (2023) Comparison of turbulence methods for a stepped spillway using computational fluid dynamics. Iran. J. Sci. Technol. Trans. Civ. Eng. 47 (6) 3895-3911. https://doi.org/10.1007/s40996-023-01127-5 [ Links ]
 Correspondence:
Erdinç Ikinciogullari
Email: erdincikinciogullari@gmail.com
Received: 12 February 2023
Accepted: 23 February 2024

