


Servicios Personalizados
Articulo
 Inglés (pdf)
 Articulo en XML
 Referencias del artículo
Indicadores

Links relacionados
-
 Citado por Google
 -
 Similares en Google
Compartir

 Permalink
Water SA
versión On-line ISSN 1816-7950
versión impresa ISSN 0378-4738
Water SA vol.50 no.1 Pretoria ene. 2024
http://dx.doi.org/10.17159/wsa/2024.v50.i1.4053
RESEARCH PAPER
Groundwater contaminant fluctuation at a landfill: a case study of the Coastal Park Landfill, Cape Town
M BaderoonI; K WinterII
IWaste Management, Department of Environmental Affairs and Development Planning, 3 Dorp Street, Cape Town 8000, South Africa
IIEnvironmental and Geographical Science Department, University of Cape Town, Rondebosch 7701, South Africa
ABSTRACT
Rainfall has been shown to be the main cause of elevated nutrient pollution in groundwater beneath landfills. However, groundwater monitoring is often based on predetermined schedules without considering rainfall patterns. This study examined how rainfall patterns affect fluctuations in groundwater quality at the Coastal Park landfill in Cape Town, South Africa, and the relevance of current groundwater sampling schedules. Boreholes upstream and downstream of two large waste cells, one lined and the other unlined, were monitored for 15 weeks during the onset of the rainy season to detect changes in the groundwater level, pH, conductivity, dissolved oxygen, ammonia, nitrate, and phosphate. Rainfall patterns strongly affected the groundwater parameters, with widely varying fluctuation patterns and lag times. Conductivity peaked downstream of the lined cell 10 weeks later than at the unlined cell, with widely different fluctuation patterns (R2 = 0.36). Ammonia peaked downstream of both the unlined and lined cells well before the early rains, with very similar fluctuation patterns (R2 = 0.97), although it peaked 6 times higher in the unlined cell. Nitrate peaked at Weeks 2 to 4 downstream of the unlined and the lined cell, with a weak correlation (R2 = 0.56). A shorter nitrate peak and a net decrease throughout the rainy season were observed downstream of the lined cell. Phosphate showed a brief, multi-fold increase at Week 3 downstream of both the unlined and lined cells, displaying pH-induced mobilisation and a very strong correlation (R2 = 0.99) between these locations. Lag times and fluctuation patterns varied depending on the presence of liners, and rainfall patterns. Therefore, the low frequency sampling required by many South African landfill waste management permits and licences cannot identify pollutant peak concentrations or describe their trends, and high frequency sampling should be considered.
Keywords: landfill groundwater, sampling schedules, groundwater pollution lag
INTRODUCTION
Nutrient enrichment in groundwater is often caused by leachate from landfills (Przydatek and Kanownik, 2019; Han et al., 2016; Aziz et al., 2013). Monitoring variations in groundwater nutrient concentrations from dedicated monitoring boreholes downstream of the pollution plume is a well-established technique for evaluating the effectiveness of leachate barriers in preventing groundwater pollution beneath landfills. To identify the best sampling schedules for detecting elevated levels of pollution during the rainfall season at a particular operational landfill site, this study aimed to assess the effectiveness of current monitoring schedules in South Africa by examining variations in groundwater pollution.
Groundwater sampling schedules at landfills in South Africa are based on 'Minimum Requirements' (DEADP, 2018; DWAF, 1998). These minimum requirements include pre-scheduled groundwater monitoring at predetermined times, largely for practical planning and management reasons; however, they neglect to account for varying rainfall patterns that affect groundwater fluxes, nutrient retention rates, and leachate mobility.
Several international standards have approached groundwater sampling scheduling using the results of earlier detection monitoring to direct the management of ongoing monitoring activities (NSW EPA, 2016; European Parliament, 2011; Irish EPA, 2003; DWAF, 1998). Some international regulations suggest that the frequency of compliance monitoring should be site specific, taking into consideration the hydrogeology of the site and the landfill design, and periodically re-analysing the selected baseline monitoring parameters (Irish EPA, 2003). Similar methods are also used to meet international standards, but they usually exclude scheduling requirements that account for rainfall (NSW EPA, 2016; European Parliament, 2011; Yenigül, 2006; Irish EPA, 2003; State of Vermont Agency of Natural Resources, 1999; Blight et al., 1995). Because of this, international rules generally follow a similar approach and do not base their scheduling requirements on the amount of rainfall that has recently fallen (NSW EPA, 2016; European Parliament, 2011; Yenigül, 2006; Irish EPA, 2003; State of Vermont Agency of Natural Resources, 1999; Blight et al., 1995).
It is commonly accepted that rainfall is the primary cause of leachate, and numerous researchers have examined how rainfall affects the volume, concentration, and mobility of leachate (Engelbrecht and Murray, 2017; Bhatt et al., 2017; Aziz et al., 2013; Tränkler et al., 2005; Wreford, et al., 1999; Blight et al., 1995). Rainfall is the means through which water enters landfills to accelerate the amount and dilution of landfill leachate while causing the decomposition of landfill materials (Aziz et al., 2013).
A model developed by Bhatt et al. (2017) that could predict leachate quality parameters based on the waste composition of a landfill, ambient temperature, and rainfall rate discovered that lower temperatures prolonged the time for microbial activities, while higher rainfall diluted the leachate owing to a washout effect, and that leachate generation was delayed when the moisture content was low. Therefore, time, temperature and annual rainfall were identified as the most important variables in models for the resultant leachate production (Bhatt et al., 2017).
Research on leachate formation and composition under monsoon conditions, in which lysimeters are employed to model landfills and open cells, has demonstrated the effects of rainfall on leachate production. The maximum leachate generation was found during the rainy season, according to results from two subsequent dry and wet seasons; however, leachate flow was not observed during the dry periods. Leachates accounted for >60% of the precipitation volume. The study concluded that the highest degradation within the waste body occurred during the rainy season and that degradation during the dry season partially ceased owing to a lack of moisture (Tränkler et al., 2005).
The link between rainfall and leachate production is supported by a study by Blight et al. (1999) on the effects of climate and waste composition on leachate and gas quality in South Africa. Evidence of leachate contamination was found at pits that were excavated at the toe of 6 unlined landfills at depths of 2 to 2.5 m, and also near these landfills. The results support previous studies in concluding that the climatic water balance provisions of the 'Minimum Requirements' were a realistic way to predict the likelihood of a landfill being able to produce leachate (Blight et al., 1999).
At the Vancouver Landfill Site in Burns Bog, Wreford et al. (1999) investigated the effects of moisture input from water infiltration on landfill gas generation and leachate properties. Three-week intervals in the sampling regime were used in the study. A comparison between total daily precipitation and daily leachate outflow indicated that peak rainfall was immediately followed by the rapid movement of precipitation through the fill and leachate production from the site (Wreford, et al., 1999).
Engelbrecht and Murray (2017) discovered that over the course of 3 years of monitoring at the Coastal Park landfill, higher concentrations of dissolved minerals and metals were observed during the dry summer months (December to March) and lower concentrations occurred during the wet winter months (May to August). This might be due to a seasonal shift, whereby rain that falls during the winter months dilutes the quantities of dissolved minerals and metals in leachate (Engelbrecht and Murray, 2017).
In a study by Bendz et al. (1997) it was observed that a significant portion of water was retained in the waste owing to surface tension until a large and relatively sudden release ofleachate occurred after a certain volume of rainfall infiltrated the landfill. This finding was based on their study of the accumulation of water and generation of leachate in a relatively new landfill. The amount of rainfall that was converted into leachate rose from zero to roughly half during the first 6.5 years of utilising the landfill, although they noticed a 1- to 2-month time lag in the net water input-leachate discharge. The authors claimed that because each accumulation period had a different storage-leachate flux relationship depending on the storage and the increase or decrease in leachate flux, it was difficult to construct a storage-leachate flux relationship for a landfill during the accumulation phase (Bendz et al., 1997). This finding has significant ramifications for the current study because it demonstrates how challenging it may be to anticipate the ratio of net water input to leachate discharge.
Johnson et al. (1998) analysed the residence time of water in a landfill and measured the flow paths through the landfill over a period of 22 months, using rainfall, landfill discharge, leachate electrical conductivity, and tracer experiment data. Their results showed that in winter (dry season), 90 to 100% of rainfall was responsible for landfill discharge, whereas in summer (wet season) this percentage decreased to between 9 and 40%, depending on the intensity ofthe rain event (Johnson et al., 1998). In an investigation of the probable time delay from precipitation to infiltration and discharge to groundwater at the Dyer Boulevard Landfill, rainfall levels were plotted against chloride concentration in leachate samples for 5, 7, 10, 15, 20, 25, 30 and 120 days. During this analysis, 30 days was found to be the best fit for the likely lag time for rainwater to infiltrate through the waste (Statom et al., 2004).
An added complication that makes it difficult to predict the rate of leachate flow is that fluids have preferential pathways through a landfill which will also affect the time lag between rainfall and its effects on leachate. Moreover, preferential pathways vary with rainfall. In the study by Johnson et al. (1998), it was found that between 20 and 80% of rainwater passed directly through the landfill in the summer months (higher rainfall) but yielded less than 10% in winter. An increased rate of discharge resulted in a greater proportion of leachate being discharged, whereas a portion of the rainwater did not contact the waste material and thus played no role in the leaching of salts (Johnson et al., 1998). The following year, they demonstrated that leachate was diluted during rainfall events by the preferential flow of rainwater into the drainage discharge (Johnson et al., 1999). This dilution of leachate during rainfall events was also demonstrated by Engelbrecht and Murray (2017) and Aziz et al. (2013). Therefore, there is evidence and agreement regarding the effects of rainfall on leachate composition, volume, concentration, movement and a time delay or lag for this influence to take effect in landfills.
The link between rainfall and leachate has thus far been established and it remains necessary to link the effects of rainfall to groundwater pollution. In addition to identifying rainfall as the means by which rainfall infiltrates the landfill system and causes an increase in leachate, Aziz et al (2013) stated that contaminant transport at a landfill includes the passing of contaminants through the liner to the groundwater (Aziz et al., 2013).
In line with the above observations of the effects of rainfall patterns on groundwater nutrient pollution, the U.S. Environmental Protection Agency (USEPA) regulations, which are widely recognised and applied in many countries, require that all new landfills and the extension of landfills provide a leachate collection system designed to quickly remove leachate without allowing leachate depth over the liner system to exceed 30.5 cm (Yenigül, 2006). This limitation of leachate depth makes sense because an increase in the volume of leachate due to higher rainfall is likely to increase the hydraulic head exerted by the leachate on the bottom of the waste cell and liner system, thereby increasing the leakage. In addition to the increase in pressure caused by deep leachate, an increase in the volume of leachate above a landfill liner system is likely to result in a larger surface area of contact between the leachate and liner, which could be defective or damaged, thereby increasing the likelihood and rate of leakage.
The Hydrologic Evaluation of Landfill Performance (HELP) model was used to estimate the leachate leakage at the Ano Liosia landfill site in Greece. The model takes multiple conditions into account and facilitates rapid estimation of the amounts of runoff, evapotranspiration, drainage, leachate collection and liner leakage that may be expected (Schroeder et al., 1994). Using this model and plotting the results from the previous 23 years of data collection, a correlation between precipitation and leakage from a landfill base was demonstrated by Fatta et al. (1999). They estimated a strong relationship between precipitation and leakage at the Ano Liosia landfill site. The average annual leakage from the landfill base in that study was estimated to be 42.76% of the average annual total precipitation. It became obvious through their study that leakage from the landfill base was influenced by the cumulative annual rainfall (Fatta et al., 1999). It must be noted that the rainfall and leakage results of the study conducted by Fatta et al. (1999) contain annual information and thus do not describe the relationship between prevailing intra-seasonal rainfall patterns and groundwater nutrient pollution trends. However, there is a relationship between cumulative annual rainfall and base leakage at landfills, confirming that higher rainfall causes higher volumes of leakage (Fatta et al., 1999).
METHODS
The hypothesis that a single sampling event is merely a snapshot in time, and that the prevailing intra-seasonal rainfall must be considered when scheduling a single or a limited number of groundwater sampling events, or interpreting the results thereof, will be supported if the results of frequent groundwater sampling show different relationships between intra-seasonal rainfall patterns and each groundwater pollutant.
A landfill site was chosen for this investigation based on the availability of infrastructure suitable for measuring changes in groundwater quality. The site has a network of dedicated monitoring boreholes which support the operations of the Coastal Park landfill. The system infrastructure consisted of boreholes downstream of the leachate pond, lined and unlined cells, and boreholes further downstream to investigate the influence of geology, hydraulic conductivity and distance on the pollution plume. A high-resolution digital rainfall station, along with other weather-related metrics that collect data at 30-min intervals, was also available at the site.
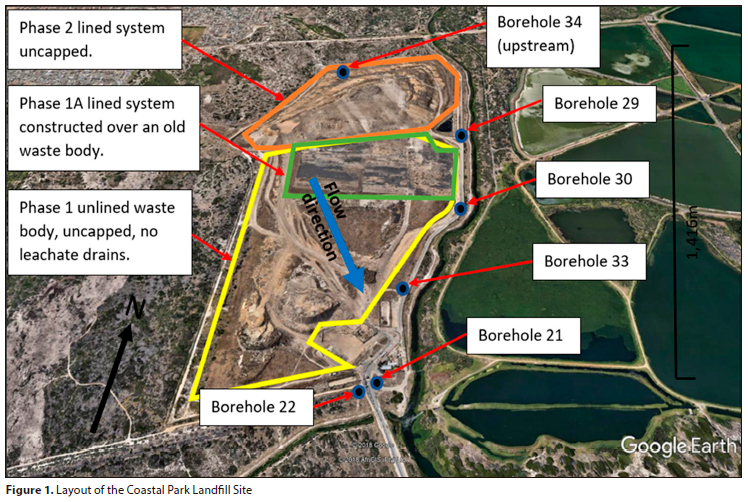
The Coastal Park Landfill study site began operating as a landfill site in 1985. By 2012, it had already received approximately 450 000 tons of waste per year (City of Cape Town, 2012). The site is located approximately 20 km south of the centre of Cape Town and is adjacent to the Cape Flats Wastewater Treatment Works. The site (Fig. 1) covers an area of 0.8 km2 and is an active landfill that is used for the disposal of general and non-hazardous waste (Blake et al., 2016). The landfill is underlain by unconsolidated sand with pebbles and shells of the Witzand Formation which overlies the older Springfontyn Formation consisting of light grey to pale-red sandy soils. The groundwater level at the location is mapped as about 3.4 m amsl in the north-west and grades downwards to about 0.5 m amsl in the south-east, as it approaches the sea (Engelbrecht and Murray, 2017). A uniform aquifer thickness underlies the entire extent of the landfill site, with a saturated thickness of 20 m. The southwestern edge is composed of saturated sands approximately 20-25 m thick (Blake et al., 2016). This means that there are no geological structures that may significantly affect the linear flow of groundwater close to the waste cells. However, subsurface geological conditions may be affected by compaction of the top ground levels caused by ongoing heavy machinery activity and construction. The Coastal Park landfill has 27 boreholes which are used for groundwater sampling. Two reports were commissioned by the City of Cape Town to assess the Coastal Park landfill groundwater monitoring infrastructure and groundwater. These reports provided valuable insight regarding the borehole network, groundwater gradient and the interpretation of borehole monitoring results obtained from the recent sampling history at the site (Engelbrecht and Murray, 2017).
The site consisted of unlined cells (Phase 1) and lined (Phase 2). A lined cell (Phase 1A) overlays the northern side of unlined Phase 1 (Fig. 1) (Engelbrecht and Murray, 2017).
Rainfall data (De Bruyn, 2019) were acquired from an on-site weather station between April and August 2019, corresponding to the pre-rainfall and winter rainfall seasons. Concurrent groundwater sampling was performed at the selected boreholes.
The procedures for sampling:
• Slow purging, by repeated bailing, was used to clear boreholes of any possible debris and stagnant water. Thus, low-volume, gradual purging was used to carry out weekly sampling. Approximately 3 L was removed from each borehole, while also mixing the water column by dropping the bailer a few meters into the column and retrieving it repeatedly, before collecting the sample. The glass containers used for sampling were rinsed before being filled with 200 mL of sample water.
• After collection, the containers were sealed with metal caps. An air gap of approximately 0.5 to 1 cm was left at the top of each collected sample.
• Within an hour of collection, the samples were placed in a small cooler box with ice packs and kept overnight before the tests were conducted the following day.
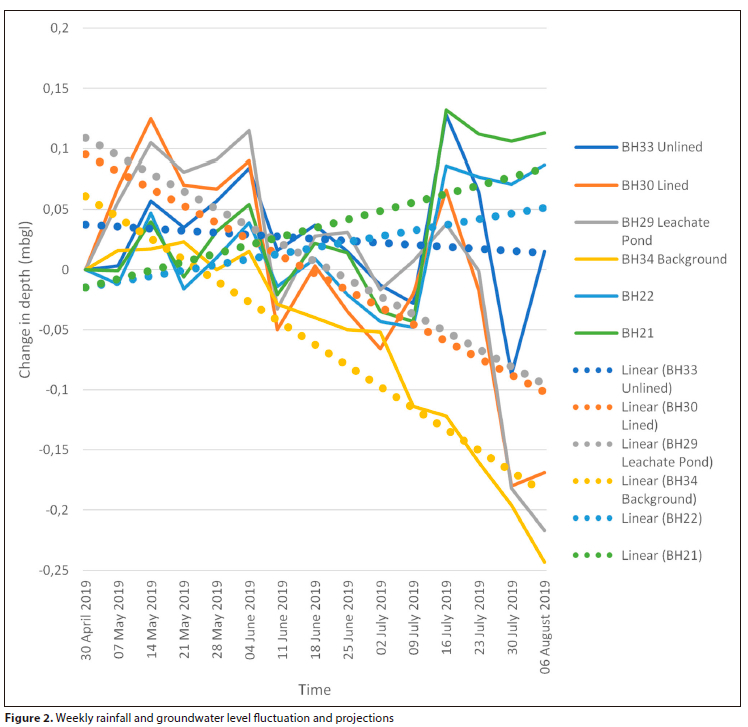
• Borehole water levels were used to observe possible correlations between rainfall and groundwater levels, and to verify groundwater flow direction. Before collecting samples at each borehole, the depth from the borehole neck to the top of the groundwater table was measured with a weighted plumb line which was allowed to drop until it reached the water level. The level was measured during the first week (30 April 2019) and used as a reference during the dry season and subsequent weeks (until 6 August 2019). Levels were recorded in meters above or below the reference datum point (Fig. 2).
A linear projection of the groundwater depth was created by plotting the changes in groundwater depth versus time. Trend lines were overlaid onto the graphs for each borehole to show movement over months of increased upstream groundwater levels associated with rising precipitation. Upstream depths are generally expected to decrease (increase in the water table) faster during periods of high precipitation. A strong positive gradient was associated with the most downstream location. Engelbrecht and Murray (2017) mapped the groundwater level at Coastal Park revealing a gradient of 3.4 m amsl in the north-west to 0.5 m amsl in the south-east, as it approached the sea (Engelbrecht and Murray, 2017). This fitted well with what was observed as Borehole 34, the most upstream location according to their study, displayed the most negative gradient, whereas Borehole 21, the most downstream location, displayed the most positive gradient.
RESULTS AND DISCUSSION
The results for each parameter were combined with a discussion of the results. Data, graphs and statistical analyses are available in the MSc. (EGS) dissertation (Baderoon, 2021).
Rainfall data
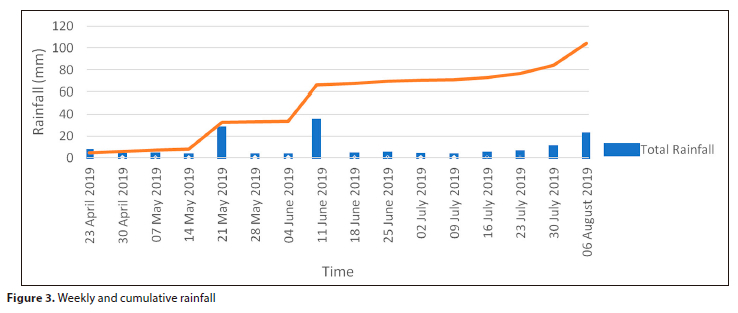
Local rainfall data (De Bruyn, 2019) which were captured at 30-min intervals were aggregated to a weekly rainfall record in mm (Fig. 3).
Conductivity (EC)
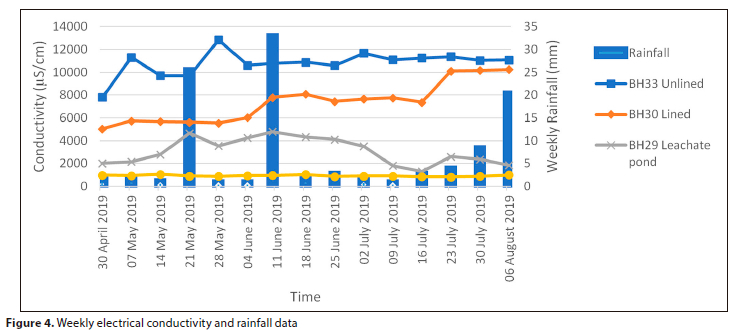
The EC was measured in the laboratory using a handheld conductivity meter after the collected samples were stored on ice for approximately 24 h. The samples were diluted to concentrations within the measurement range of the instrument. During the monitoring period, the EC downstream of the waste cells (Fig. 4) responded to the rainfall patterns and was significantly influenced by whether the waste cells were lined.
After a rainfall event, the EC downstream of the leachate pond (Borehole 29) recovered most quickly, and by the end of the monitoring period the EC reached the levels that were observed at the start of the monitoring period. During several weeks of minimal rainfall, the EC downstream of the lined waste cell (Borehole 30) recovered more slowly than that downstream of the unlined cell (Borehole 33), and only reached peak levels after the monitoring period. Leachate dilution above the liner may be the cause of the lower conductivity in this region, whereas there was an apparent steady, retarded leakage through the waste cell liner. It is possible that this pattern confirms the observation of Johnson et. al. (1999) that leachate is diluted by the preferential flow of precipitation in the discharge during rainfall events from a lined landfill cell before leaching into the groundwater through the landfill cell liner (Johnson et al., 1999).
Throughout the monitoring period, the groundwater EC downstream of the unlined waste cell (Borehole 33) remained significantly higher than the background conductivity and higher than the conductivity downstream of the lined waste cell. Given that there was no liner to account for the leachate dilution, as observed by Johnson et al. (1999), this trend confirmed expectations.
The most significant EC findings that apply to this study are that the EC responded to various rainfall events throughout the course of the monitoring period and was strongly influenced by whether the cells were lined. Although the EC downstream of the lined cell began the season with lower values, it progressively increased to a magnitude similar to that of the unlined cell. These data support the notion that intra-seasonal rainfall must be considered when planning groundwater monitoring near landfills.
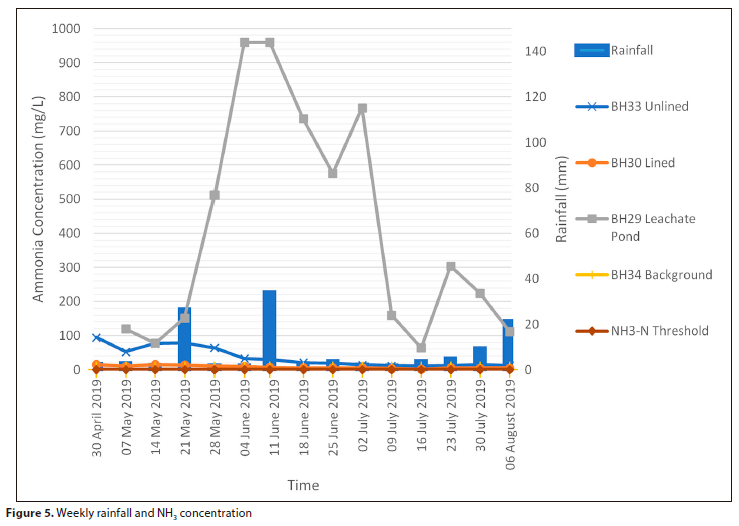
Ammonia
NH3 was measured in the laboratory using the HACH ammonia (NH3-N) photo-spectrometry method. NH3 responded to rainfall patterns with significant changes throughout the monitoring period (Fig. 5).
The highest NH3 concentrations were observed in Borehole 29, which was located downstream of the leachate pond. It had the highest record of all the boreholes and a peak concentration of 960 mg/L. The NH3 content closely followed rainfall patterns, rising within two weeks of significant rain and recovering swiftly thereafter. This trend in NH3 concentrations may have been caused by the apparent continual leakage from the leachate pond, which resulted in greater NH3 concentrations than at other borehole locations, and which formed a plume that was dislodged by enhanced groundwater movement after intervals of severe precipitation.
The NH3 concentrations were much lower in Boreholes 30 (lined) and 33 (unlined) than those found in Borehole 29 (leachate pond). Borehole 33 (unlined) had NH3 concentration trends that were almost equivalent to those at Borehole 30 in that its concentrations started at a pre-rainfall seasonal high and decreased slowly as the rainfall season progressed. Despite the aging of the unlined landfill cell, the NH3 concentrations in Borehole 33 (unlined) peaked at concentrations 10 times that of Borehole 30 (lined), most likely because of the increased leakage at the unlined waste cells.
The primary pattern in NH3 concentrations at Boreholes 30 (lined) and 33 (unlined) was that the initial and highest concentrations occurred in the first 2 weeks after the first significant rainfall event, despite subsequent high-rainfall weeks. This demonstrates once more how intra-seasonal rainfall must be considered when formulating groundwater sampling plans, to avoid missing this important change in NH3 concentration. The two sites showed comparable NH3 attenuation trends. The aerobic effects of the increased groundwater movement, and consequently similar gradual reductions in NH3 concentrations at both locations throughout the rainfall season, may have contributed to the similarity in the NH3 trends observed downstream of the lined and unlined cells. Statistical analysis indicated a strong positive association between the variations at Boreholes 30 (lined) and 33 (unlined) of both NH3 (R2 = 0.97) and DO (R2 = 0.94), supporting the contention of similar aerobic effects at these sites. However, the NH3 decline at Borehole 29 (leachate pond) was distinct, where elevated concentrations of NH3 may have been extremely hazardous to microorganisms that play a role in breakdown and attrition processes.
Fatta et al. (1999) observed that high concentrations of NH3 are very toxic to the microorganisms that are responsible for the anaerobic processes. Consequently, the high concentration of NH3 inhibits their growth and activity (Fatta et al., 1999). Thus, Borehole 29 (leachate pond) did not exhibit the same abrupt decline in NH3 as observed at Boreholes 30 and 33, but rather initially displayed a 5-fold increase following the first significant rainfall event in Week 4.
The fact that there is a low correlation in NH3 variation between the lined (R2 = -0.07) and unlined (R2 = -0.18) waste cells and Borehole 29 (leachate pond) seems to support the hypothesis that high concentrations of NH3 at this location are toxic and inhibit bacterial NH3 reduction, especially since they showed high correlations with DO variation (R2 = 0.83 and R2 = 0.82, respectively). This would imply that, although DO ought to have been sufficient to encourage the conversion of NH3 to NO3 at Borehole 29, it could not, or at least could not be as effective as in Boreholes 30 and 33 due to the toxicity of the significantly higher quantity of NH3 at Borehole 29.
Further support for the toxicity theory at Borehole 29 was obtained by determining the correlation between NH3 and NO3 as NO3 is the result of the oxidation of NH3 or nitrite (Canfield et al., 2010). The correlation between NH3 trends (Fig. 5) and NO3 trends (Fig. 6) was R2 = 0.11, R2 = 0.44, and R2 = 0.70 for Boreholes 29 (leachate), 33 (unlined), and 30 (lined), respectively. Therefore, Borehole 30 (lined), where NH3 content was consistently lowest, showed the strongest correlations between NH3 and NO3 trends. This suggests that less harmful levels of NH3 at Borehole 30 (lined) allowed more efficient bacterial NH3 reduction.
The most significant finding regarding NH3, which is similar to that for EC, is that NH3 concentrations were influenced by rainfall patterns throughout the monitoring period. The amount of NH3 present varied greatly depending on when the groundwater samples were collected. The effects of NH3 toxicity and whether the cells were lined are two other factors that appear to have a substantial impact on NH3 concentrations, in addition to the effects of rainfall patterns.
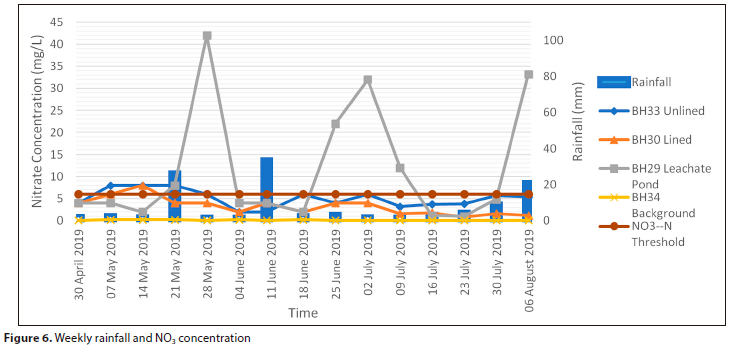
Nitrate
NO3 was measured in the laboratory using the HACH nitrate (NO3-N) photospectrometry method after the collected samples were stored on ice for approximately 24 h. The oxidation of NH3 (ammonia) and NO2 (nitrites) produces NO3 (nitrates). During subsequent denitrification, NO3 reduction is connected to the anaerobic oxidation of organic carbon, which frequently results in N2 gas (Canfield et al., 2010). Nitrates in water are produced because of the oxidation of plant and animal waste as well as human and animal faeces. Ranges of NO3 concentration should be between 0 and 6.0 mg/L N (DWAF, 1996).
Boreholes 29 (leachate pond), 30 (lined), and 33 (unlined) showed NO3 concentrations above background levels, as did all nearby downstream sampling locations. The largest increase in NO3 was observed at Borehole 29 (the leachate pond), which occurred 1 week after the first significant rainfall event. Although the overall NO3 levels increased after the subsequent high-rainfall weeks, these subsequent increases were slow.
Despite the early low rainfall compared to rainfall that fell later in the season, NO3 concentrations at Borehole 30 (lined) doubled, rising from 4 mg/L to a maximum of 8 mg/L within the first 3 weeks of the monitoring period, but declined thereafter throughout the remainder of the monitoring period. NO3 concentrations at Borehole 33 (unlined) showed a similar pattern to those at Borehole 30 (lined), increasing shortly after the early rainfall, but remaining at peak concentrations for 2 weeks longer than at Borehole 30 (lined) before decreasing shortly after.
This early increase in concentrations at both Borehole 33 (unlined) and Borehole 30 (lined), which did not occur again, suggests that the initial rise in response to the first rainfall event of the rainy season is crucial for determining NO3 concentration patterns. The observations of decreasing NO3 concentration trends are consistent with those made by Fatta et al. (1999), suggesting that increased rainfall had the effect of increased groundwater flow, which in turn increased NO3 generation by aerobic bacterial activity. The liner may have slowed the NH3 and NO3 movement sufficiently to allow the NO3 attenuation rate to exceed the rate at which it was replenished.
Thus, a dual effect was apparent. Due to the conversion of NH3 to NO3, NH3 leakage patterns may also have had an impact on NO3 trends. Once the rainfall season continued, NH3 from the lined waste cell appeared to decrease (Fig. 5), resulting in a decrease in the bacterial conversion of NH3 to NO3. However, it appeared that the groundwater samples connected to the unlined waste cells received enough NH3 from leaks to support increased NO3 generation as the rainy season proceeded. Consequently, NO3 concentration patterns were more stable because unlined waste cells probably sustained sufficient leakage throughout the wet season to maintain NO3 synthesis through aerobic bacterial activities, which increased during heavier rainfall.
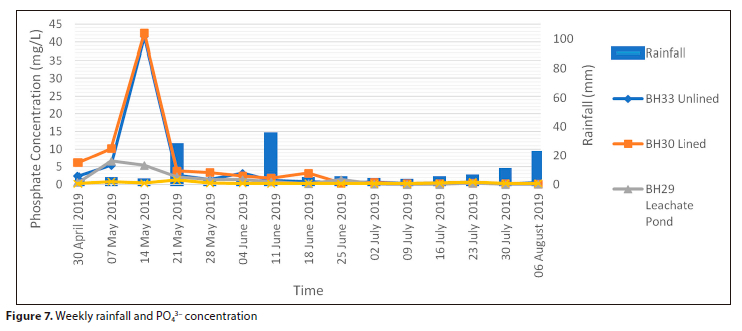
Orthophosphate
PO43- was measured in the laboratory using the HACH phosphate (PO43-) ascorbic acid spectrophotometry method after the collected samples were stored on ice for approximately 24 h. All excessively concentrated samples were diluted until they were in quantities that the equipment could detect.
The concentration of PO43- is a useful measure of landfill pollution as it is known that high orthophosphate (PO43-) concentrations can be caused by the organic load of refuse which contains phosphorus. Organic materials (mainly phospholipids and phosphoproteins) increase PO43- concentrations during biodegradation by releasing phosphorus (Fatta et al., 1999). The PO43- concentrations were observed to be greater than the background levels in all downstream boreholes for a short period at least once throughout the monitoring period (Fig. 7). Even though substantially more rain occurred later in the study period, PO43- concentrations downstream of the leachate pond, lined waste cell, and unlined waste cell never increased to concentrations as high as they were soon after the early relatively high rainfall. Therefore, the window of opportunity to detect PO43- leaching into groundwater appears to be very short.
Although their downstream distances from the waste cells differed, PO43- at the lined waste cell, unlined waste cell, and leachate pond all peaked almost simultaneously (Fig. 7), and PO43-remained much lower at the leachate pond than downstream of the lined and unlined cells despite later increases in NH3 and NO3 concentrations at the leachate pond (Figs 5, 6 and 7). This difference in variation implies that these pollutants are subjected to different release and attenuation mechanisms.
The apparent similar lag time for PO43- downstream of the leachate pond, lined cell and unlined cell, combined with the much lower PO43- at the leachate pond, suggest that there is a mechanism that causes the retention and/or release of PO43- that is less dependent on distance or the presence of a liner. This behaviour might be caused by the retention and/or release of PO43- under specific chemical conditions, and it would seem to be consistent with the findings of other investigations.
According to previous studies, pH influences how certain nutrients travel through aquifers and substrates. Despite decades of interaction with sediments, Kent et al. (2007) observed a similar type of mobilisation in a study that injected low pH groundwater into an aquifer, causing Zn and PO43- to be rapidly desorbed with the resulting changing chemical conditions (Kent et al., 2007). Low levels of dissolved P and Zn were present in the injected groundwater, which also had a pH of 4.5. Along with considerable increases in dissolved P over pre-injection concentrations, a 20fold increase in dissolved Zn concentrations above pre-injection levels was observed downgradient from the injection. Despite years of interaction with sediments, Zn and P are quickly desorbed in response to shifting chemical conditions (Kent et al., 2007).
The pathway of pollutants and pollution to groundwater involves a lengthy storage period in the leachate pond before release, thus providing more time for PO43- fixing before being released to groundwater and probably leading to significantly lower PO43-concentrations downstream of the leachate pond compared to the lined and unlined cells. Because the groundwater downstream of Borehole 29 (leachate pond) was continually dark grey, even after purging, it appeared likely that this borehole was capturing this leakage from the leachate pond. It would be logical to assume that the chemical conditions within and downstream of the leaky leachate pond would likely be significantly different from those downstream of the waste cells, including the pH (presumably higher in the leachate pond (JG Afrika, 2019)) that favours PO43-retention.
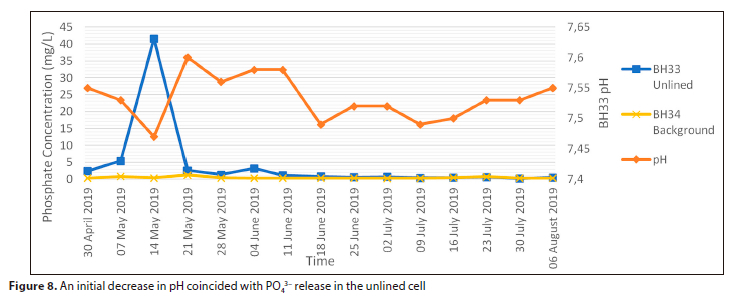
The research mentioned above provided evidence in favour of a selective delay or mobilisation mechanism for PO43- transit in groundwater (and perhaps in the leachate pond). The pH reduction caused by the advent of the first seasonal rain may be the cause of the unusually rapid release of large amounts of PO43-. Figure 8 shows that the initial sharp rise in groundwater PO43- seen downstream of the unlined waste cell coincided with the initial most discernible fall in aquifer pH measured in the groundwater samples from that location. Groundwater samples from downstream of the lined cell and the leachate pond showed similar sharp increases in groundwater PO43- which coincided with the initial most discernible fall in aquifer pH.
Analysis
A non-parametric test was used to analyse the data because of irregular or non-normal distributions. Statistical correlation indicated the level of similarity between the trends at two boreholes, while the Wilcoxon signed-rank test was used to establish whether there was sufficient evidence to suggest that there was a difference between trends at the two boreholes.
There was a strong correlation between NH3, PO43- and DO downstream of the lined and unlined cells (R2 = 0.97, R2 = 0.99 and R2 = 0.94, respectively), while the variation in NO3 showed a weaker positive correlation (R2 = 0.56).
The Wilcoxon signed-rank test, using critical values of 25, determined that there was sufficient evidence to suggest that there was a difference between NO3 trends downstream of the lined and unlined cells, with a test statistic equal to 7 (or less than critical value), but determined that there was enough evidence to show that there was no difference in NH3 and PO43- trends between them, with test statistics equal to 105 and 36, respectively (or more than critical value). In other words, the presence of a liner affected NO3 trends but did not substantially affect NH3 and PO43- trends.
Figure 9 displays the ratios of each nutrient at Boreholes 30 and 33, with error bars used to analyse the drifting ratios throughout the course of the monitoring period.
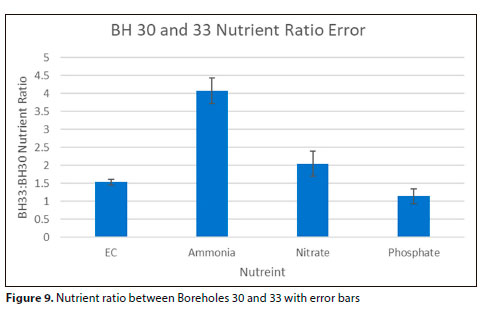
Although the position downstream of the leachate pond showed a significantly lower PO43- peak, it showed a reasonably higher than expected positive statistical association in PO43- fluctuation with locations downstream of the lined and unlined waste cells compared to NO3 and NH3. The coefficient of determination (R2) for the correlation between downstream PO43- in the leachate pond and the lined cell was 0.72, between the leachate pond and unlined cell was 0.66.
NO3 and NH3 did not show a correlation similar to that observed for PO43-, suggesting a significantly different attenuation mechanism for PO43-. There was no statistical relationship in downstream NO3 variation between the leachate pond and the lined and unlined cell (R2 = -0.02 and R2 = 0.14, respectively). There was no statistical relationship in downstream NH3 variation between the leachate pond and the lined and unlined cells (R2 = -0.07 and R2 = -0.18, respectively). The fact that NO3 and NH3 are not susceptible to the same fixing mechanism as PO43-, as well as the fact that PO43- has a different attenuation mechanism, may explain this observation. This observation of different attenuations and fluctuation patterns suggests that no single monitoring occasion can be used to deduce the state of each of these nutrients.
There was no statistical association between the rainfall pattern and pollutant variation. Although the lack of a statistically significant correlation between rainfall patterns and groundwater pollutant variation does not prove or disprove a cause-and-effect relationship between rainfall patterns and groundwater pollutant variation, it does indicate the difficulty of creating a groundwater monitoring schedule that considers rainfall patterns by requiring that sampling occasions simply occur after high rainfall days.
CONCLUSION
This study aimed to determine the fluxes in groundwater quality at the Coastal Park landfill in Cape Town, South Africa, and to analyse how groundwater quality changes with local rainfall. The results show that the fluctuation in groundwater contamination at the Coastal Park landfill is strongly related to rainfall fluctuation. However, this relationship is complex as it is influenced by other mechanisms.
Groundwater levels showed that hydraulic gradients between boreholes were constantly shifting in response to rainfall patterns, although the direction of the gradient remained largely the same, from north-west, at the chosen landfill. This means that groundwater movement was continually adjusting to rainfall patterns and cumulative rainfall, which in turn could be expected to have affected fluctuations in pollutant transport toward the sampling sites downstream.
The chosen groundwater indicators, which included NH3, NO3, PO43-, conductivity and pH, responded to rainfall with clearly distinct trends when compared to each other, and peaked at different times, rather than all rising, falling, or peaking at the same time relative to one another.
The presence of liners affected these fluctuations. Conductivity fluctuations downstream of lined and unlined cells were very different, peaking 10 weeks later downstream of the lined cell, with a very weak correlation in fluctuation between the two locations (R2 = 0.36). This indicates that there were different fluctuation patterns and peak times for the conductivity downstream of the lined and unlined cells. The lined and unlined downstream monitoring boreholes showed quite different trends for NO3, but very similar trends for NH3 and PO43-. NO3 peaked at a similar time downstream of the unlined cell and the lined cell, although there was a widely different NO3 fluctuation pattern between these locations. NO3 also showed a net decrease throughout the rainy season downstream of the lined cell, ending the rainy season at its lowest concentration, while NO3 was higher downstream of the unlined cell at the end of the monitoring period. Statistical analysis indicated a positive association between NH3 variation downstream of lined and unlined cells (R2 = 0.97), with similar but not synchronous times of peak concentrations.
Changes in groundwater pH had an impact on PO43- mobility, causing it to increase to maximum concentrations for a short time when the pH was measured below a specific threshold for the first time during the rainy season.
The absence of a statistical association between the rainfall pattern and pollutant variation in any of the downstream boreholes suggests a far more complex relationship than a straightforward direct or inversely proportional relationship between rainfall and pollutant variation.
Multiple pollutant patterns that are each affected differently by rainfall, sampling location and waste cell liner presence may require a different sampling methodology to that of a predetermined groundwater sampling schedule. The very low frequency groundwater sampling schedules contained in the South African and international regulations at the time of the study do not consider the different annual rainfall patterns and the different effects that rainfall patterns have on different pollutants. While very low frequency groundwater sampling schedules may be an accepted practice for determining whether a landfill is polluting groundwater, given the complexities of the variation in groundwater pollutants, this approach is likely to provide misleading information regarding pollutant trends and peaks.
Therefore, planning a groundwater monitoring programme must consider landfills in a dynamic setting. The same schedule for single or low frequency monitoring being applied each year will yield misleading results as annual cumulative rainfall and rainfall patterns are never the same for any 2 years and the effects of these rainfall patterns on the fluctuations of each pollutant are different. The unique trends, lags and peak concentrations of various pollutants will be missed using any single groundwater monitoring occasion. To enable a more accurate assessment of nutrient pollution at landfills, increased monitoring frequencies may be a better option, preferably spanning the rainy season, if possible.
The location of groundwater sampling points must be carefully considered as the study showed that, in agreement with the literature, location significantly affects groundwater pollutant concentration, trends and lag. Sampling boreholes placed closely downstream of waste cells and leachate ponds are subject to less lag, are more sensitive to groundwater changes and are less likely to be affected by geology than boreholes further downstream. Closely downstream boreholes also displayed more complex pollutant variation patterns than boreholes further downstream.
The conclusions arrived at during the current study suggest that the practice of annual or biannual groundwater monitoring at landfills, as conducted in South Africa at the time of this study, may yield misleading results. These low frequency monitoring events do not identify peak pollutant levels, nor do they describe pollutant trends. Although there is agreement that rainfall is the major driver of pollutant variation in groundwater at landfills, the difficulty in using rainfall results to predict pollutant fluctuation may necessitate higher frequency groundwater sampling schedules if groundwater monitoring regimes are to provide accurate, reliable, and descriptive groundwater pollutant information. High frequency groundwater sampling may, however, be expensive, and further studies, budgetary and technology decisions and legislative consideration may be necessary in this regard.
Similar studies need to be conducted at various landfills, with other pollutants of interest.
REFERENCES
AZIZ HA, ZAHARI MSM, BASHIR MJ and HUNG YT (2014) Chapter 13: Groundwater contamination at the landfill site. In: Handbook of Environment and Waste Management Volume 2: Land and Groundwater Pollution Control. World Scientific Publishing, Singapore. 781-817. https://doi.org/10.1142/9789814449175_0013 [ Links ]
BADEROON M (2021) Groundwater contamination at a landfill: a case study of Coastal Park Landfill. MSc thesis, University of Cape Town. [ Links ]
BENDZ D, SINGH VP and AKESSON M (1997) Accumulation of water and generation of leachate in a young landfill. J. Hydrol. 203 (1-4) 1-10. https://doi.org/10.1016/S0022-1694(97)00080-2 [ Links ]
BHATT AH, KARANJEKAR RV, ALTOUQI S, SATTLER ML, HOSSAIN MS and CHEN VP (2017) Estimating landfill leachate BOD and COD based on rainfall, ambient temperature, and waste composition: Exploration of a MARS statistical approach. Environ. Technol. Innov. 8 1-16. https://doi.org/10.1016/j.eti.2017.03.003 [ Links ]
BLAKE D, MOLZEN G, HARTNADY M, WISE E and WONNACOTT R (2016) Disposal facilities monitoring borehole infrastructure assessment Coastal Park Landfill Site. City of Cape Town Solid Waste, Pinelands. [ Links ]
BLIGHT GE, BALL UTM, BLIGHT JJ and VORSTER K (1995) Moisture conditions in landfills situated on the South African Highveld. J. S. Afr. Inst. Civ. Eng. 37 (2) 6-10. [ Links ]
CANFIELD DE, GLAZER AN and FALKOWSKI PG (2010) The evolution and future of Earth's nitrogen cycle. Science 330 (6001) 192-196. https://doi.org/10.1126/science.1186120 [ Links ]
CITY OF CAPE TOWN (2012) Project design document 9 April 2012. Mr Barry Coetzee, City of Cape Town Landfill Gas Extraction and Utilisation consideration of the proposed project. Programme of Activities (PoA), and Coastal Park Landfill Clean Development Mechanism Programme Activity (CPA), Cape Town: Department of Energy, Project Design Document (PDD), Cape Town. [ Links ]
DE BRUYN A (2019) Personal communication, 13 August 2019. Mr Adiel De Bruyn, Waste Services, Urban Waste Management, City of Cape Town, South Africa. [ Links ]
DWAF (Department of Water Affairs and Forestry, South Africa) (1996) South African Water Quality Guidelines (second edition) Volume 1: Domestic Use. DWAF, Pretoria. URL: www.dws.gov.za/Groundwater/documents/Pol_saWQguideFRESHDomesticusevol1.pdf [ Links ]
DWAF (Department of Water Affairs and Forestry, South Africa) (1998) Minimum requirements for water monitoring at waste management facilities (Second Edition). DWAF, Pretoria. URL: https://sawic.environment.gov.za/documents/267.PDF [ Links ]
DWAF (Department of Water Affairs and Forestry, South Africa) (1998) Minimum Requirements for waste disposal by landfill. DWAF, Pretoria. URL: https://sawic.environment.gov.za/documents/266.PDF [ Links ]
ENGELBRECHT C and MURRAY K (2017) Water quality interpretation (groundwater, surface water and leachate) - Coastal Park Solid Waste Disposal Site. Solid Waste Management Department, Disposal Branch, City of Cape Town. GEOSS Report No: 2016/0524. GEOSS, Stellenbosch. URL: www.geoss.co.za [ Links ]
EUROPEAN PARLIAMENT (2011) Council Directive 1999/31/EC, 26 April 1999 on the landfill of waste. URL: https://www.eea.europa.eu/policy-documents/directive-99-31-ec-on [ Links ]
FATTA D, PAPADOPOULOS A and LOIZIDOU M (1999) A study on the landfill leachate and its impact on the groundwater quality of the greater area. Environ. Geochem. Health 21 (2) 175-190. https://doi.org/10.1023/A:1006613530137 [ Links ]
HAN Z, MA H, SHI G, HE L, WEI L and SHI Q (2016) A review of groundwater contamination near municipal solid waste landfill sites in China. Sci. Total Environ. 569 1255-1264. https://doi.org/10.1016/j.scitotenv.2016.06.201 [ Links ]
HANEKOM E (2018) Waste management permit for the further development and operation of a Coastal Park Waste Disposal Facility on the remaining extent of Erf 93284, Cape Town. Department of Environmental Affairs and Development Planning, Cape Town. URL: http://sawic.environment.gov.za/ [ Links ]
IRISH EPA (Environmental Protection Agency of Ireland) (2003) Landfill Manuals-Landfill Monitoring (2nd edition). Wexford, Ireland. URL: https://vdocuments.net/landfill-manuals-landfill-monitoring-2nd-edition.html?page=2 [ Links ]
JG AFRIKA (2019) City of Cape Town water quality monitoring and interpretation at waste facilities: Coastal Park Landfill. JG Afrika ref. No. 004822RCP01. JG Afrika, Durban. [ Links ]
JOHNSON CA, RICHNER GA, VITVAR T, SCHITTLI N and EBERHARD M (1998) Hydrological and geochemical factors affecting leachate composition in municipal solid waste incinerator bottom ash: Part I: The hydrology of Landfill Lostorf, Switzerland. J. Contam. Hydrol. 33 361-376. https://doi.org/10.1016/S0169-7722(98)00077-1 [ Links ]
JOHNSON CA, KAEPPELI M, BRANDENBERGER S, ULRICH A and BAUMANN W (1999) Hydrological and geochemical factors affecting leachate composition in municipal solid waste incinerator bottom ash: Part II. The geochemistry of leachate from Landfill Lostorf, Switzerland. J. Contam. Hydrol. 40 (3) 239-259. https://doi.org/10.1016/S0169-7722(99)00052-2 [ Links ]
KENT DB, WILKIE JA and DAVIS JA (2007) Modelling the movement of a pH perturbation and its impact on adsorbed zinc and phosphate in a wastewater-contaminated aquifer. Water Resour. Res. 43 (W07440) https://doi.org/10.1029/2005WR004841 [ Links ]
NSW EPA (Environmental Protection Authority of New South Wales, Australia) (2016) Environmental Guidelines: solid waste landfills. (Second Edition). NSW EPA, Sydney. https://www.epa.nsw.gov.au/-/media/epa/corporate-site/resources/waste/solid-waste-landfill-guidelines-160259.pdf [ Links ]
PRZYDATEK G and KANOWNIK W (2019) Impact of small municipal solid waste landfill on groundwater quality. Environ. Monit. Assess. 191 1-14. https://doi.org/10.1007/s10661-019-7279-5 [ Links ]
STATE OF VERMONT AGENCY OF NATURAL RESOURCES (1999) Procedure addressing groundwater quality monitoring and responses when a groundwater standard is reached or exceeded at municipal solid waste landfills, revised 8 February 1999. Waste Management Division, Waterbury, Vermont. URL: https://dec.vermont.gov/sites/dec/files/wmp/SolidWaste/Documents/Groundwater%20.pdf [ Links ]
TRÄNKLER J, VISVANATHAN C, KURUPARAN P and TUBTIMTHAI O (2005) Influence of tropical seasonal variations on landfill leachate characteristics - results from lysimeter studies. Waste Manage. 25 (10) 1013-1020. https://doi.org/10.1016/j.wasman.2005.05.004 [ Links ]
WREFORD KA, ATWATER JW and LAVKULICH LM (2000) The effects of moisture inputs on landfill gas production and composition and leachate characteristics at the Vancouver Landfill Site at Burns Bog. Waste Manage. Res. 18 386-392. https://onlinelibrary.wiley.com/doi/abs/10.1034/j.1399-3070.2000.00138.x [ Links ]
YENIGÜL NB (2006) Summary. In: Groundwater Detection Monitoring System Design Under Conditions of Uncertainty. Eburon Academic Publishers, The Netherlands. https://repository.tudelft.nl/islandora/object/uuid%3Ae813533f-31a5-497a-9b1b-ccf9e39faeb9 [ Links ]
 Correspondence:
M Baderoon
Email: Muneeb.Baderoon@westerncape.gov.za
Received: 4 January 2023
Accepted: 19 January 2024

