


Services on Demand
Article
 English (pdf)
 Article in xml format
 Article references
Indicators

Related links
-
 Cited by Google
 -
 Similars in Google
Share

 Permalink
Water SA
On-line version ISSN 1816-7950
Print version ISSN 0378-4738
Water SA vol.50 n.1 Pretoria Jan. 2024
http://dx.doi.org/10.17159/wsa/2024.v50.i1.4040
RESEARCH PAPER
Utilization of hydrodynamic modelling to quantify water losses from the Sundays River between Darlington Dam and Korhaans Drift Weir
Aldré Nel; DE Bosman; GR Basson
Department of Civil Engineering, Stellenbosch University, Private Bag X1, Matieland 7602, South Africa
ABSTRACT
This study quantified transfer losses over the 2021/2022 water year for irrigation releases from Darlington Dam into the Sundays River, which are diverted at the Korhaans Drift Weir. A one-dimensional (1D) hydrodynamic model was set up and calibrated to simulate the transfer losses which were assumed to consist primarily of evaporation and evapotranspiration (ET). Flow measurements were undertaken with an acoustic doppler current profiler (ADCP) to verify the calibrations of the Parshall flumes at Darlington Dam and at Korhaans Drift Weir. The ADCP results showed that the Department of Water and Sanitation's (DWS's) existing discharge tables underestimated lower flows by 13% and higher flows by 16%. The hydrodynamic model results also estimated transfer losses between Darlington Dam and Korhaans Drift to range between 2.0% and 5.3%. It was determined that the transfer losses were seasonal and were lower than those determined by similar studies for other South African rivers.
Keywords: hydrodynamic modelling, Mike 11, acoustic doppler currency, profiler, transfer losses, evaporation, evapotranspiration, Sundays River
INTRODUCTION
The Lower Sundays River Water User Association (LSRWUA) manages releases from the Darlington Dam into the Sundays River and the diversions from the river at the Korhaans Drift Weir into the concrete-lined canal system which supplies water to irrigators in the Sundays River Valley, mainly for citrus irrigation, and to Nelson Mandela Bay Municipality's (NMBM's) Nooitgedacht Water Treatment Works.
The increase in agricultural development and the growth in the population of NMBM, as well as climate change, necessitate the effective management of water, especially in a semi-arid country like South Africa. This need for effective management was highlighted during NMBM's water crisis when residents were warned in June 2022 about the depleted water resources.
This paper is based on a research study that focused on the water management operations between Darlington Dam and Korhaans Drift Weir, and specifically on the transfer losses along this 51 km reach of Sundays River.
STUDY AREA
Catchment characteristics
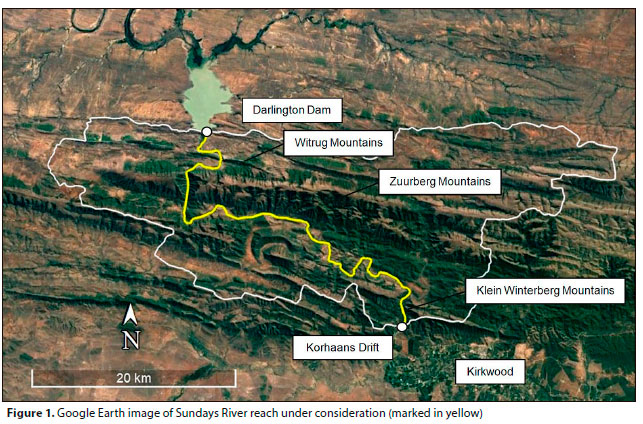
The river reach under consideration is located in Quaternary Catchment N40A with a catchment area of 17 486 km2. From Darlington Dam the river flows southwards and then turns eastwards along the Witrug Mountains. After passing through the Witrug Mountains, the river turns west and then passes through the Zuurberg Mountains in a southerly direction. From the Zuurberg Mountains, the river meanders eastwards between the Zuurberg Mountains and the Klein Winterhoek Mountains before passing through the Klein Winterhoek Mountains southwards to the diversion Weir at Korhaans Drift. The 51 km river reach between Darlington Dam, from which water is released, and the Korhaans Drift Weir, where the water is diverted, has an average slope of 1 in 547 and is marked in Fig. 1 as a yellow line. The boundary of Quaternary Catchment N40A is marked by the white polygon.
The geology of the area along the river reach between Darlington Dam and Korhaans Drift comprises sedimentary rocks of the Cape Supergroup. This river reach is predominantly underlain by shale, siltstone, subordinate sandstone, diamictite, tillite and subordinate shale, belonging to the Witteberg group. The sections of the reach that pass through the Zuurberg and the Klein Winterberg Mountains are underlain by quartzitic sandstone, subordinate shale, micaceous siltstone, and subordinate sandstone of the Witpoort and Weltevrede formations.
The study site is located in the semi-arid to arid Karoo and a portion of the river reach under consideration is situated within the Addo Elephant National Park. At the Darlington section of the Park, temperatures can reach a maximum of 48°C during summer with minimum temperatures just above 0°C during winter (SANParks, 2022). Verified S-pan evaporation records for sites at Darlington Dam (N2E001) and the Addo Research station (N4E001), located in the Sundays River Valley, are available from 1925 and 1959, respectively. The data indicate slightly higher evaporation rates for Darlington Dam, with the highest evaporation in January and lowest evaporation in June.
The region is characterized by very late summer rainfall with peak rainfall experienced between February and March (Lynch, 2001). Precipitation at Darlington Dam is usually in the form of thunderstorms and occasional cold fronts from the west (SANParks, 2022). Herald (1999) noted that in the Sundays River Valley rainfall is mainly cyclonic with thunderstorms occurring rarely.
Site visits were conducted to establish the composition of the riparian vegetation along the Sundays River between Darlington Dam and Korhaans Drift Weir. Sweet thorn trees (Vachellia (Acacia) karroo) and common reeds (Phragmites australis) predominantly cover the riparian zones. This is consistent with Du Plessis' (2000) study of riparian vegetation along the Skoenmakers River and the Volkers River.
LSRWUA operations
Each week the LSRWUA releases specific volumes of water from Darlington Dam based on the requests of the end-users. The LSRWUA aims to operate the scheme in such a manner that all released water is diverted into the canal infrastructure. The LSRWUA does not make additional releases to sustain the river and estuarine environments downstream of the Korhaans Drift Weir. The environmental flow requirements downstream of the Korhaans Drift Weir were unknown at the time that the study was conducted; however, DWS Deputy Director for the Eastern Cape Region, Mr. Koos Viljoen, confirmed that requests for the LSRWUA to make additional releases from Darlington Dam to provide spillage at the Korhaans Drift Weir are made when Gariep Dam and Van der Kloof Dam are overflowing (Viljoen, 2022).
The standard operational procedure of the LSRWUA is to commence releases from Darlington Dam on Saturday morning at 07:00 for the next period (week). Water is allowed to fill the Weir at Korhaans Drift and is released into the canal infrastructure on Sunday morning. The canals are afforded time to fill before water is released to supply the first irrigators at 06:00 on a Monday morning. Water is generally supplied until 17:00 on a Friday afternoon unless supply issues have been encountered during the week. Releases from the Darlington Dam are generally terminated on Thursday morning at 08:00 or at 12:00, depending on the requested demands.
During the months of May, June, and July, the LSRWUA drains the canal infrastructure to allow for routine maintenance. Maintenance is conducted on Mondays and Tuesdays during this winter period, which only allows water to be supplied for 3 days per week. Even though these are the cooler winter months, flows released from Darlington Dam are usually higher due to the more limited times available for utilising the canal.
METHODOLOGY
Parshall flume discharge verification
An acoustic doppler current profiler (ADCP) is a device that measures water currents based on the principles of the Doppler effect, i.e., the change in wave frequency during the relative motion between a wave and an observer. The device was used to verify the discharge tables for the Parshall flumes at Darlington Dam and Korhaans Drift Weir.
Releases from Darlington Dam and diversions at Korhaans Drift Weir were measured with the ACDP, for upstream head increments of approximately 50 mm up to maximum heads of 750 mm and 890 mm below Darlington Dam and at Korhaans Drift Weir, respectively. Data recorded from the fieldwork exercise were imported into RiverSurveyor Live software to calculate and generate discharge results.
Data collection
The verified data at Darlington Dam and at the Korhaans Drift Weir that were obtained from the Department of Water and Sanitation (DWS) included upstream head measurements for the Parshall flumes at both nodes, as well as water levels at the dam and at the Weir. The uncontrolled discharge over the auxiliary spillway at Darlington Dam was quantified by applying a discharge equation obtained from DWS to the verified water level data at Darlington Dam.
Meteorological data were recorded using two Davis Vantage Pro remote weather stations, one located at Darlington Dam and the other at Korhaans Drift Weir. The evaporation and rainfall data were used as inputs to the hydrodynamic model.
Hydrodynamic model setup
Model overview
A hydrodynamic model of the river reach between Darlington Dam and Korhaans Drift Weir was set up in Mike 11 to simulate and analyse flow characteristics and to quantify the transfer losses between the two nodes. The input data to Mike 11 consisted of a network, cross-section, boundary data and hydrodynamic (HD) parameter input files. Simulations were conducted at a 60-s fixed time-step from 1 June 2021 to 1 July 2022. Even though the actual water year was from 1 July 2021 to 1 July 2022, an additional month was simulated to allow the model to stabilize before the start of the water year. Steady-state initial conditions were specified for the hydrodynamic model simulations.
The hydrodynamic model can be described by the continuity equation stated below. In Eq. 1, Qin refers to the controlled releases, auxiliary spillway overflow and leaks from the 'stoney gates' at Darlington Dam into the river reach. Qout refers to the controlled diversion at Korhaans Drift Weir as well as the spillage over the Weir that is not diverted into the formal canal scheme. Qrain is the additional discharge introduced to the system via rainfall whereas QE and QET refer to reduction in flow due to evaporation and evapotranspiration, respectively.

River alignment
A topographical survey conducted by DWS in 1991, comprising 49 cross-sections between Darlington Dam and Korhaans Drift Weir, was used for the river alignment. The Department of Rural Development and Land Reform supplied coordinated ortho-imagery of the study area which was used to establish the low-flow route of the river and to determine route lengths to be used in the hydrodynamic model. XY coordinates of the surveyed sections were identified from the low-flow route and used to populate the network file. A regular-type branch, i.e., a standard Mike 11 branch with an alternating grid of water level and discharge points, was created for the river reach under consideration.
Most of the surveyed sections did not transect the identified low-flow route perpendicularly. To increase the accuracy of the hydrodynamic model, the sections were amended by a factor of cos θ. The revised cross-sectional survey data were used to generate the open model cross-sections. Distinction was drawn between riverbed and bank conditions with initial Manning's n roughness coefficients of 0.045 and 0.06 assigned to the riverbed and banks, respectively. The topographical survey provided cross-sections at various chainage intervals. A maximum dx, i.e., the distance between two consecutive h-points on the computational grid of the model, of 300 m was specified to increase the accuracy of the model.
A Weir structure was included at chainage 51 808 m to include the damming effects of the Weir at Korhaans Drift. Section 49 was duplicated and amended to include a rectangular Weir with a crest length of 150 m and height of 121.2 m amsl. A special Weir with a head-discharge relationship based on the DWS discharge equation for the Weir was specified.
Input parameters
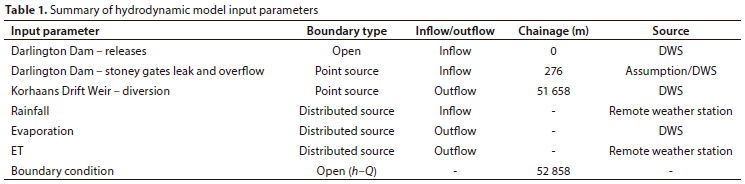
Discharge from the sleeve valves at Darlington Dam was modelled as an open inflow boundary condition at chainage zero, using verified DWS discharge data. The hydrodynamic model was simplified by including the leak from the stoney gates and uncontrolled overflow at the auxiliary spillway as a point-source boundary condition at chainage 276 m. Diversion at Korhaans Drift Weir was modelled as a point-source inflow boundary condition at chainage 51 658 m, the nearest section upstream of the Weir, using verified DWS diversion data. Negative values were used to simulate diversion at the Weir.
Rainfall data (mm/day) were included as a distributed source inflow boundary condition over the length of the river reach. The literature review revealed a rainfall region between the Zuurberg mountains and the Klein Winterberg mountains similar to the rainfall region at Korhaans Drift. The inclusion of rainfall in the model was simplified based on this observation. Rainfall data recorded at Darlington Dam were applied up to chainage 12 763.157 m, where the river passes through the Zuurberg Mountains, and data recorded at the Korhaans Drift Weir applied downstream of this chainage.
Evaporation data (mm/day) were included as a distributed source outflow boundary condition in the model. For modelling purposes, evaporation and ETo data from Darlington Dam and Korhaans Drift Weir were applied to the first half and second half of the river reach, respectively. ET volumes (m3/day) were estimated using the equation below and included as a distributed source inflow boundary condition. In Eq. 2, ET is the riparian ET, ETo is the reference ET measured by the remote weather stations, Kc is the crop factor and A is the area covered by the riparian vegetation.

The Kc value of 0.078 obtained from the study by Ntshidi (2015) was adopted to quantify the ET contribution from thorn trees. The Kc value of 3.4 determined by Headly et al. (2012) for developed reeds in Australia was adopted for reeds as opposed to Kc values obtained in sites located in Europe and Asia. The total riparian area to contribute to ET was identified by importing high-resolution ortho-photographs into Civil Designer software. A distinction between thorn trees and common reeds could not be made with the aid of the available ortho-photographs. The limited access to the riverbanks did not afford an opportunity to accurately establish the thorn tree and common reed composition of the riparian zone. Due to a lack of information, a composition of 50% thorn trees and 50% common reeds was assumed for the riparian zone.
An open h-Q boundary condition was specified at the last section downstream of the Weir to allow stable modelling. A summary of the boundary conditions in the hydrodynamic model is listed in Table 1.
Modelling assumptions
Return flow along the river reach was not considered in the hydrodynamic model study. The LSRWUA is aware of only one user that is scheduled to abstract raw water directly from the Sundays River between Darlington Dam and Korhaans Drift Weir. The water use license issued to the property allows 16.3 ha, or 146 700 m3/a, of water to be abstracted. This volume equates to 0.06% of the total scheduled water administered by the LSRWUA. Numerous failed attempts were made to contact the owner to ascertain the extent of the abstraction operations on the private property. Any abstraction at this node was classified as unknown losses to the system in terms of this study.
The literature study yielded little to no information related to seepage losses along the Sundays River. SANParks confirmed that no known boreholes are installed along the river reach under consideration which could have allowed monitoring. Seepage losses were assumed to be either minimal, based on the perennial nature of the river reach and the assumption that infiltration recharging surrounding aquifers had reached equilibrium after years of continual flow, or negligible compared to evaporation and ET losses in the arid to semi-arid climate. This assumption is in line with an assumption made by McKenzie and Craig (2001) in quantifying transmission losses along the Orange River. The effect of possible seepage was tested in the hydrodynamic model.
The LSRWUA estimates the leak from the stoney gates at Darlington Dam for weekly water supply operations by terminating releases from the sleeve valves and monitoring the flows into the canal system at Korhaans Drift Weir. The river is afforded sufficient time to stabilize after which the sluice gates at the Weir are fully opened and the flow monitored at the Parshall flume. Since releases from Darlington Dam are the only source of inflow into the reach of the Sundays River during a period of zero rainfall, it is assumed that after the sleeve valves are closed, and permitting that zero flows are discharged over the auxiliary spillway, the flow recorded at Korhaans Drift Weir is adopted as the leak volume through the stoney gates.
The water levels in Darlington Dam were relatively high during the 2021/2022 water year owing to the healthy state of capacity of the upstream dams. Although the leak volume through the stoney gates would be subject to the water level in the dam, such a relationship has not been formally developed. Over the course of the 2021/2022 water year the exercise described above was conducted 5 times over periods in which zero rainfall was recorded at Darlington Dam and Korhaans Drift Weir. The results ranged from a leak of 0.97 m3/s for a Darlington Dam level of 8.0 m, to 1.14 m3/s for a Darlington Dam level of 8.7 m. A constant leak ranging between 1.1 m3/s and 1.4 m3/s was therefore assumed for initial model calibration purposes.
Hydrodynamic model calibration and verification
The modelling assumptions and input parameters were calibrated by simulating the controlled discharge and diversion volumes at Darlington Dam and Korhaans Drift Weir, respectively. The period between 00:00 on 14 October 2021 and 00:00 on 5 November 2021 was identified for calibration purposes. This period was identified because no rain and no discharge over the uncontrolled auxiliary spillway at Darlington Dam were recorded over this period.
The simulated water levels for the simulated flows were compared to the measured water levels immediately upstream of the Korhaans Drift Weir. After initial calibration attempts, the model was subject to a validation process. Thereafter the calibrated input parameters were applied to simulate flows over the period from 17 June 2021 to 4 August 2021. This period was selected as the Korhaans Drift Weir overflowed on a number of occasions, although there were no flows over the auxiliary spillway at Darlington Dam.
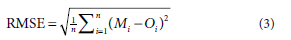
The root mean square error (RMSE) method was used to quantify the deviation between the modelled and the measured results or, in other words, to indicate the predictive performance of the calibrated model. The RMSE between the observed and modelled water levels was calculated using the equation below in which n is the sample size, Mi is the modelled water level at timestep i, and Oi is the observed water level at timestep i. An RMSE value of zero indicates a perfect fit between the modelled and measured data. Due to the possible discharge inaccuracies associated with the crest length of Korhaans Drift Weir, the water level results were used in the RMSE method rather than the discharge results.
RESULTS AND DISCUSSION
Characteristics of 2021/2022 water year
The primary meteorological parameters for the hydrodynamic model study were the open surface evaporation, the ET (evapotranspiration) rate of the riparian vegetation, and the daily rainfall. The evaporation rate followed a similar pattern to that of the historical evaporation data, with peak evaporation rates in January and minimum evaporation rates in June. The ETo rate followed a similar pattern to that of the evaporation data, as was intuitively expected. Apart from the month of December, below-average rainfall was experienced at Darlington Dam and at the Korhaans Drift Weir during the simulation period.
Data obtained from DWS showed that due to sustained rainfall in the catchment area the capacity of Gariep Dam had increased from 80.93% on 3 October 2021 to 114.25% on 21 December 2021, and overflowed constantly from 8 March 2022 to 13 May 2022.
Heavy rains in the Jansenville area of Darlington Dam's catchment resulted in the dam overflowing on 6 December 2021. Darlington Dam is mainly supplied by Gariep Dam via the Orange-Fish-Sundays Transfer Scheme. The operators at the Elandsdrift Weir and at the De Mistkraal Weir on the Transfer Scheme advised that while Gariep Dam was overflowing water was released to supply Darlington Dam which overflowed until 11 January 2022.
Darlington Dam remained near full for most of the 2021/2022 water year and the auxiliary spillway overflowed continuously from 18 March 2022 until 14 June 2022. Darlington Dam overflows when its capacity exceeds 44% of its full supply capacity because the auxiliary spillway gates are kept in an open position for dam safety reasons (Jacobs, 2016).
Parshall flume discharge calibration verification
The website of DWS Hydrological Services provides a discharge-head relationship for the 9.114 m Parshall flume below Darlington Dam of Q = 21.5603(H + 0.0001)1.6044 and Q = 14.2422(H + 0.0004)1.6036 for the 6.096 m Parshall flume at Korhaans Drift where water is diverted into the main canal.
The discharge-head relationships determined from the ADCP results were Q = 19.0081(H + 0.0100)1.6656 and Q = 15.5690 (H + 0.0011)1.4775, respectively. The ADCP fieldwork results were compared graphically to the DWS discharge-head relationships as illustrated in Figs 2 and 3.
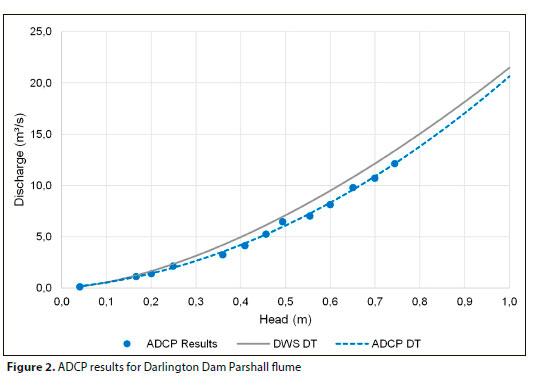
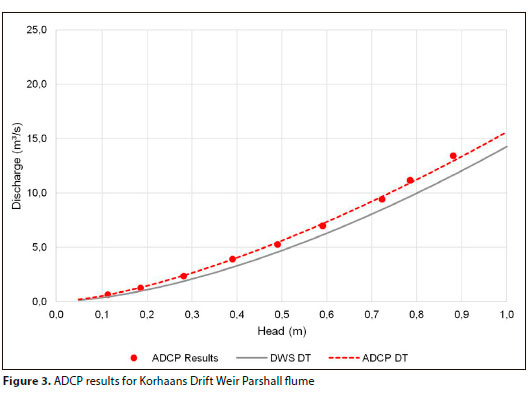
The LSRWUA typically releases between 3 m3/s and 15 m3/s from Darlington Dam for diversion at the Korhaans Drift Weir. The flows measured with the ADCP were on average 13% lower than those determined from the stage-discharge relationship and between 10% and 15% lower than those for the rating curves of a standard 12-inch (304.8 mm) Parshall flume. On the other hand, for the same range of flows, the flowrates measured at Korhaans Drift were on average 15% higher than those determined with DWS's stage-discharge relationship.
Flow through the sleeve valves at Darlington Dam is discharged into the plunge pool situated upstream of the Parshall flume. This pool is lined with coarse rock and boulders which influence the approach flow to the flume. The possibility of aerated water passing though the flume, on account of the relatively short length of the plunge pool and the irregular flow patterns in approach flow that were observed during testing, could also adversely affect flow measurement accuracy. The ADCP results and the DWS DT that are plotted in Fig. 2 show increases in the differences from the DWS stage-discharge relationship for increasing discharges. This could arise on account of the increased irregularity of the approach flow velocity depth profile as the discharge is increased.
The velocity profile of the 0.125 m3/s flow proved much more uniform compared to the velocity profile of the 12.160 m3/s flow.
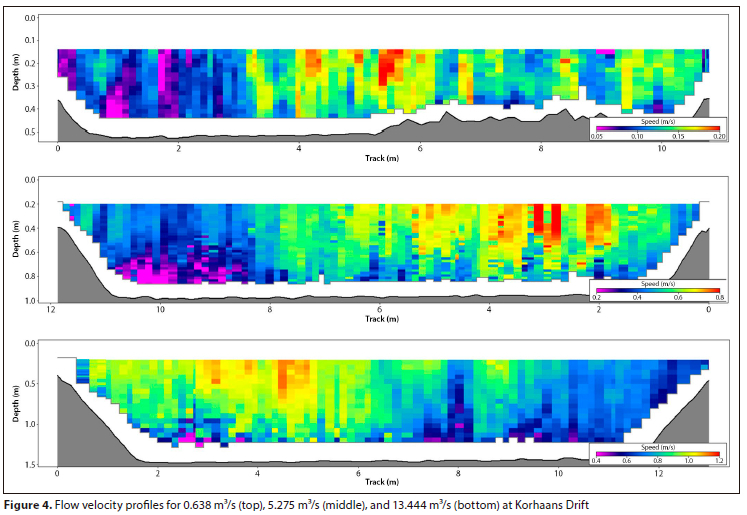
Water is diverted at Korhaans Drift into a trapezoidal concrete canal. The canal makes a sharp bend to the right immediately downstream of the sluice gates, from where it parallels the river. Eddies and turbulence were visible in the flow at the bend in the canal downstream of the sluice gates. Although the Parshall flume in the canal is located approximately 120 m downstream of the bend, the ADCP measurements confirmed that the bend affects the flow pattern at the flume.
Figure 4 shows the velocity distributions that were measured for flows of 0.638 m3/s, 5.275 m3/s, and 13.444 m3/s at Korhaans Drift, with the ACDP and the RiverSurveyor software. It is evident that the maximum flow velocities in the canal changed from left to right as the discharge was increased and that the velocity distributions for the various flows were significantly different and probably account for the inaccurate flow measurements at the Parshall flume.
As detailed topographical surveys of the flumes were not undertaken or were not available, it was not possible to determine whether the discharge-head relationship used by DWS could arise from possible geometric irregularities in constructing the relatively large concrete structures. Slight lateral and/or longitudinal settlement of the flumes could also result in a deviation from standard rating curves.
Hydrodynamic model calibration and validation
The model calibration exercise necessitated increasing the riverbed roughness to align the modelled water levels upstream of Korhaans Drift Weir with measured water levels. A Manning's n roughness coefficient of 0.055, described as gravel with particle sizes between 75 mm and 150 mm in a winding or braided river by Chadwick et al. (2013), yielded the most accurate results. The simulation exercises listed below emphasize the hydrodynamic model's sensitivity, specifically in terms of different Parshall flume rating curves, evapotranspiration, and possible seepage. It should be noted that although evaporation was included in all calibration simulations, amendments to evaporation data were not considered and therefore are not listed in the tables.
Simulation A: Effect of different rating curves
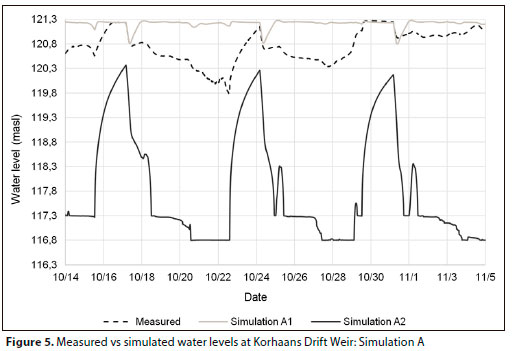
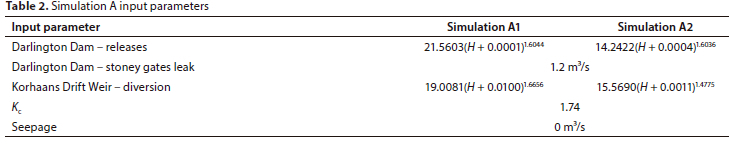
The results of the ADCP discharge verification exercise and the rating curve equations obtained from verified DWS data were applied to the discharge parameters of the model in separate instances for comparison. The modelled results yielded too much water in the river reach when DWS rating curves were applied to the discharge at Darlington Dam and diversion at Korhaans Drift Weir, which was modelled to spill for most of the calibration period. Conversely, by applying the ADCP results to the discharge and diversion parameters at Darlington Dam and the Korhaans Drift Weir, respectively, the simulation ran dry on numerous occasions and an additional 1.3 million m3 of water was added to the river reach to adhere to the observed diversion volumes.
The results of the comparative simulations are illustrated in Fig. 5, in which Simulation A1 represents the results of the DWS rating curves applied to the model, and Simulation A2 represents the results of the ADCP rating curves applied to the model. The input parameters used for Simulation A1 and A2 are summarized in Table 2.
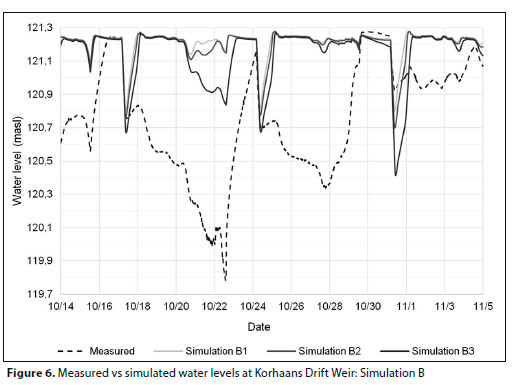
Simulation B: Effect of different Kc values
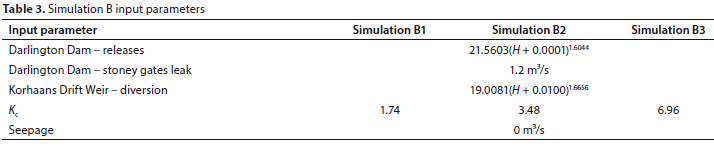
The effects of an increased Kc, and thus an increase in ET, were considered in calibrating the hydrodynamic model. ET was applied to the model using Eq. 3, which is the product of three parameters. Therefore, irrespective of which of the three parameters is increased, there is a corresponding increase in the total ET. For the purposes of illustrating the different effects of ET on the calibration of the model, the Kc value was increased. The different input parameters for Simulation B are listed in Table 3, with the discharge and diversion parameters at Darlington Dam and Korhaans Drift Weir based on the DWS rating curves.
The results for the different modelled Kc values are shown in Fig. 6. Simulation B1 represents the modelled result for a Kc value of 1.74, which was based on the literature review. Simulation B2, in which the Kc value was doubled, showed a relatively small effect on the modelled results. Simulation B3 represents a Kc value increased fourfold and, although a slightly more significant effect is evident from Fig. 6, the increase in Kc failed to provide results similar to the observed data. The study by Headly et al. (2012) recorded a maximum common reed Kc value of 6 for only 2 months of the year and, since common reeds do not cover the total riparian area considered in this study, further increases in Kc values were not considered in attempts to calibrate the model.
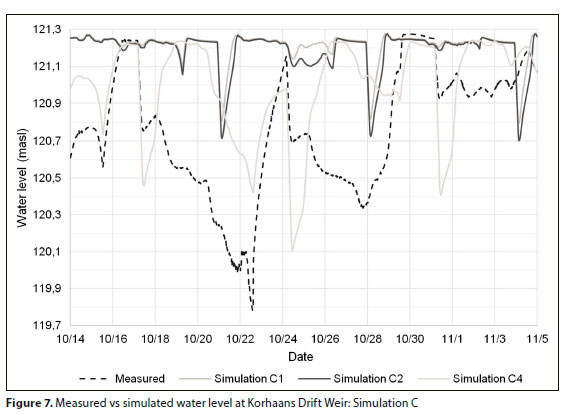
Simulation C: Effect of possible seepage
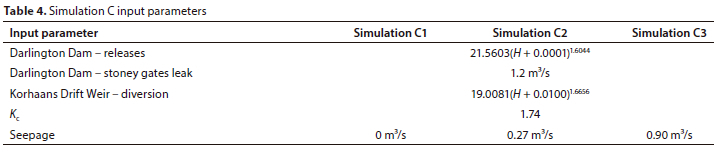
The assumption that seepage would be regarded as minimal over the river reach under consideration was declared previously. The effects of possible seepage were, however, considered. Seepage was modelled as a point-source inflow boundary condition at chainage 19 681 m, roughly in the middle of the river reach under consideration, with negative values used to simulate flow out of the system.
The average discharge from Darlington Dam into the river reach over the calibration period was 9 m3/s. To model seepage effects, a constant 3% and 10% of this discharge was assumed as seepage for Simulation C2 and Simulation C3, respectively. The accompanying input parameters are listed in Table 4 with the discharge and diversion parameters at Darlington Dam and Korhaans Drift Weir based on the DWS rating curves.
The results of Simulation C are illustrated in Fig. 7, in which a relatively small effect between zero seepage and a seepage rate of 0.27 m3/s is evident. Although a seepage rate of 0.9 m3/s had a more considerable effect on the model results, realistic model results were not achieved. A seepage rate in the same order of magnitude as that of the assumed stoney gates leak is doubted. The LSRWUA incorporates the assumed leak from the stoney gates in their weekly water supply operations and a seepage of similar magnitude would result in a constant shortfall in supply operations.
Simulation D: Calibrated parameters
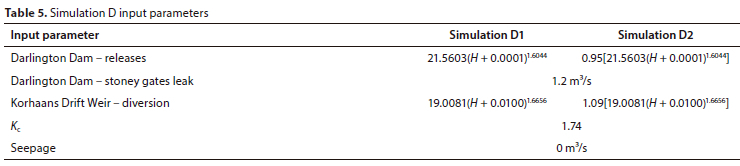
The hydrodynamic model was found to be very sensitive to amendments in the discharge rate from Darlington Dam and diversion rate at Korhaans Drift Weir. Adjustments to DWS rating curves for the Parshall flumes at Darlington Dam and Korhaans Drift Weir were required to calibrate the model. The adjustments were partially based on the results of the ADCP exercise and constants of 0.95 and 1.09 were applied to the DWS Parshall flume equations at Darlington Dam and Korhaans Drift Weir, respectively, to yield promising calibration results.
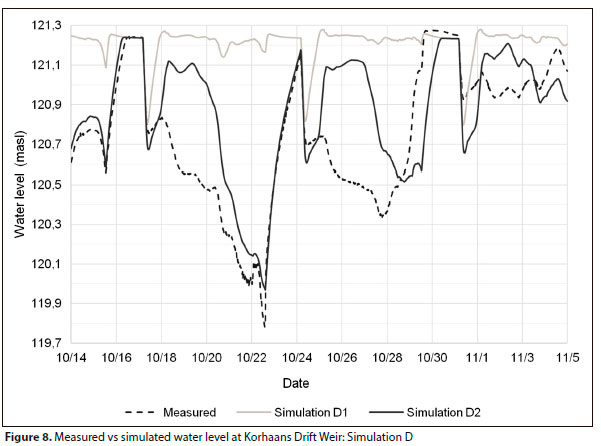
The input parameters used in Simulation D are summarized in Table 5. The simulation results are illustrated in Fig. 8, in which the simulation based on the original DWS rating curves (Simulation D1) is compared to the simulation based on the amended discharge equations (Simulation D2).
Model validation
The parameters used for Simulation D2 were applied to the validation period to yield a RMSE value of 0.273 for all measured and model-generated water levels. The spillage over the Weir at Korhaans Drift was of importance to the accuracy of the model and a RMSE value of 0.016 was determined when only water levels above the crest of the Weir were considered.
The adjustments, in terms of discharge to and diversion from the river reach, required to achieve decent calibration, support the results obtained from the ADCP verification exercise, which indicated lower release volumes at Darlington Dam and greater diversion volumes at Korhaans Drift Weir compared to the rating curve data of DWS. The calibration results supported this notion only to an extent, as the modelled river reach ran dry numerous times when the exact release and diversion regression equations from the ADCP results were applied to the model.
Modelled transfer losses
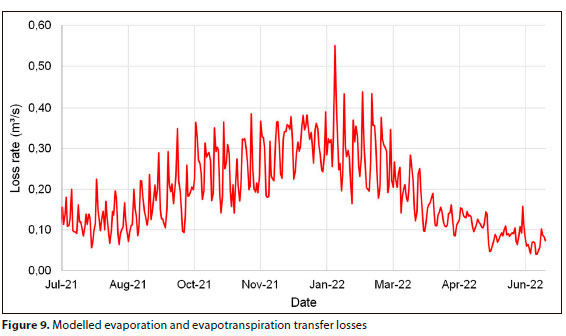
The calibrated and validated hydrodynamic model was used to estimate the rate at which flow was lost through evaporation and ET, as well as the rate at which flow was gained through rainfall over the river reach under consideration. The results yielded a minimum evaporation flowrate of 0.010 m3/s in June 2022 and a maximum flowrate of 0.220 m3/s in January 2022. Coincidentally a minimum and maximum ET flowrate of 0.021 m3/s and 0.330 m3/s were modelled in June 2022 and January 2022, respectively. The rainfall results yielded a maximum flowrate of 0.069 m3/s on 6 February 2022. The magnitude of the modelled rainfall flowrates suggested that it would have a minimal effect on the results of this study.
The combined flowrate of evaporation and ET over the 2021/2022 water year is illustrated in Fig. 9. The graph follows a similar pattern to historical evaporation and ET trends, with lower losses over the cold winter months and higher losses over the hot summer months, which was expected.
Water balance
A water balance exercise for the 2021/2022 water year was conducted between Darlington Dam and Korhaans Drift Weir to offer perspective on the results of the study. The input parameters consisted of verified flow data obtained from DWS, as well as results from the hydrodynamic modelling conducted in this study.
Flow volumes added to the system were denoted positive while volumes lost or diverted from the system were denoted negative.
The water balance results indicate a volume of 62.157 million m3 of water that spilled at Korhaans Drift Weir between the 1 July 2021 and 1 July 2022. If the weighted-average water cost rate is applied, the monetary value of water lost to the system over the 2021/2022 water year equates to 15.5 million ZAR. It should be noted that since the LSRWUA opts to divert all released water into the formal canal scheme under routine water supply operations, and due to the absence of a quantified environmental flow requirement downstream of Korhaans Drift Weir, the ecological, social and economic contributions, and the effects of spillage at the Weir, were not considered or quantified in this study.
The results of the water balance exercise, expressed monthly, are shown in Fig. 10. It should be noted that, for illustration purposes, volumes introduced and extracted from the system are shown relative to one another in the figure. The unaccounted volume for December, for instance, was 5.071 million m3 and not 33.233 million m3. The rainfall volume applicable to the water balance was omitted for illustration purposes due to the relatively small magnitude of the contribution. The significant volume that overflowed at Darlington Dam and Korhaans Drift Weir between December and June was a result of heavy rain in the dam's catchment in December, and the excess water diverted from Gariep Dam while the dam was overflowing.
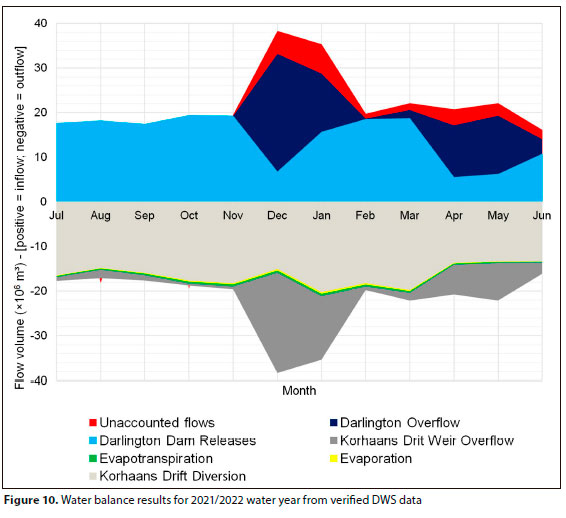
Most of the water that spilled at Korhaans Drift Weir was a result of Darlington Dam overflowing. There were, however, spillages at Korhaans Drift Weir over the months of July to November during which Darlington Dam did not overflow. The relatively short intervals of the Weir overflowing during this period could be attributed to water supply operations.
Since water supply operations are based on a request system, any cancellation or failure to abstract the volume of water ordered increases the risk of water being lost to the system. The relatively long transit times from Darlington Dam to Korhaans Drift Weir do not allow quick amendments to the volume of water at the Weir. The room for operational error or flexibility in water supply operations is also limited by the siltation at Korhaans Drift Weir. The Weir's storage ability has been drastically reduced by the effects of siltation.
The transfer losses estimated in this study were assumed to comprise of evaporation and ET. The total volume of water lost to evaporation varied from 0.071 million m3 for the month of June to 0.395 million m3 for the month of January. Similarly, ET losses were estimated to range between 0.142 million m3 for the month of June to 0.464 million m3 for the month of January. ET losses outweighed evaporation losses for every month of the water year and could be attributed to the area covered by vegetation as well as the high Kc value ascribed to reeds along the river.
The results of the hydrodynamic modelling indicated a total transfer loss volume of 6.181 million m3 for the period of study.
The LSRWUA generally opts to incorporate any water overflowing at Darlington Dam's uncontrolled spillway into the water being supplied via the formal canal scheme. This practice is particularly relevant over the months of December 2021 to June 2022. As a result of the variability in flow introduced to the river reach over the study period, and the relatively small transfer loss volumes, the total transfer losses were compared to the volume of water diverted into the canal infrastructure at Korhaans Drift.
The total volume of transfer losses for the 2021/2022 water year was 3.1% of the total volume diverted at Korhaans Drift Weir. This figure fluctuated, as expected due to climatic conditions, between 2.0% during the colder winter months to 5.3% over the hotter summer months. These proportions were found to be relatively lower compared to similar studies conducted for other South African rivers.
The water balance exercise yielded a total unaccounted flow volume of 21.142 million m3 for the 2021/2022 water year. Over the period between July 2021 and November 2021 in which Darlington Dam did not overflow, the unaccounted volume fluctuated between 0.2% and 7.5% of the total volume of water diverted at Korhaans Drift Weir. This observation could be attributed to several reasons. It is possible that the volume of water added to the river reach through rainfall was not accurately modelled. The mountainous terrain adjacent to the river reach could also introduce delayed additions of water to the river through groundwater recharge after significant rain. Rainfall data were only recorded at Darlington Dam and Korhaans Drift Weir and no data were available along the reach of the river between these two nodes. However, it is suspected that inaccurate rainfall modelling would have a limited effect on the water balance results compared to other modelling parameters. A conclusive relation between monthly rainfall and monthly unaccounted volumes could not be defined over the study period.
LSRWUA records indicate that an assumed leak from Darlington Dam's stoney gates of0.6 m3/s was used in water supply calculations for the month of August. The assumed leak was increased to 0.8 m3/s for the first 2 weeks, and to 1.2 m3/s for the latter 2 weeks, in water supply calculations for the month of September. The increase in assumed leak from 0.6 nvVs to 1.2 m3/s for the month of August equates to an unallocated loss increase from 3.3% to 7.5% of the diverted water at Korhaans Drift Weir.
The significant increase in volume of unaccounted flow from December 2021, when Darlington Dam overflowed, is evident in Fig. 10. The volume of unaccounted flow increased from 0.307 million m3 in November to 5.071 million m3 in December. The monthly unallocated volumes are consistently greater over the months in which Darlington Dam overflowed compared to the first 5 months of the water year.
The accuracy of the water balance exercise is, amongst other parameters, subject to the accuracy of the measured spillage at Korhaans Drift Weir. The negative values of unallocated flow volumes from December 2021 to June 2022 could suggest that the discharge equation quantifying flow through the auxiliary spillway at Darlington Dam underestimates volumes spilled at the dam. The increase in unaccounted flow volumes with an increase in discharge over the auxiliary spillway and spillage at Korhaans Drift Weir is therefore attributed to inaccuracies in the discharge equations of the structures.
CONCLUSION
The LSRWUA operates a formal canal scheme in the Sundays River Valley to supply bulk raw water to the SRVM and NMBM, as well as to local irrigators. Water is released weekly from Darlington Dam and is transferred along the Sundays River where it is diverted into the canal scheme at Korhaans Drift Weir outside of Kirkwood. This study used a 1D hydrodynamic model to quantify transfer losses along the 51 km reach of the Sundays River between the dam and the Weir.
Flow measurements by ADC tests were conducted to validate the discharge tables for the Parshall flumes at Darlington Dam and Korhaans Drift. In considering flows expected under normal water supply operations, the test results yielded average flows of 13% lower and 15% higher compared to the DWS discharge tables for Darlington Dam and Korhaans Drift, respectively. The differences in the measured flow rates were largely attributed to flow conditions upstream of the Parshall flumes.
The calibration and validation of the hydrodynamic model found a riverbed roughness coefficient of 0.055 to produce most accurate lag and simulation results. The calibration and validation process also necessitated the verified DWS release data at Darlington Dam to be reduced by a constant 5%, and the verified DWS diversion data at Korhaans Drift to be increased by a constant 9%, to replicate observed water levels at Korhaans Drift. This observation supported the results of the ADCP tests to a certain extent. Modifying the discharge rating curves by 5% and 9%, respectively, was also in line with an observation made by Dr Pieter Wessels, retired head of the flow gauging station division at DWS, who conducted accuracy tests on DWS-owned Parshall flumes and found the measuring structures to be inaccurate by at least 7% (Wessels, 2022).
Transfer losses were assumed to consist of evaporation and ET. The hydrodynamic model estimated transfer losses to amount to 6.181 million m3 for the 2021/2022 water year. This volume equates to 3.1% of the total volume diverted for supply operations at the Korhaans Drift Weir. ET losses were also noted to fluctuate between 2.0% in winter and 5.3% in summer, of the total water diverted into the formal canal scheme.
The water balance exercise conducted in this study yielded a total volume of 62.157 million m3 of water that spilled at Korhaans Drift Weir during the 2021/2022 water year. Spillage at the Weir is seen as a loss to the inter-basin transfer system and, when water rates applied by the LSRWUA are considered, this volume amounts to 15.5 million ZAR. Although a significant portion of water that spilled at Korhaans Drift Weir could be attributed to Darlington Dam overflowing, frequent flows over the Weir were recorded during times when Darlington Dam was not overflowing, suggesting scope for increased efficiency in water management operations.
CONFLICT OF INTEREST
The authors do not have any conflict of interest to declare.
ACKNOWLEDGEMENTS
The authors would like to express gratitude towards the LSRWUA for funding the study, the Department of Water and Sanitation for timeously providing the data required to complete the study, and South African National Parks for assisting with access to the study site.
ORCID
GR Basson: https://orcid.org/0000-0001-7349-0205
REFERENCES
CHADWICK A, MORFETT J and BORTHWICK M (2013) Hydraulics in Civil and Environmental Engineering. CRC Press, Abingdon. 144 pp. https://doi.org/10.1201/b14556 [ Links ]
DAHLIN WQ and WETZEL JM (1988) Parshall flume calibrations approach studies 12-inch throat. Project report, University of Minnesota. [ Links ]
DU PLESSIS AJE (2000) The response of the two interrelated river components, geomorphology and riparian vegetation, to interbasin water transfers in the Orange-Fish-Sundays River Interbasin Transfer Scheme. Master's thesis, Rhodes University. [ Links ]
GU R and DEUTSCHMAN M (2001) Hydrologic assessment of water losses in river. J. Water Resour. Plann. Manage. 127 (January/ February) 6-12. https://doi.org/10.1061/(ASCE)0733-9496(2001)127:1(6) [ Links ]
HEADLY TR, DAVISON L, HUETT DO and MÜLLER R (2012) Evapotranspiration from subsurface horizontal flow wetlands planted with Phragmites australis in sub-tropical Australia. Water Res. 46 345-354. https://doi.org/10.1016/j.watres.2011.10.042 [ Links ]
HERALD J (1999) Hydrosalinity studies in the Coerney Valley. Project report, WRC Report No 195/2/99. Water Research Commission, Pretoria. [ Links ]
JACOBS J (2016) Capacity determination of Darlington Dam. Project report, Department of Water and Sanitation, Pretoria. [ Links ]
LYNCH SD (2001) South African Atlas of Agrohydrology and Climatology. URL: https://planet.uwc.ac.za/NISL/Invasives/Assignments/GARP/atlas/atlas_toc.htm (Accessed 6 May 2022). [ Links ]
MCKENZIE R and CRAIG A (2001) Evaluation of river losses from the Orange River using hydraulic modelling. J. Hydrol. 241 62-69. https://doi.org/10.1016/S0022-1694(00)00368-1 [ Links ]
NTSHIDI Z (2015) A comparative assessment of the quantity and sources of water used by alien invasive Prosopis spp. and indigenous Acacia karroo in the Northern Cape Province. Master's thesis, University of the Western Cape. [ Links ]
SANPARKS (2022) Addo Elephant National Park. URL: https://www.sanparks.org/parks/addo/tourism/climate.php#:~:text=The%20mean%20annual%20rainfall%20varies,to%20700mm%20near%20Woody%20Cape (Accessed 30 May 2022). [ Links ]
VILJOEN K (2022) Personal communication, 19 October 2022. Deputy Director for the Eastern Cape Region, Department of Water and Sanitation, South Africa. [ Links ]
WESSELS P (2022) Personal communication, 13 September 2022. Head (retired) of the flow gauging station division, Department of Water and Sanitation, South Africa. [ Links ]
 Correspondence:
Aldré Nel
Email: nelaldre@gmail.com
Received: 17 November 2022
Accepted: 5 December 2023

