


Services on Demand
Article
 English (pdf)
 Article in xml format
 Article references
Indicators

Related links
-
 Cited by Google
 -
 Similars in Google
Share

 Permalink
Water SA
On-line version ISSN 1816-7950
Print version ISSN 0378-4738
Water SA vol.50 n.1 Pretoria Jan. 2024
http://dx.doi.org/10.17159/WSA/2024.V50.I1.4046
RESEARCH PAPER
Assessment of the spatiotemporal dynamics of the hydrological state of non-perennial river systems and identification of flow-contributing areas
Sagwati E MaswanganyeI, II; Timothy DubeI; Nebo JovanovicI; Evison KapangaziwiriI; Dominic MazvimaviI
IInstitute for Water studies, University of the Western Cape, Bellville, South Africa
IIFynbos Node, South African Environmental Observation Network, Cape Town, South Africa
ABSTRACT
Non-perennial rivers (NPRs) have three hydrological states; each state has its importance, function and implication for water resource management. The dynamics of these states have been inadequately assessed and understood. Hence, this study sought to determine the spatiotemporal variations in the hydrological :onditions of NPRs, focusing on the Touws River-Karoo drylands and Molototsi River within the semi-arid region of the Limpopo Province of South Africa. Additionally, the study aimed to delineate and characterize the primary areas contributing to runoff in these two river systems. Sentinel-1 and Sentinel-2 satellite data sources were employed in this study. Specifically, the modified normalized difference water index (MNDWI) derived from Sentinel-2 was utilized to delineate water surface areas along the two rivers. Subsequently, these derived datasets were utilized to assess the hydrological states over a 32-month period (2019-2022,. Based on the presence of water, the river's state was classified as flowing, pooled, or dry. The results showed that remote sensing can be used to determine the hydrological state of the two river systems with -90% overall accuracy. However, there is about a 30% chance that a flow event can be missed using Sentinel-2 due to clouds and temporal resolution. Some of these gaps can be filled using synthetic aperture radar (SAR) data (Sentinel-1), as demonstrated with the Molototsi River. In the Molototsi catchment, the upper catchment contributes the majority of flows. For theTouws River, the southwestern part of the catchment was determined as the major contributing area for the observed flows. This suggests that the chosen observation site might riot be representative of upper catchment dynamics; therefore, a monitoring site in the upper catchment is equired. This study provided hydrological information and an approach that can be used to monitor the hydrological states for better understanding and management of NPRs and catchments.
Keywords: aquatic states, hydrological phases, hydro-dynamics, runoff, temporary rivers hydrology
INTRODUCTION
Non-perennial rivers (NPRs) are rivers that naturally cease to flow periodically. They account for more than 50% of the world's river network and are highly dynamic, switching between three hydrological states: flowing, pools and dry riverbeds. Many studies have summarised these hydrological states into the wet and dry states, with periods when the river has isolated pools considered as dry or wet (flow or no-flow), depending on the study's objective (Bonada et al., 2020). Pools tend to form immediately after flow cessation and begin to dry out. Some rivers or reaches can be without pools subsequently which is the dry riverbed state. These hydrological states are also referred to as hydrological phases. It is noteworthy that some ecological studies define hydrological states as river health (De Girolamo et al., 2015). In this study, hydrological state refers to the flow state or water presence along NPRs, which some ecological studies refer to as the aquatic state (Kaletova et al., 2021).
Each of the hydrological states has its function, importance, and implications for water resource management. For instance, a flowing river will be important in increasing water availability for socioeconomic uses, directly or indirectly, by recharging groundwater (Shanafield et al., 2021) and sand aquifers (Walker et al., 2019). Flowing rivers also allow the mixing and transport/movement of biota, sediments, nutrients, etc., which are important for the ecosystem (Seaman et al., 2016; Goodrich et al., 2018). This state is also perceived to be the most valuable to society as it is deemed a reliable water source (Rodriguez-Lozano et al., 2020). When flow ceases, pools form along the river; these pools are important sources of water for communities along these rivers during the no-flow periods (Walker et al., 2019). They are also of ecological importance as they provide refuge and spawning zones for aquatic life (Makwinja et al., 2014). Although generally perceived to be less important when compared to the flowing state (Rodriguez-Lozano et al., 2020; Leigh et al., 2019), some studies suggest that this is the most important state of NPRs as it caters for both aquatic and terrestrial life (Eastman et al., 2021). Dry riverbeds are perceived to be the least valuable of all three hydrological states and are often overlooked. However, some aquatic species and riparian vegetation require a dry state to begin their life cycle (Nicolas Ruiz et al., 2021). Furthermore, some cultural activities, including spiritual rituals, can only occur on dry riverbeds (Steward et al., 2012). Dry rivers can also be sources of food and water in the form of sandbank aquifers that provide water for domestic use and irrigation. In Botswana, some communities dig the dry riverbed to harvest catfish (Steward et al., 2012). If climate change predictions of a decrease in rainfall for many parts of the world, including southern Africa (IPCC, 2022), are correct, the dry phase might become frequent for many rivers.
Knowledge of the hydrological states of NPRs is important as it informs river and water management strategies. Furthermore, each state may require a different river and water management approach.
The duration of these hydrological states, which depends on the local hydrogeology and precipitation (Bonada et al., 2020), is also key for water resource management purposes. Besides, the duration of these phases may be more important than the magnitude of the flow for the communities along these rivers. For instance, prolonged flows will allow water access for farmers for a longer period and are likely to enhance recharge of the alluvial aquifers as compared to short duration flow with high magnitude. However, prolonged flows can also mean that there is no access to alluvial aquifers, which may have better quality than a flowing river (Saveca et al., 2022). In addition, Datry et al. (2017) indicate that the biodiversity of fauna and flora can be associated with the duration of the dry phases. These hydrological states or phases have implications for the water quality of the river (Shanafield et al., 2021). For example, flow can transport pollutants from upstream, which will, in return, pollute persistent pools along the river.
There have been inadequate studies focusing on the identification of the hydrological states of NPRs, and which might be a result of a lack of data, and the complexity that arises with monitoring and in understanding NPR dynamics. Tools to objectively determine the hydrological state are required (Gallart et al., 2016; Kaletova et al., 2021). Eastman et al. (2021) used a statistical model to simulate the hydrological states along the river. The Environmental Protection Agency of England has been monitoring the hydrological states of some rivers since 1997 using field surveys (Eastman et al., 2021; Sefton et al., 2019). France also started a similar programme called Onde in 2012 (Bonada et al., 2020). Other studies have proposed the use of multiple sensors (Assendelft and Ilja van Meerveld, 2019) and time-lapse imagery from game cameras. Maswanganye et al. (2021) highlighted some of the strengths and limitations of these methods. Generally, the hydrological states are often established from gauging data and often do not recognise the 'pool' state. Direct observations of these states are the most accurate; this can be done at several parts of the river using citizen science programmes (Gallart et al. 2016).
Maswanganye et al. (2021) further suggest that hydrological states could be determined using satellite images, especially in ungauged areas that do not have a functional monitoring network.
Flow is predominantly generated from specific sections within the catchment, termed as flow-contributing areas, which bear significant relevance in water and catchment planning and management. Modifying these contributing areas can induce alterations in the hydrological regime and subsequently impact the overall hydrological state. Identification of these areas often involves in-situ observations (Tena et al., 2021) and hydrological modelling (Golmohammadi et al., 2017). Additionally, there is potential to identify these areas utilizing easily accessible remote sensing data sources. This study sought to analyse the spatiotemporal dynamics of the hydrological conditions in two NPRs while identifying significant runoff-contributing regions within the Touws and Molototsi river systems in South Africa. The objectives encompassed: (i) investigating the potential of remote sensing in ascertaining hydrological states and evaluating its accuracy in discerning between these states, (ii) assessing alterations in the hydrological states, and (iii) pinpointing primary flow-contributing zones utilizing accessible datasets. Overall, the study pioneers a new approach in analysing the hydrological dynamics of Touws and Molototsi river systems, utilizing remote sensing to discern hydrological changes and identify crucial runoff-contributing regions, addressing the research gap in adequately assessing hydrological states within South African NPRs.
METHODOLOGY
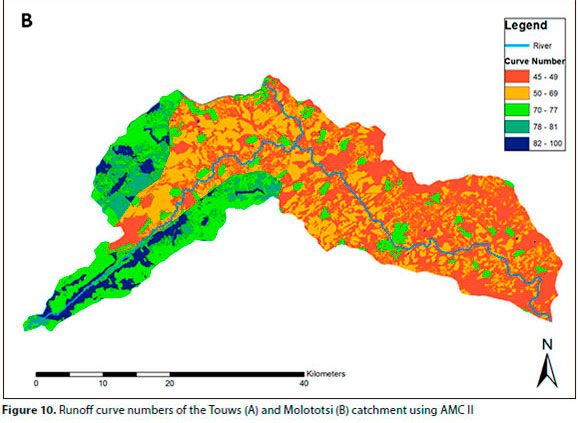
Study area
The study was conducted along Touws and Molototsi Rivers, which are distinct NPRs found in semi-arid South Africa. The Touws River is in the southern part of South Africa in the Western Cape Province (Fig. 1). Touws River has a sandy-gravel riverbed and is approximately 140 km long with a width of 60-120 m in the mid-reaches. The area is generally classified as a winter rainfall region but the rainfall at this study site shows no pattern of wet/dry seasons (Maswanganye et al., 2022a). The Touws River Catchment covers 6 280 m2 and can be divided into 12 quaternary catchments based on the Water Resources 2012 (WR2012) study (Bailey and Pitman, 2016). Flows occur in response to heavy rainfall events of ~>20 mm/day. The river flow data from the South African Department of Water and Sanitation indicated that flows have a short duration. The pools in the Touws River are semi-permanent.
The Molototsi River is in the northern part of South Africa and receives the majority of its rainfall in summer. Molototsi River catchment covers 1 170 km2, and has two quaternary catchments (WR2012) (Fig. 1). Molototsi River has a sandy riverbed, and is approximately 120 km long and 50 m wide, and is one of the tributaries of the Great Letaba River. Although there is no flow gauging station in this river, it has been observed that flow events Lend to occur during the summer period between October to February. Similar to the Touws River, the Molototsi River flows for weeks, with multiple flow events between October and March. The pools in the Molototsi River tend to dry out after winter (July). However, the river has been modified through sand mining which may be resulting in the formation of unnatural pools (Maswanganye et al., 2022a).
Data collection and analyses
In-situ monitoring ofhydrological phases
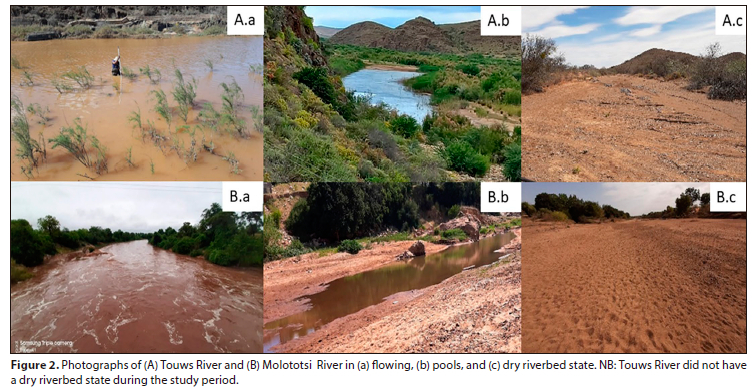
Citizen science was adopted to monitor hydrological phases for both the Touws and Molototsi River systems. Citizen scientists (farmers along the river) were observing the changes in the river; this was recorded by event, i.e., the start and end date of each state. The data used for the Touws River was also verified using water levels measured at pools and river discharge measured at the river's outlet. For the Molototsi River, water level loggers could not be installed due to the nature of the substrate and flow in the area. However, we visited the sites quarterly, targeting the observation of different seasons and hydrological states. Figure 2 shows photographs taken of the different hydrological states. In-situ data were used to evaluate the remote sensing-derived hydrological state.
Remote sensing data
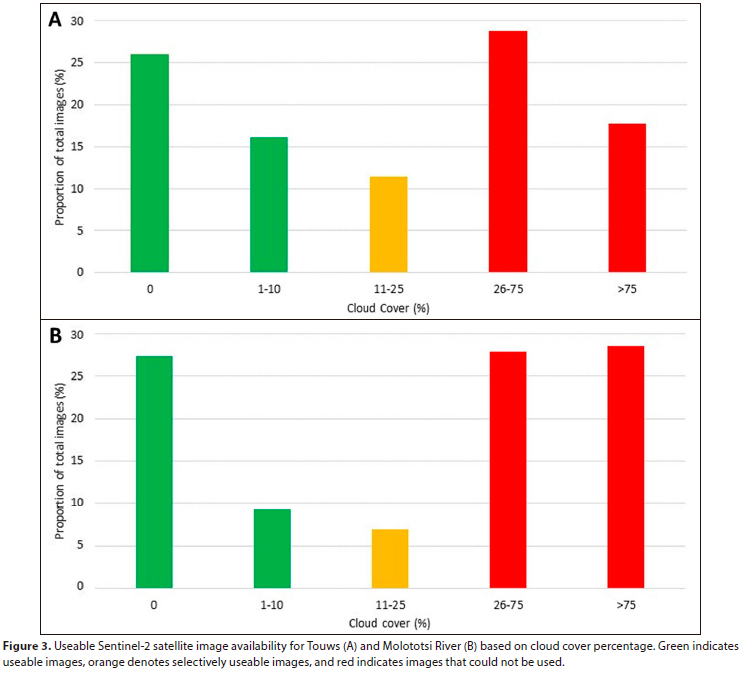
Sentinel-2 images were used to determine the hydrological state of the rivers. About 100 images per site were used (July 2019 to March 2022). This was based on the availability of the images, as some were not useable due to cloud cover (Fig. 3). Sentinel-1 was used to determine if it could detect some of the flow events that Sentinel-2 could have missed. Sentinel-1 is a synthetic aperture radar (SAR) satellite, capable of penetrating through clouds. Sentinel-1 and 2 were selected as they are open, freely accessible, and have a relatively high temporal and spatial resolution (5 days, 10 m). Sentinel-2 images were downloaded from the USGS EarthFxplorer (http://earthcxplorer.usgs.gov/), and Sentinel-1 images were downloaded from the National Aeronautics and Space Administration Alaska Satellite Facility (NASA/ASF) (https://search.asf.alaska.edu/#/). Detailed descriptions of Sentinel-1 and 2 can be found in Maswanganye et al. (2022a).
Rainfall: CHIRPS data
The rainfall data collected through the citizen science programme were not adequately distributed in order to capture the spatial variation of rainfall over the catchment. Hence, Climate Hazards InfraRed Precipitation with Stations (CHIRPS) data, as described by Funk et al. (2015), was used to determine the spatial distribution of rainfall for the catchments. The data were downloaded through the climate engine website (https://app.climatcengine.com/climateEngine#) for the time series and at (https://data.chc.ucsb.edU/products/CHIRPS-2.0/africa_daily/lifs/p05/) for the raster files. Various studies have shown that CHIRPS data has adequate accuracy in South Africa (Du Plessis and Kibii, 2021; Maswanganye, 2018).
Detection of hydrological phases
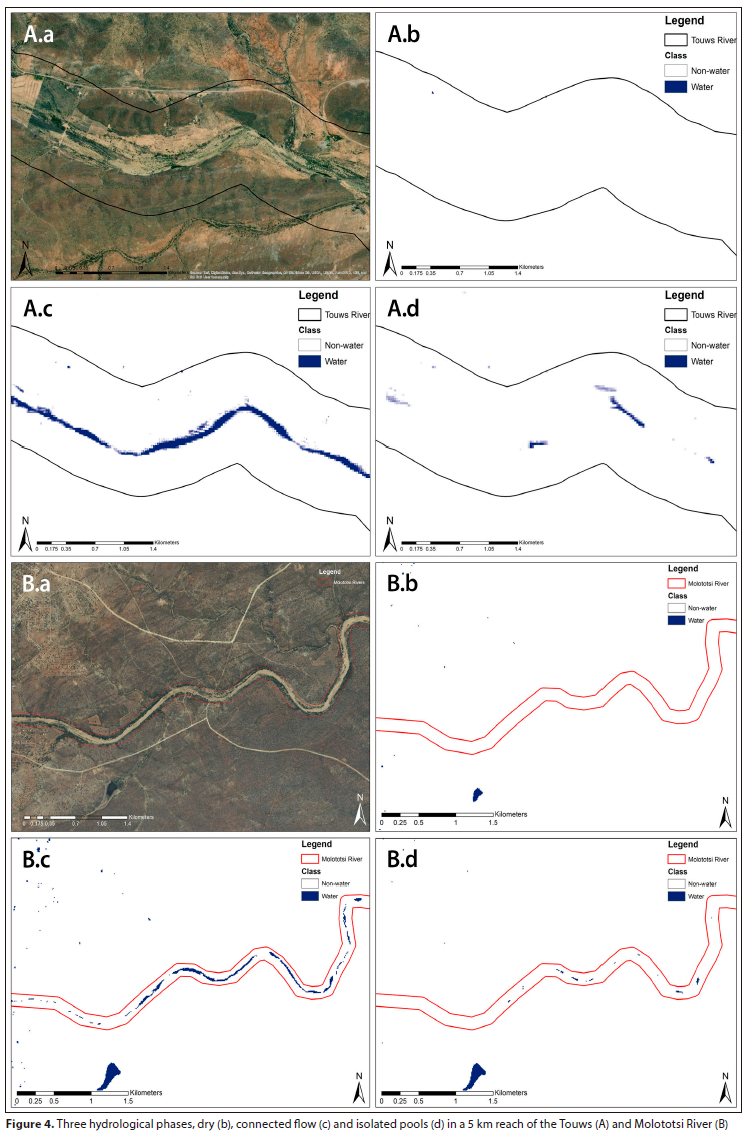
The selection of the monitoring reach was representative of the river and had to be accessible. Hence, the selected sites are within the dominant geology and soil types of the catchment. These sites are also located within the average slope (2.6 m/km for the Molototsi River and 3.7 m/km for the Touws River) of the river. The study used the remote sensing technique to determine hydrological phases. These were monitored in a selected 5 km reach of the river. The Modified Normalised Difference Water Index (MNDWI) was used to extract water pixels from Sentinel-2 images, as Maswanganye et al. (2022a) showed that it was superior compared to other methods that were assessed in these study sites. For Sentinel-1, the thresholding method was used to separate water from non-water pixels. Connected surface water meant that the river was flowing. However, because the rivers meander and can tend to be flowing in a small part of the channel, detection can be challenged by the lack of cloud-free images during peak flow; a threshold of 50% or 2.5 km of the 5 km reach was therefore used. This means that if the reach has 2.5 km or more with water it was assumed that there was flow. Surface water presence of less than 2.5 km was labelled as 'pool', and when no water pixel was detected it was labelled as dry riverbed. The length of water along the selected reach was determined using spatial analyst tools in a GIS environment. Figure 4 illustrates an example of the different hydrological states of the Touws and Molototsi Rivers, respectively.
Identification of flow-contribution areas
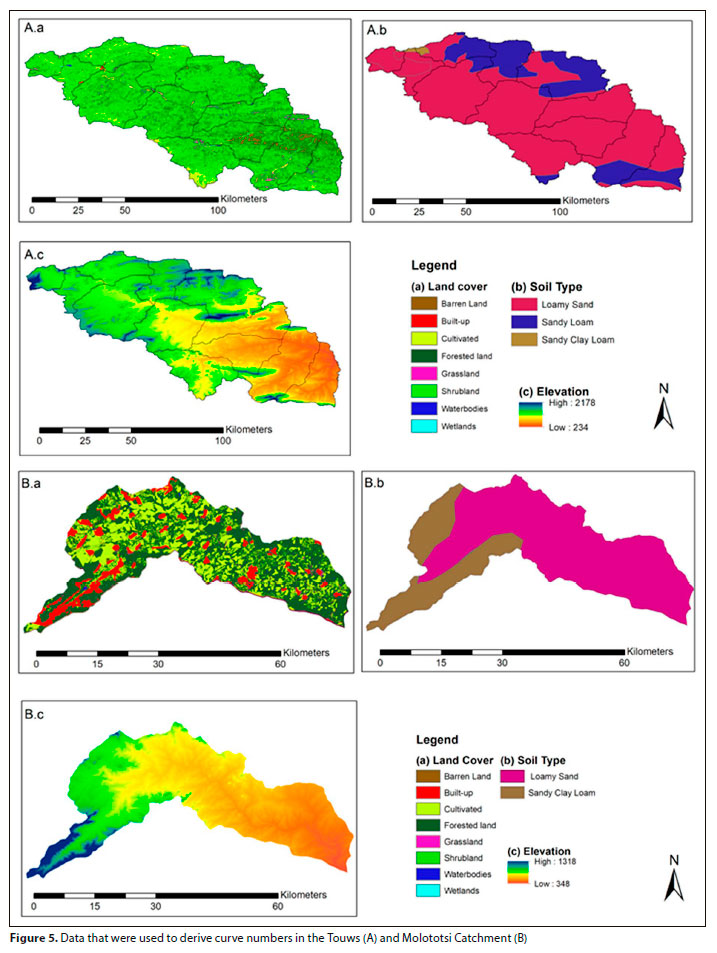
Usually, the identification of flow-contributing areas is done using observed data from the tributary outlet (Tena et al., 2021); however, rainfall and physical characteristics (soil type, slope and land use and cover) can be used in the absence of the flow data. Several methods can be used to determine the contributing area, mainly proxies such as the Soil Conservation Service (SCS) Curve Number method and the runoff coefficients. In this study, remote sensing derived rainfall was used to determine areas where rainfall occurred to produce observed flows (antecedent rainfall). The SCS curve number method was used to determine which parts of the catchment are likely to generate runoff based on the physical characteristics (soil, elevation and land cover). The curve number (value) is allocated to each cell which is a proxy of the amount of rainfall that will be required before a cell/pixel can generate overland runoff. The curve number ranges between 0 and 100, with zero indicating that no runoff can be generated and 100 indicating that a cell will generate the maximum possible runoff. USDA (1986) provides a detailed description of the curve number method. This is the most popular method for estimating direct runoff (Gajbhiye, 2015) and uses data that can easily be obtained, even in data-scarce areas. Soil types were obtained from the WRC Water Resources 2012 website (https://waterresourceswr2012.co.za/) (Fig. 5). The 2020 South African National Land Cover (SANLC) (https://egis.environment.gov.za/) was used for land cover and land use. For topography, Shuttle Radar Topography Mission (SRTM) 1 arc-second global digital elevation model (DEM) was used, available at the USGS website (https://earthexplorer.usgs.gov/).
Evaluation metrics
Overall, producer's and user's accuracy metrics described in Liu (2007) were used to assess the ability of remote sensing to distinguish between the dry riverbeds, pools and flowing states of the rivers. Flow occurrence is of importance for NPRs; for instance, it is important to know how many flow events are likely to be missed by the satellite (Sentinel-2) observation. Hence this study calculates this chance:
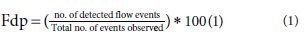
where: Fdp is the flow occurrence detection power (%), with 0% being the worst score and 100% being the perfect score.
The study further investigated whether using Sentinel-1 improves the detection of flow events, as well as the effect that the duration of flow events has on the ability of remote sensing to detect the flow events.
RESULTS
Detection of hydrological phases in the Touws and Molototsi River
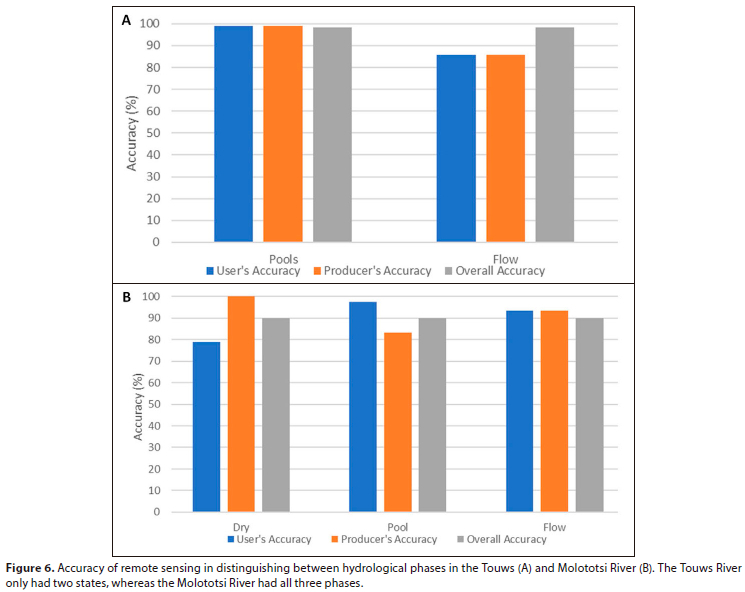
Remote sensing methods were able to detect and distinguish the hydrological phases of the selected NPRs; the accuracy varied between the two sites. In the Touws River, only pools and flow phases were detected and observed, and the river did not dry up during the study period (Fig. 6A). In Touws River, the presence of pools was better detected (users and producer's accuracy = 99%) compared to flow (UA and PA = 86%). High accuracies were also obtained for all hydrological states in the Molototsi River (OA = 90%); however, the dry phase had the lowest producer accuracy (78%), and the flow phase was better detected (UA and PA = 93%) (Fig. 6B). The Sentinel-2 datahad 70% flow detection power (Eq. 1) in Molototsi River, suggesting that there is a 30% chance that a flow event can be missed due to cloud cover. The detection power was 65% for the Touws River. Overall, pools were the dominant phase for both rivers; the Touws Rivers pool did not dry out during the study period. Because of the two phases observed, the Touws River hydrological phases were detected better than for the Molototsi River. Furthermore, the Molototsi River had a few pool phases that were misclassified and confused with the dry phases (Fig. 6B). On only one occasion flow occurrence was misclassified as the pool phase.
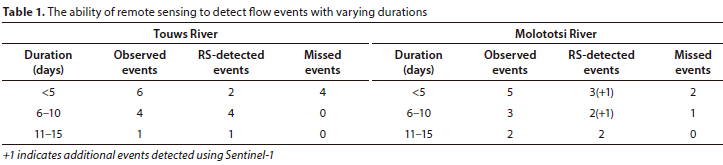
Sentinel-1 was able to detect 2 of the 3 events missed by Sentinel-2 in Molototsi River, improving the flow phase detection by 20% (Table 1). However, it was not able to detect any of the events missed in Touws River. It even failed to detect some of the flow events detected by Sentinel-2. Sentinel-1B faced challenges in 2021, resulting in the images being unavailable. The short-duration flow events tend to be difficult to detect using remote sensing as 83% of the missed events had a duration of less than 5 days (Table 1), which is problematic as most NPRs have a short flow duration.
Temporal dynamics of hydrological phases
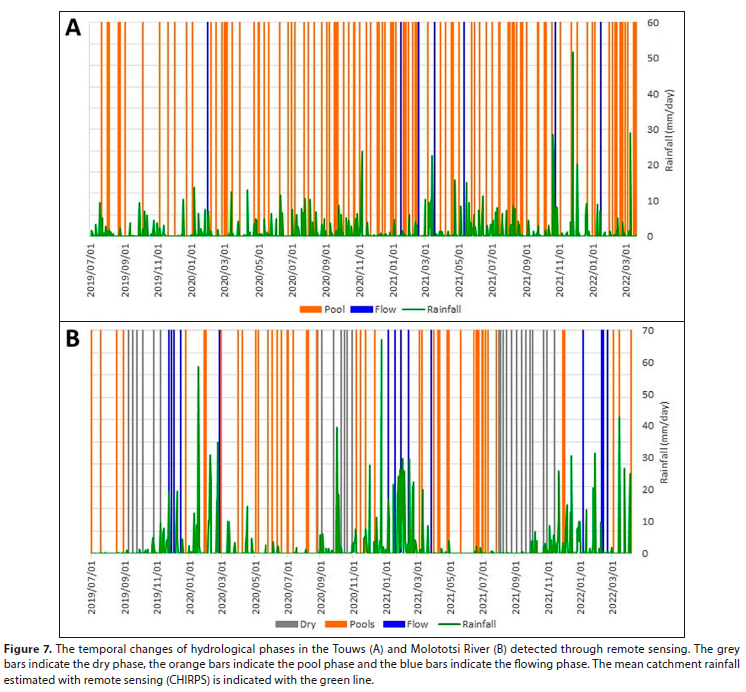
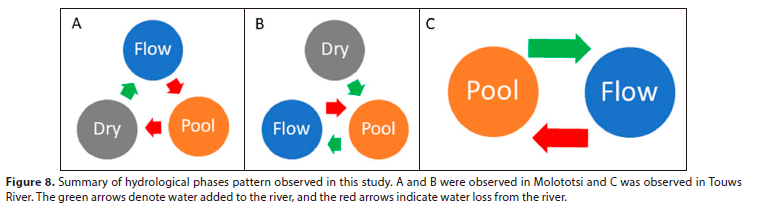
NPRs are known to be highly dynamic, and flow events are difficult to predict. Touws River hydrological phases are less dynamic but showed no seasonal patlern (Fig. 7A). Although Molototsi River is more dynamic in terms of changes between the phases, it is however seasonal. Flow usually occurs during the Southern Hemisphere summer (December to February); this is then followed by pools occurring from autumn into winter (March to August), after which dry riverbed tends to be dominant from August to November (Fig. 7B). The changes in hydrological phases can be associated well with the catchment rainfall patterns. The changes in hydrological phases did not correlate well with rainfall in the Touws catchment. There were events that could not be explained using mean rainfall patterns. The general cycle is usually 'dry' to 'flow' to 'pools'; there is a rare pattern of the river being 'dry' to 'pools' to 'flows' illustrated in Fig. 8B, and Touws River only had two phases (Fig. 8C). Comparing the two catchments, Molototsi River flows are more frequent and tend to last longer than in the Touws River.
Flow-contributing area in the Touws and Molototsi River
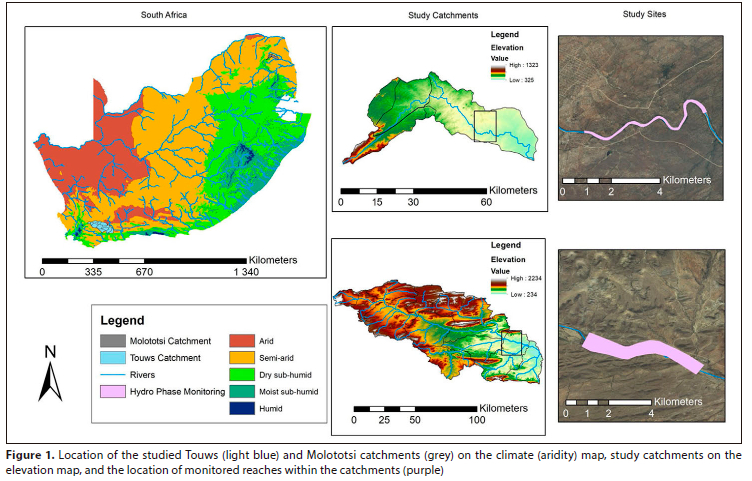
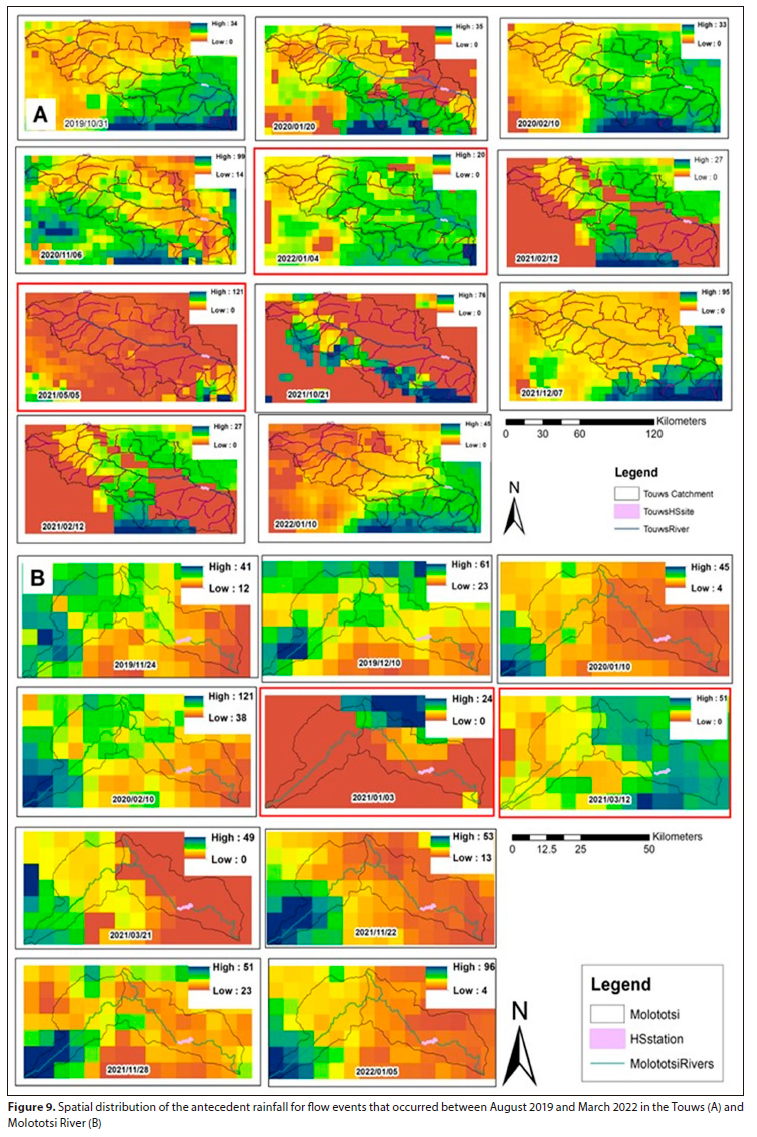
The spatial distribution of rainfall that results in flows in the Touws River suggests that the southwestern part of the catchment (Quaternary catchment J12J) tends to receive more rainfall (Fig. 9A). This further suggests that this area may be generating most of the runoff observed in the river. However, there are cases where rainfall was received elsewhere (shown using red frame in Fig. 9A). The rainfall distribution suggests that there are also flow events that may have occurred in the mid to lower parts of the catchment but did not occur upstream of the river (Fig. 9A). The highest 5-day antecedent rainfall (i.e., total rainfall preceding the flow event) observed was -120 mm and the lowest was 20 mm.
In the Molototsi River, rainfall leading to the majority of the flow events tends to occur in the upper catchment (B81G) (Fig. 9B). There were events where rainfall occurs in the mid-catchment (shown using red frame in Fig. 9B). The locals suggested that the flows originating from the upper catchment (Modjadjiskloof) area tend to last longer compared to other parts of the catchment. The highest antecedent rainfall observed for the Molototsi catchment was -96 mm and the lowest was 24 mm. However, receiving the highest rainfall sometimes does not result in any runoff being generated and/or observed; the physical characteristics (soil type, slope, and land use and cover) of the catchment have a significant role to play in this regard.
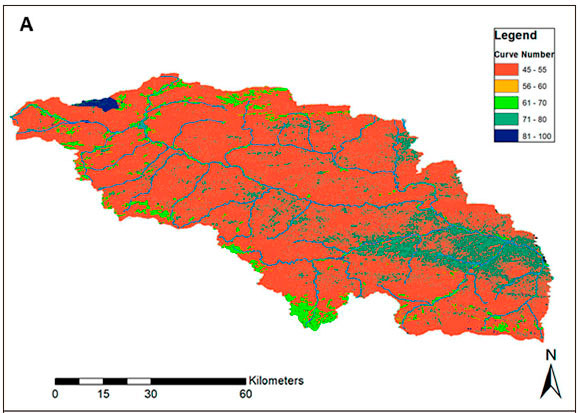
Curve number method
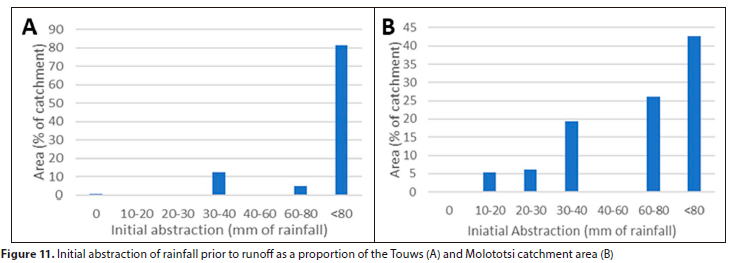
To take into consideration the physical characteristics of the catchment, the SCS curve number (CN) was used to determine contribution areas. Due to the small variation in soil types and land cover in the Touws catchment, the area is also generally flat and the curve numbers showed low variation, indicating that runoff produced in the catchment is mainly controlled by the spatial distribution of rainfall. The area where most of the antecedent rainfall occurs (Fig. 9A) is also one of the areas with a high probability of producing runoff (CN > 61) (Fig. 10A). The upper parts of the Molototsi catchment have higher curve numbers (>78), implying that it is likely to produce more runoff than the lower parts (B81G) (Fig. 10B). The area also tends to receive more rainfall and have steeper slopes. Comparing the two catchments, the curve number method suggests that the Molototsi catchment has a greater probability of producing runoff (Fig. 11), and generally receives more antecedent rainfall. The estimated initial abstraction derived through the curve number method is similar to the estimated antecedent rainfall (remotel sensing estimated) for the Molototsi catchment, which indicates that some parts of the catchment can potentially start to generate runoff from receiving as little as 10-20 mm of rainfall (Fig. 11), whereas the Touws catchment can potentially generate runoff from 20-30 mm of rain. Touws catchment is also generally flatter when compared to Molototsi catchment.
DISCUSSION
Non-perennial rivers are highly dynamic, switching between different hydrological phases. Remote sensing was used to detect these phases and the results showed that this approach has the ability to distinguish between the hydrological phases, although the detection of the transition between the phases, especially from pools to dry, seems to be a slight challenge for remote sensing. This might be caused by the pools becoming too small to be detected at satellite spatial resolution, as Maswanganye et al. (2022a) suggested that it is a challenge to detect pools of less than 400 m2
The remote sensing performance was better in Touws River than in Molototsi River. This might be because: (i) the Touws River only had two phases, (ii) the pools in the Touws River tend to be bigger than those found in Molototsi River, as observed by Maswanganye et al. (2022a), allowing for easier detection. This suggests that the method used might not be applicable in rivers with a small width (<40 m). Molototsi River phases were more dynamic. The findings of this study, in terms of the persistence of the pools in both catchments, are in line with the findings of Maswanganye et al. (2022a), which suggested that the pools are permanent to semi-permanent in the Touws River and ephemeral in the Molototsi River.
The Touws River was shown to have less clouds but they persisted when flows occurred, resulting in some flow events being missed, whereas the flow in Molototsi River tends to be more persistent allowing more time for the capturing of cloud-free images. The missed flow events by Sentinel-2 were of shorter duration (<5 days). This study used Sentinel-1 to try to overcome these issues. Although Sentinel-1 had poor detection of pools (Maswanganye et al., 2022a), it was able to detect 2 of 3 flow events missed due to cloudy images in the Molototsi River; however, it was unsuccessful in the Touws River. Seaton and Dube (2021) suggested that this is due to the flat and arid landscapes creating similar backscatter to water, resulting in difficulty in the separation of water and the surrounding areas. Using Sentinel-2 and Sentinel-1, andincluding other remote sensing data from various satellites, can improve the temporal resolution, hence giving it the potential to estimate the duration of the flow events.
In both catchments, the pool phase is dominant. This is expected for arid and semi-arid rivers (Bonada et al., 2020), and means that people will have access to pools for recreational purposes and domestic use (i.e., swimming and doing laundry). The flow events showed no seasonality in the Touws River and generally had a shorter duration compared to the Molototsi River. This might be as a result of the Molototsi receiving more rainfall and having a better probability of generating runoff based on the physical characteristics of the area (i.e., soil types, land cover, etc.), according to the curve number method. These flows are important for communities living along the river as they might also recharge the sand/alluvial aquifer, which provides water for domestic use (Walker et al., 2018, 2019). These flows are also a major control for pool occurrence along the river. For instance, Maswanganye et al. (2022b) estimated that it would take around 258 days for one of the pools along the Touws River to dry out if river flow does not occur.
The analysis of major flow-contributing areas for the Touws River suggests that the site or reach used in this study did not capture the hydrological states of the upper stream well, as much of the runoff was generated in the mid-catchment; therefore, there is a need to use multiply sites when determining the hydrological state to provide a good representation of the river. This can be located in between the major confluences of the main river. This can be easily done through remote sensing but might be timely and laborious for direct observation. The minimum antecedent rainfall was estimated to be 20 and 24 mm in the Touws and Molototsi catchments, respectively. However, the spatial coverage of the antecedent rainfall is also important. The Touws catchment is drier compared to the Molototsi catchment, as it receives less rainfall. The runoff curve numbers further suggest that the Molototsi catchment has a better probability of generating runoff than the Touws catchment.
CONCLUSION
The findings in this study shed light on the limited exploration of hydrological states within non-perennial rivers, aiming to delineate their spatiotemporal dynamics and understand their flow-contributing areas. While the adopted remote sensing metho d effectively discerned among the three hydrological phases under clear-sky conditions, it encountered challenges in detecting rapid flows in Touws River and small pools in Molototsi River due to temporal resolution limitations. Despite these constraints, remote sensing displayed significant potential, suggesting its broader applicability across various spatial scales. Molototsi River exhibited a predictable seasonal pattern in hydrological states linked to rainfall, while Touws River displayed an irregular pattern aligned with its erratic rainfall. The prevalence of the pool state was notable in both rivers. Analysing the spatial distribution of rainfall to identify flow-contributing areas, coupled with the curve number method, provided promising insights into catchment-scale flow thresholds, offering mutually reinforcing perspectives. Emphasizing the protection of flow-contributing areas is paramount for safeguarding water resources and sustaining river hydrology and flow patterns. Leveraging remote sensing and GIS methodologies proves beneficial in identifying these pivotal flow-contributing zones. Looking ahead, the increasing accessibility of high-resolution satellite technology presents an opportunity to further refine the understanding of hydrological states in non-perennial rivers, offering vital insights unattainable through traditional in-situ measurements. This reservoir of information holds paramount importance for water resource management and catchment planning.
ACKNOWLEDGEMENTS
We would like to appreciate the Water Research Commission of South Africa for funding this project (K5/2936) and the University of the Western Cape for providing us with the opportunity to do this work.
REFERENCES
ASSENDELFT RS and ILIA VAN MEERVELD HJ (2019) A low-cost, multi-sensor system to monitor temporary stream dynamics in mountainous headwater catchments. Sensors 19 (21). https://doi.org/10.3390/sl9214645 [ Links ]
BONADA N, CANEDO-ARGUELLES M, GALLART F, VON SCHILLER D, FORTUNO P, LATRON J, LLORENS P, MÚRRIA G SORIA M, VINYOLES D and co-authors (2020) Conservation and management of isolated pools in temporary rivers. Water 12 (10) 1-24. https://doi.org/10.3390/wl2102870 [ Links ]
DATRY T, BONADA N and BOULTON AJ (2017) Intermittent Rivers and Ephemeral Streams: Ecology and Management. Academic Press. London. 597 pp. https://doi.org/10.1016/C2015-0-00459-2 [ Links ]
DE GIROLAMO AM, LO PORTO A, PAPPAGALLO G, TZORAKI O and GALLART F (2015) The hydrological status concept: application at a temporary river (Candelaro, Italy) River Res. Appl. 31 (7) 892-903. https://doi.org/10.1002/RRA.2786 [ Links ]
DU PLESSIS K and KIBII J (2021) Applicability of CHIRPS-based satellite rainfall estimates for South Africa, J. S. Afr. Inst. Civ. Eng. 63 (3) 43-54. https://doi.org/10.17159/2309-8775/2021/v63n3a4 [ Links ]
EASTMAN M, PARRY S, SEFTON C, PARK J and ENGLAND J (2021) Reconstructing spatiotemporal dynamics in hydrological state along intermittent rivers. Water 13 (4) 1-22. https://doi.org/10.3390/W13040493 [ Links ]
FUNK C, PETERSON P, LANDSFELD M, PEDREROS D, VERDIN J, SHUKLA S, HUSAK G, ROWLAND J, HARRISON L, HOELL A and co-authors (2015) The climate hazards infrared precipitation with stations-a new environmental record for monitoring extremes. Sci. Data! 150066. https://doi.org/10.1038/sdata.2015.66 [ Links ]
GAJBHIYE S (2015) Estimation of surface runoff using remote sensing and geographical information system. Int. J. u- e-Service Sci. Technol. 8 (4) 113-122. https://doi.Org/10.14257/ijunesst.2015.8.4.12 [ Links ]
GALLART F, LLORENS P, LATRON J, CID N, RIERADEVALL M and PRAT N (2016) Validating alternative methodologies to estimate the regime of temporary rivers when flow data are unavailable. Sci. Total Environ. 565 1001-1010. https://doi.Org/10.1016/j.scitotenv.2016.05.116 [ Links ]
GOLMOHAMMADI G, RUDRA R, DICKINSON T, GOEL P and VELIZ M (2017) Predicting the temporal variation of flow contributing areas using SWAT. J. Hydrol. 547 375-386. https://doi.org/10.1016/j.jhydrol.2017.02.008 [ Links ]
GOODRICH DC, KEPNER WG, LEVICK LR and WIGINGTON PJ (2018) Southwestern intermittent and ephemeral stream connectivity, J. Am. Water Resour. Ass. 54 (2) 400-422. https://doi.org/10.1111/1752-1688.12636 [ Links ]
IPCC (Intergovernmental Panel on Climate Change) (2022) Impacts of 1.5°C global warming on natural and human systems. In: Global Warming of 1.5°C: IPCC Special Report on lmpacts of Global Warming of 1.5°C above Pre-Industrial Levels in Context of Strengthening Response to Climate Change, Sustainable Development, and Efforts to Eradicate Poverty. Cambridge University Press, Cambridge. 175-312. https://doi.org/10.1017/9781009157940.005 [ Links ]
KALETOVA T, RODRIGUEZ-LOZANO P, BERGER E, FILIPA FILIPE A, LOGAR I, HELENA ALVES M, CALLEJA EJ and JORDA-CAPDEVILA D (2021) Considering temporal flow variability of non-perennial rivers in assessing ecosystem service provision. Ecosyst. Services 52 101368. https://doi.Org/10.1016/j.ecoser.2021.101368 [ Links ]
LEIGH C, BOERSMA KS, GALATOWITSCH ML, MILNER VS and STUBBINGTON R (2019) Are all rivers equal? The role of education in attitudes towards temporary and perennial rivers. People Nat. (October 2018) 181-190. https://doi.org/10.1002/pan3.22 [ Links ]
MAKWINJA R, CHAPOTERA M, LIKONGWE P, BANDA J and CHIJERE A (2014) Location and roles of deep pools in likangala river during 2012 recession period of Lake Chilwa basin. Int. J. Ecol. 2014.https://doi.org/10.1155/2014/294683 [ Links ]
MASWANGANYE SE, DUBE T, JOVANOVIC N and MAZVIMAVI D (2022a) Use of multi-source remotely sensed data in monitoring the spatial distribution of pools and pool dynamics along non-perennial rivers in semi-arid environments, South Africa. Geocarto Int. 37 (25) 10970-10989. https://doi.org/10.1080/10106049.2022.2043453 [ Links ]
MASWANGANYE S E, DUBE T, MAZVIMAVI D and JOVANOVIC N (2021) Remotely sensed applications in monitoring the spatio-temporal dynamics of pools and flows along non-perennial rivers: a review. S. Afr. Geogr. J. 104 (4) 427-445. https://doi.org/10.1080/03736245.2021.1967774 [ Links ]
MASWANGANYE SE, DUBE T, JOVANOVIC N, KAPANGAZIWIRI E and MAZVIMAVI D (2022b) Using the water balance approach to understand pool dynamics along non-perennial rivers in the semi-arid areas of South Africa, J. Hydrol. Reg. Stud. 44 101244. https://doi.org/10.1016/j.ejrh.2022.101244 [ Links ]
MASWANGANYE SE (2018) A comparison of remotely-sensed precipitation estimates with observed data from rain gauges in the Western Cape , South Africa. MSc thesis, University of the Western Cape. URL: https://etd.uwc.ac.za/handle/11394/6199 (Accessed 20 January 2024). [ Links ]
NICOLAS RUIZ N, SUÁREZ ALONSO ML and VIDAL-ABARCA MR (2021) Contributions of dry rivers to human well-being: A global review for future research. Ecosyst. Services 50. https://doi.org/10.1016/j.ecoser.2021.101307 [ Links ]
RODRlGUEZ-LOZANO P, WOELFLE-ERSKINE C, BOGAN MT and CARLSON SM (2020) Are non-perennial rivers considered as valuable and worthy of conservation as perennial rivers? Sustainability 12 (14) 1-12. https://doi.org/10.3390/sul2145782 [ Links ]
SAVECA PSL, ABI A, STIGTER TY, LUKAS E and FOURIE F (2022) Assessing groundwater dynamics and hydrological processes in the sand river deposits of the Limpopo River, Mozambique. Front. Water 3 (March) 1-21. https://doi.org/10.3389/frwa.2021.731642 [ Links ]
SEAMAN M, WATSON M, AVENANT M, KING J, JOUBERT A, BARKER C, ESTERHUYSE S, GRAHAM D, KEMP M, LE ROUX P and co-authors (2016) DRIFT-ARID: A method for assessing environmental water requirements (EWRs) for non-perennial rivers. Water SA 42 (3) 356-367. https://doi.org/10.4314/wsa.v42i3.01 [ Links ]
SEATON D and DUBE T (2021) A new modified spatial approach for monitoring non-perennial river water availability using remote sensing in the Tankwa Karoo, Western Cape, South Africa. Water SA 47 (3) 338-346. https://doi.org/10.17159/wsa/2021.v47.i3.11862 [ Links ]
SEFTON CEM, PARRY S, ENGLAND J and ANGELL G (2019) Visualising and quantifying the variability of hydrological state in intermittent rivers. Fundamental Appl. Limnol. 193 (1) 21-38. https://doi.org/10.1127/fal/2019/1149 [ Links ]
SHANAFIELD M, BOURKE SA, ZIMMER MA and COSTIGAN KH (2021) An overview of the hydrology of non-perennial rivers and streams. WIREs Water 8 (2) el504. https://doi.org/10.1002/wat2.1504 [ Links ]
STEWARD AL, VON SCHILLER D, TOCKNER K, MARSHALL JC and BUNN SE (2012) When the river runs dry: Human and ecological values of dry riverbeds. Front. Ecol. Environ. 10 (4) 202-209. https://doi.org/10.1890/110136 [ Links ]
TENA TM, MUDENDA F, NGUVULU A, MWAANGA P and GATHENYA JM (2021) Analysis of river tributaries' streamflow contribution using WEAP model: a case of the Ngwerere and Kanakatampa tributaries to the Chongwe River in Zambia. J. Water Resour. Protect. 13 (04) 309-323. https://doi.org/10.4236/jwarp.2021.134019 [ Links ]
WALKER D, JOVANOVIC N, BUGAN R, ABIYE T, DU PREEZ D, PARKIN G and GOWING J (2018) Alluvial aquifer characterisation and resource assessment of the Molototsi sand river, Limpopo, South Africa. J.Hydrol. Reg. Stud. 19 (April) 177-192. https://doi.org/10.1016/j.ejrh.2018.09.002 [ Links ]
WALKER D, SMIGAJ M and JOVANOVIC N (2019) Ephemera] sand river flow detection using satellite optical remote sensing. J. Arid Environ. 168 (June 2020) 17-25. https://doi.org/10.1016/j.jaridenv.2019.05.006 [ Links ]
 Correspondence:
Sagwati E Maswanganye
Email: 3031049@myuwc.ac.za
Received: 18 January 2023
Accepted: 20 January 2024

