


Services on Demand
Article
 English (pdf)
 Article in xml format
 Article references
Indicators

Related links
-
 Cited by Google
 -
 Similars in Google
Share

 Permalink
Water SA
On-line version ISSN 1816-7950
Print version ISSN 0378-4738
Water SA vol.49 n.4 Pretoria Oct. 2023
http://dx.doi.org/10.17159/wsa/2023.v49.i4.4032
RESEARCH PAPER
Effect of water stratification and mixing on phytoplankton functional groups: a case study of Xikeng Reservoir, China
Yunhao BaiI, II; Tinglin HuangI, II; Pengcheng YangI, II
IKey Laboratory of Northwest Water Resource, Environment and Ecology, MOE, Xi'an University of Architecture and Technology, Xi'an 710055, China
IIShaanxi Key Laboratory of Environmental Engineering, Xi'an University of Architecture and Technology, Xi'an 710055, China
ABSTRACT
A shift in reservoir stratification and mixing significantly affects the water column ecosystem, which in turn leads to changes in phytoplankton abundance and community structure. To explore the effects of stratification and mixing on the phytoplankton community structure of a diversion reservoir, a 1-year survey was divided into a stratification period in 2020, a mixing period in 2020, and a stratification period in 2021, and redundancy analysis (RDA), variance partitioning analysis (VPA) and Pearson correlation analysis were used to analyse the key drivers affecting the phytoplankton functional groups, using Xikeng Reservoir as a case study. During the study period, 8 phyla, 69 genera and 9 major functional groups were observed in this reservoir. The dominant functional groups varied significantly, being X1 in the stratified period in 2020; P and D in the mixing period in 2020; and D, X1, and M in the stratified period in 2021. The phytoplankton diversity index was greater in the mixing period than in the stratification period, in agreement with the results of the aquatic ecological status evaluation (Q index, higher in the mixing period than in the stratification period). However, phytoplankton diversity of Xikeng Reservoir was of limited value in assessing the degree of water pollution, so should be considered in combination with the Q index. Water temperature (WT), mixing depth (Zmix), nitrogen-phosphorus ratio (N/P), and total nitrogen (TN) were important drivers of phytoplankton functional group dynamics in different periods. The study provides a valuable reference for assessing the relationship between environmental factors and phytoplankton communities, as well as for the evaluation and conservation of aquatic ecosystems in southern China's water diversion reservoirs.
Keywords: south tropical, diversion reservoir, stratification and mixing, phytoplankton functional groups, driving factors, water ecological evaluation
INTRODUCTION
Phytoplankton plays a crucial role as a primary producer in aquatic ecosystems and is essential for maintaining the dynamic balance of food webs, energy flow, and nutrient cycling (Gogoi et al., 2021; Yuan et al., 2018; Zhang et al., 2020). The dominant species, diversity, and composition of phytoplankton communities are indicators of the aquatic environment, and these communities are also influenced by environmental factors (Rolland et al., 2009). The growth and reproduction of phytoplankton in aquatic ecosystems are mainly influenced by environmental factors such as light, nutrient concentrations, water temperature, pH, zooplankton predation, and hydrodynamics (Siegel et al., 2013; Deng et al., 2017; Jakobsen et al., 2015; Silva et al., 2014; Becker et al., 2010).
Traditional studies on phytoplankton communities have largely focused on systematic taxonomy, which has limitations in predicting the community structure and providing information about the biological and habitat characteristics of phytoplankton in aquatic ecosystems (Kim et al., 2020). To address this problem, Reynolds et al. (2002) introduced a functional group classification based on morphological traits and ecological adaptations of phytoplankton to better reflect changes in the aquatic environment (Sun and Wang, 2021; Reynolds et al., 2002). However, most research on phytoplankton functional groups has concentrated on natural or seasonal succession (Fu et al., 2020; Jia et al., 2020; Jiang et al., 2014). In contrast, the indistinct seasons of reservoirs in southern China, which are characterized by long summers and short or no winters, according to the Chinese national standard of division of climatic seasons, result in fewer samples in winter. Therefore, multi-year, high-frequency monitoring is often required to accurately capture the seasonal characteristics of phytoplankton.
To compensate for the shortcoming, the 1-year survey undertaken in this study was divided into different periods based on the water column's stratification and mixing status. As environmental conditions can vary between years, the study period was separated into the 2020 stratification period, the 2020 mixing period, and the 2021 stratification period. Previous studies on the effects of water stratification and mixing on phytoplankton functional groups are relatively scarce and outdated. Besides, water mixing regimes play a critical role in phytoplankton succession, and it is essential to study their effects on functional group structure and the driving factors. The objectives of this current study were to (i) investigate the effects of water mixing and stratification on the functional phytoplankton community, (ii) explore the response of phytoplankton diversity to water mixing and stratification, and (iii) to elucidate the relationship between functional communities and environmental factors or the driving factors. This study highlighted the effects of stratification and mixing on phytoplankton and provided a reference for the ecological protection of subtropical reservoirs in China.
MATERIALS AND METHODS
Study area
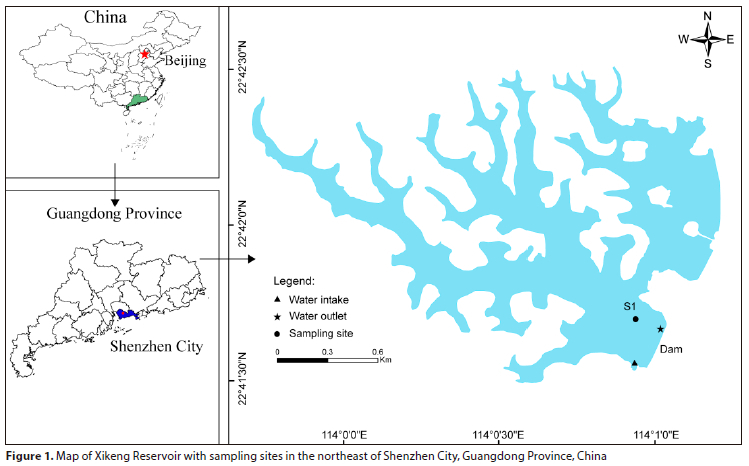
Xikeng Reservoir (113o59,30"-114°1,20" E, 22°41,20"-22°42,40" N) (Fig. 1) in Shenzhen, Guangdong Province, China, is a significant source of drinking water for the Pearl River Delta, and it is vital to the socioeconomic growth of the Guangdong-Hong Kong-Macao Greater Bay Area. It is situated in the South Subtropical Zone and is characterized as a warm and mono-mictic water body with a subtropical marine monsoon climate. The reservoir has a basin area of 5.0 km2 and a water area of 2.0 km2, with a normal storage level of 75.0 m, maximum water depth of 22.0 m, and normal storage capacity of 1.8 x 10⁷ m3. The climate is mild throughout the year, with an average annual temperature of 23.0°C. Rainfall is abundant but varies significantly from year to year, with more than 80% of the annual rainfall concentrated within the period from April to September.
Sampling and sample analysis
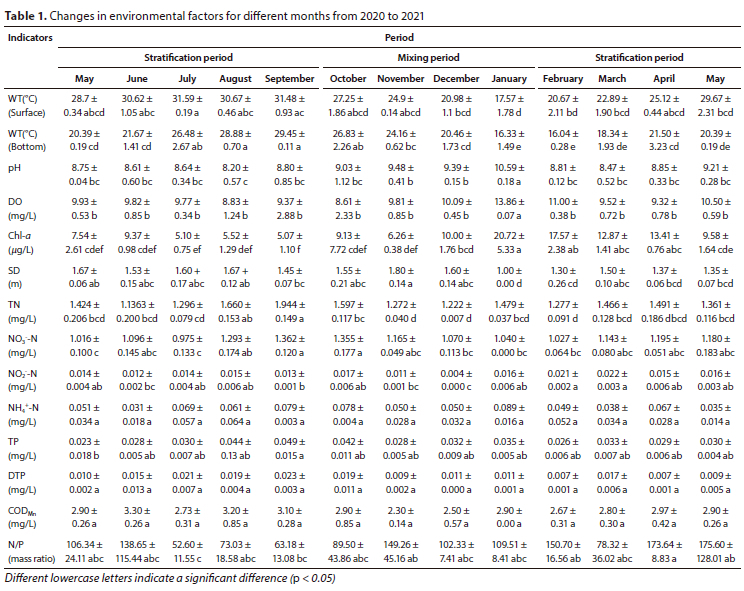
In this study, Point S1, which is the deepest point, was chosen as the monitoring point (Noori et al., 2021) (Fig. 1). Field observations were conducted at the S1 site 3 times per month for a period of 13 months from May 2020 to May 2021. Table 1 shows the means and standard deviations of the environmental factors measured at a depth of 0.5 m below the surface layer, with the exception of the bottom water temperature.
Phytoplankton collection and analysis
Surface phytoplankton samples were collected and processed for analysis. The qualitative phytoplankton samples for identifying algal species were collected with a 64 µm pore size net. One litre of water sample was treated with 15 mL of Lugol's iodine solution in situ, transported to the laboratory, and allowed to settle for 48 h. The sample was then concentrated to 30 mL and examined for phytoplankton identification and enumeration using a 400x light microscope with a 0.1 mL counting box containing 100 horizons based on the Chinese Freshwater Algae-System, Classification and Ecology (Wen et al., 2022). The functional grouping of phytoplankton communities was determined using the functional group classification method developed by Reynolds (Reynolds et al., 2002) and Padisák (Padisák et al., 2006).
Environmental factors
In this study, surface water samples were collected and analysed for various water quality parameters. Unfiltered surface water samples were used to analyse total nitrogen (TN), total phosphorus (TP), and permanganate index (CODMn), which were measured by the alkaline potassium persulfate digestion UV spectrophotometric method, ammonium molybdate spectrophotometric method, and acidic potassium permanganate method, respectively. Filtered samples, which passed through 0.45 |im glass microfiber filters, were utilized to analyse dissolved nitrate (NO3-N), ammonium (NH4+-N), and dissolved total phosphorus (DTP) through the UV spectrophotometric method, Nessler's reagent spectrophotometry, and ammonium molybdate spectrophotometric method, respectively (Cao et al., 2018). Additionally, in-situ profiles ofwater temperature (WT), dissolved oxygen (DO), pH and chlorophyll a (Chl a) were collected using a Hydro-lab DS5 at 0.5-5 m intervals from the surface to the bottom. Transparency was measured using a standard Secchi disk (Kim et al., 2020). The stratification period was defined as the period when the temperature difference exceeds 1°C within 1 m depth at the metalimnion, and vice versa for the mixing period (Yu et al., 2014).
Data analysis
In this study, the euphotic depth (Zeu) was determined as 2.7 times the transparency (Wen et al., 2022). The depth of the surface mixed layer (Zmix), defined by the gradient of the surface temperature of 0.2°C/m, was calculated according to Liu et al. (2012). The ratio of Zeu/Zmix was used as an indicator of light availability in the water column, following the methodology proposed by Jensen et al. (1994).
Several indices were used to assess the ecological status of water bodies in this study. Specifically, the Shannon-Wiener diversity index (if), Pielou evenness index (J), and Margalef richness index (D) were employed (Ding et al., 2021). The formulas for these indices are as follows:
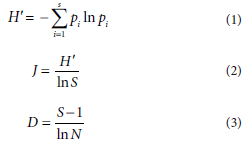
where pi is the ratio of the density of the i-th phytoplankton functional group to the total density, S represents the number of functional groups, and N denotes the overall number of phytoplankton species. Based on the values obtained from these three diversity indicators, water quality was classified into four levels: no pollution (H > 3.0, 0.8 < J < 1.0 and D > 5.0), light pollution (2.0 < H < 3.0, 0.5 < J < 0.8 and 4.0 < D < 5.0), moderate pollution (1.0 < H < 2.0, 0.3 < J < 0.5 and 3.0 < D < 4.0), and heavy pollution (0.0 < H < 1.0, 0.0 < J < 0.3 and 0.0 < D < 3.0).
The trophic status of the reservoir was evaluated using the commonly used trophic level index (TLI). The evaluation parameters included were Chl a, TN, TP, SD, and CODMn (Wang et al., 2019), which were calculated as follows:
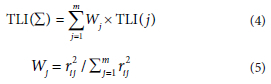
where TLI(j) is the composite index of j with the associated weight Wj; rtj is the coefficient of Chl a with each parameter j (Chl a, 1; TP, 0.84; TN, 0.82; SD, -0.83; CODMn, 0.83); m is the number of indices. TLI(Z) < 30 is considered poor nutrition; 30 < TLI(Z) < 50 is moderate nutrition; 50 < TLI(Z) < 60 is mild eutrophication.
The ecological status of water was assessed using the phytoplankton assemblage (Q) index, developed by the EU Water Framework, taking into account the mutual response of functional groups and environmental characteristics. The index can classify the ecological status of a reservoir into 5 categories: poor (0-1), tolerant (1-2), medium (2-3), good (3-4), and excellent (4-5) (Padisák et al., 2006). The formula for calculating the Q-index is as follows:
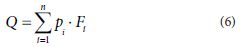
where n is the number of phytoplankton functional groups, pi is the proportion of the total phytoplankton biomass accounted for by the i-th functional group, and F t is the assignment value of the i-th functional group.
Statistical analysis
One-way analysis of variance (ANOVA) was applied to test the differences in physical and chemical factors across months, while the Kruskal-Wallis rank sum test was used for factors that did not meet the ANOVA requirements. Post-hoc tests were conducted using the least significant difference (LSD). IBM SPSS Statistics 26 software was used to perform these statistical analyses (Cao et al., 2018; C. Yang et al., 2020).
Non-metric multidimensional scaling (NMDS) analysis was performed to assess the variability of phytoplankton communities in different periods (Kim et al., 2020).
The relationship between phytoplankton communities and environmental factors was analysed using redundancy analysis (RDA) after phytoplankton abundance was Hellinger-transformed. The RDA results were tested for replacement and variance expansion coefficients were calculated. To reduce covariance, environmental factors with expansion coefficients greater than 15 were excluded. The remaining environmental factors were ranked in a parsimonious model to identify their contribution to phytoplankton. Variance partitioning analysis (VPA) was used to further assess the environmental factors' contribution to the structure of phytoplankton functional groups during different periods.
A heatmap was created using Pearson correlation analysis to demonstrate the correlation between dominant functional groups of phytoplankton and the driving factors.
Sampling maps were drawn using ArcGIS10.8 software. The aforementioned analysis methods, excluding ANOVA, were conducted using the vegan, ggplot2, and heatmap packages of R 4.1.3 software.
RESULTS
Characteristics of changes in physicochemical factors during different periods
During the survey period, several environmental factors of the reservoir were significantly different, except for NH4+-N, DTP, and CODMn (p < 0.05, Table 1). WT gradually increased during the stratification periods in 2020, peaking in September. The concentration of Chl a was significantly higher in January than in other months. The transparency of the water varied significantly during the mixing period, reaching a minimum value of 1.0 m in January 2020. Influenced by the high nitrogen and phosphorus load of the diverted water, TN concentrations remained above 1.1 mg/L throughout the year, while TP concentrations were relatively high in August, September, and October 2020. In the other months, TP concentrations were generally around 0.030 mg/L. Additionally, the N/P (mass ratio) varied significantly among different months.
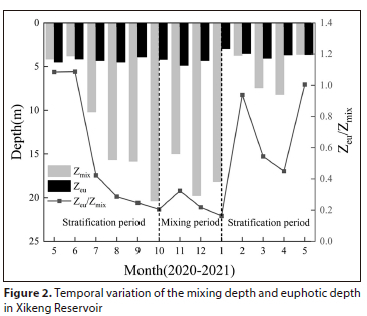
The water column of the reservoir can be divided into 3 periods: the stratification periods (May to September 2020; February to May 2021) and the mixing period (October 2020 to January 2021). As shown in Fig. 2, the mixing depth increased during the stratification period from July to September. The euphotic depth (Zeu) showed small fluctuations throughout the year, and the ratio of euphotic depth to mixing depth (Zeu/Zmix) was primarily influenced by the variations generated by Zmix fluctuations.
Phytoplankton composition and dominant functional groups
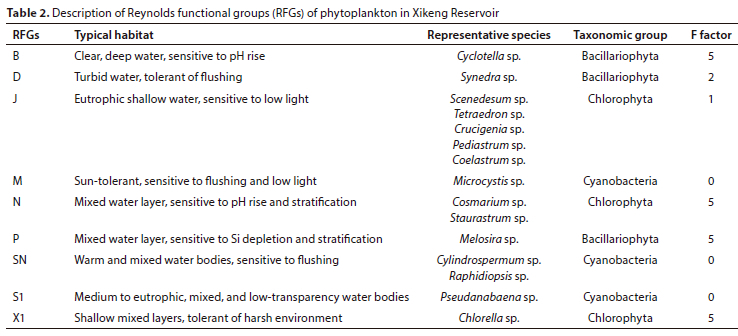
During the study period, a total of 125 phytoplankton species belonging to 8 phyla and 69 genera were identified in the reservoir. The majority of the species were Chlorophyta (71 species, 56.8%), followed by Bacillariophyta (22 species, 17.6%), Cyanobacteria (19 species, 15.2%), and a few species from Dinophyta, Euglenophyta, Chrysophyta, Cryptophyta, and Xanthophyta. These species were classified into 22 functional groups (A, B, D, E, F, G, H1, J, K, LO, LM, M, MP, N, SN, P, S1, T, W1, X1, X2, and Y), with dominant groups being B, D, J, M, N, P, SN, S1, and X1 as shown in Table 2.
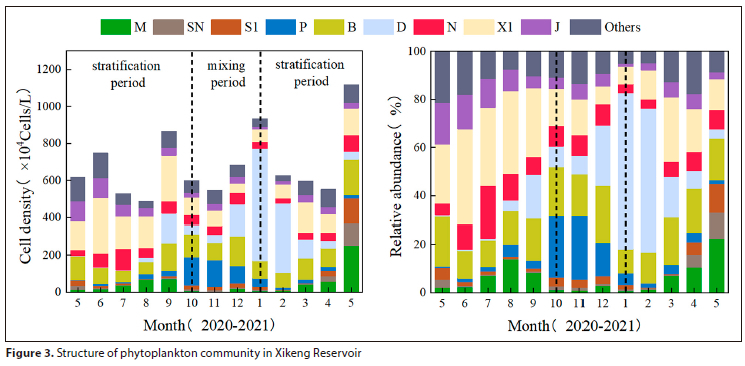
The study was performed to survey the effects of water mixing and stratification on the functional community structure of phytoplankton by analysing the changes in phytoplankton abundance and relative abundance at different periods. In Fig. 3, it is evident that during the stratification period of 2020, the functional group X1 of Chlorophyta had the highest relative abundance. Over the mixing period, however, the proportion of X1 gradually decreased, while that of functional groups P and D increased. Functional group D showed the highest relative abundance towards the end of the mixing period. During the following year's stratification period, the relative abundance of functional group D decreased significantly, while the abundances of functional groups M, X1, and SN gradually increased and reached their maximum in May. No significant changes were observed in the succession of functional groups B, J, and N during the study period.
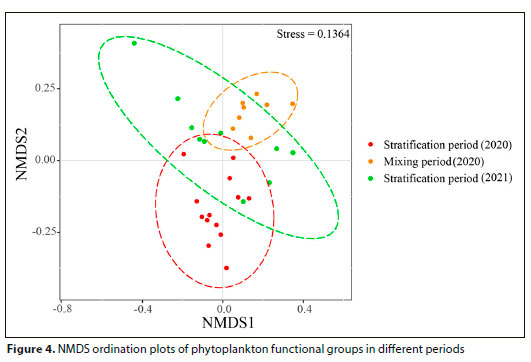
To investigate the impact of water mixing and stratification on the distribution characteristics of phytoplankton communities, the NMDS method based on Bray-Curtis similarity coefficients was used to analyse the phytoplankton community structure in different periods of the reservoir. Based on the NMDS analysis results depicted in Fig. 4, the phytoplankton functional groups exhibited marked differences across the three periods. The aggregation of samples during the stratification period was lower in comparison to the mixing period, and the aggregation of the two stratification periods also displayed considerable variation. These outcomes verified the soundness of the classification method strategy.
Phytoplankton diversity and water trophic status
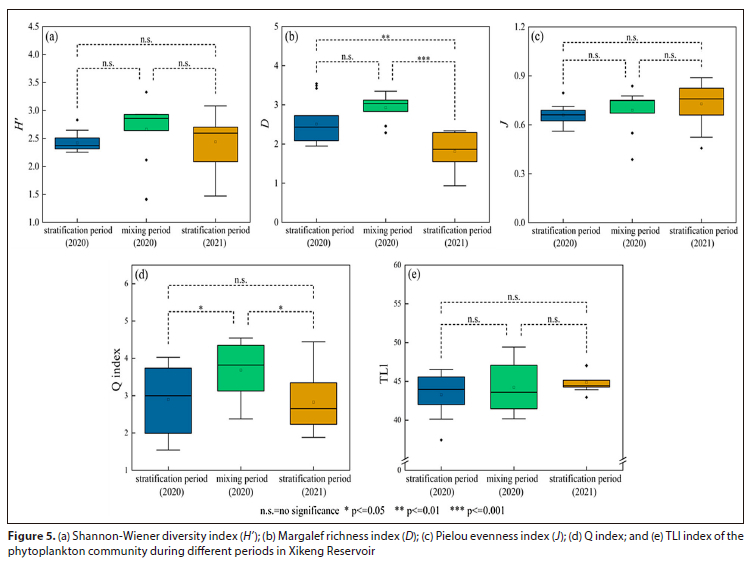
In this study, three commonly used evaluation indices were used to gain a more comprehensive understanding of the response characteristics of phytoplankton diversity to water stratification and mixing. The Shannon-Wiener diversity index revealed that the water body was slightly polluted, with no significant differences observed between the different periods (Fig. 5). Conversely, the Margalef richness index showed significant differences, indicating heavy water pollution. The Pielou evenness index suggested that the water body was slightly polluted, which was consistent with the Shannon-Wiener diversity index. The Q index, which gave similar results to the Shannon-Wiener diversity index and the Margalef richness index, revealed that the water ecological status was worse during the stratification period compared to the mixing period. Furthermore, the TLI index showed that the water bodies were mesotrophic, and there were no significant differences observed during the different periods (Table 1).
Relationships between functional phytoplankton communities and environmental factors
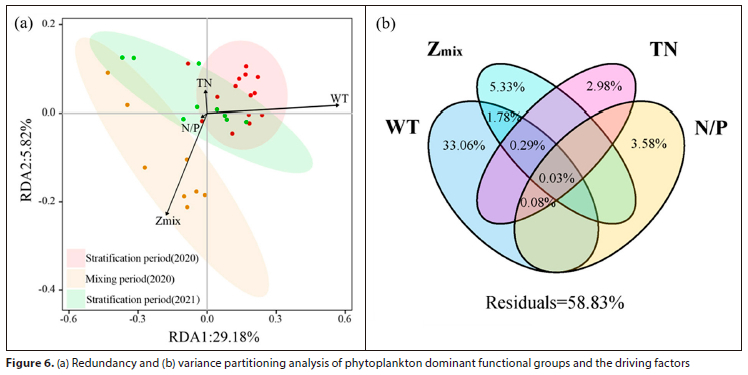
In this study, the RDA and VPA methods were used to screen the key environmental factors of the phytoplankton community in different periods. The RDA results (Fig. 6a) showed that WT and Zmix were significantly correlated with phytoplankton functional groups during the stratification and mixing periods of 2020, respectively (p < 0.01), and the dispersion of sample sites during the 2021 stratification period was consistent with NMDS analysis results. Additionally, the phytoplankton community structure was influenced by factors such as TN, WT, N/P, and TN. The first and second axes of the RDA analysis explained 29.18% and 5.82% of the variation, respectively. The VPA results (Fig. 6b) demonstrated that the contribution of WT was the highest (33.06%), followed by Zmk (5.33%), N/P (3.69%), and TN (3.38%). The combined contribution of WT and Zmix was 2.10%, and the total contribution of these four factors was 41.17%, suggesting their crucial role in the dynamics of phytoplankton functional groups in different periods.
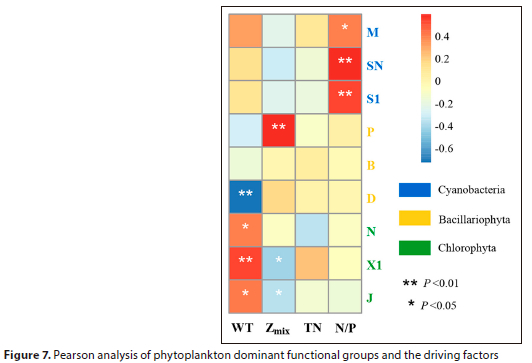
Pearson correlation analysis was used to investigate the relationships between major phytoplankton functional groups and key environmental factors. The results (Fig. 7) indicated that three of the above-mentioned four key factors, namely WT, Zmix, and N/P, had a significant impact on the major phytoplankton functional groups. Specifically, WT was positively correlated with functional groups N, X1, and J (p < 0.05) and negatively correlated with functional group D (p < 0.01). Zmix was positively correlated with functional group P (p < 0.01) and negatively correlated with functional groups X1 and J (p < 0.05). N/P was positively correlated with functional groups M, SN, and S1 (p < 0.05).
DISCUSSION
Key drivers affecting phytoplankton functional groups during different periods
Natural stratification and mixing are complex and important hydrological features of reservoirs that can directly affect the hydrodynamic conditions (e.g., mixing depth) and chemical parameters of the vertical water layers (Noori et al., 2021; Zhang et al., 2021). Variations in hydrological parameters and physicochemical elements often affect the functional group composition and structure of phytoplankton in aquatic ecosystems (Liu et al., 2012; Sun and Wang, 2021; Yao et al., 2020). In this study, screened environmental factors (WT, Zmix, N/P, and TN) only explained approximately 40% of the phytoplankton community composition by VPA analysis (Fig. 6b). There could be several reasons for this. Firstly, environmental factors may have a time lag effect on phytoplankton communities. Secondly, water disturbances and changes in water levels can also impact the abundance and structure of the phytoplankton community due to water diversions.
Temperature can influence the physiological metabolism and enzyme activity of phytoplankton cells, which can affect their rates of reproduction and growth, and ultimately determine the composition of their communities (Su et al., 2017). WT is a complex and comprehensive factor, as both light and Zmix are intimately linked to it (Liu et al., 2022). During the two stratification periods, phytoplankton was more greatly affected by WT, as depicted in Fig. 6a. Chlorophyta, particularly functional group X1 composed of Chlorella sp., showed a positive correlation with WT (p < 0.01), indicating a high-temperature niche and thriving in high-temperature environments. Previous studies have shown that as the temperature increased, the water column stratified to suit the growth of Chlorella sp. (Reynolds et al., 2002). Despite Chlorella sp. dominance during the 2020 stratification period, its abundance or relative abundance was not very high, due to its small surface area and low light availability. During the 2021 stratification period, WT reached its maximum in May, when cyanobacteria, consisting of Microcystis sp. (Group M), Cylindrospermum sp. (group SN), and Pseudanabaena sp. (Group S1), were dominant. Cyanobacteria, including Microcystis sp. and others, prefer high temperatures, and the positive impact of temperature on cyanobacteria has been observed in many aquatic ecosystems (Rao et al., 2021; Wang et al., 2021). The three species mentioned above are not only difficult to consume by filter-feeding zooplankton because of their large size or surface area (Paerl et al., 2011; Paerl and Huisman, 2008), but can gain a competitive advantage through the buoyancy regulation of gas vesicles. Besides, the functional groups of phytoplankton evolved from P to D during the mixing period, with functional group D being more suitable for growth in cold conditions. Bracht et al. (2008) indicated that Synedra sp. of functional group D was one of the major Bacillariophyta during prolonged cold spring seasons, which aligns with our findings.
The effects of water mixing on phytoplankton mainly manifest in two ways: (i) the dynamic mixing process causes disturbance and flushing of the water column, which impacts the structure of the phytoplankton community; and (ii) mixing directly affects the availability of light and nutrients to phytoplankton (Becker et al., 2010, 2009; Zhong et al., 2022). In contrast to the sites of most studies (Liu et al., 2012; Wen et al., 2022), Xikeng Reservoir is relatively shallow (22 m) and experiences the highest temperature from July to September, when heat transferred from the water surface to the middle water column led to an increase in Zmix. Additionally, Zmix slightly increased in March and April, likely due to an increase in water diversion. The results showed that Chlorella sp. was suitable for growth in the mixed layer of a semi-mixed or incompletely mixed water body, and Yu et al. (2018) also reported that Chlorella sp. was more dominant than Microcystis sp.in turbulent water. As the mixing depth continued to increase, the dominant species shifted from Chlorella sp. to Melosira sp., because the former is sensitive to deep mixing while the latter is suitable for complete mixing of the water body. Previous research has indicated that Bacillariophyta are capable of thriving in environments characterized by high turbulence, low temperatures, and high nutrient concentrations (Reynolds et al., 2002), particularly those with a high surface-to-volume ratio and weak light adaptation, such as functional group D. Furthermore, non-motile Bacillariophyta and Chlorophyta can remain in the euphotic layer for longer periods and receive light for photosynthesis, thanks to the carrying effect produced by vertical mixing (Li et al., 2019). The study confirmed this finding and was consistent with other studies (Wen et al., 2022). The results also demonstrate a decrease in Zm/Zmix (light availability) in 2020, while there was an occasional increase in phytoplankton abundance, suggesting that light limitation was not a critical factor influencing the changes in phytoplankton, especially for non-motile algae.
Variations in nutrient concentrations of the reservoir were influenced more by water diversion than the mixing process. These changes can affect phytoplankton abundance dynamics and species turnover (Diatta et al., 2020; Lie et al., 2011). This study demonstrated that DTP concentrations in May 2021 were generally lower than in the 2020 stratification period, with the former dominated by Microcystis sp. and the latter by Chlorella sp.. Consistent with previous studies, Chlorella sp., a small unicellular Chlorophyta with rapid nutrient uptake, was favoured more than Microcystis sp. by high phosphorus water (Cui et al., 2021; Yu et al., 2018; Zhong et al., 2022). Moreover, some studies have considered N/P as a factor that affects phytoplankton structure rather than absolute N and P concentrations (Yang et al., 2020). The results showed a predominance of Cyanobacteria in the functional groups M, SN, and S1 in April and May 2021, associated with a higher N/P at this time (Fig. 7). Numerous studies have indicated that Bacillariophyta and Chlorophyta will be replaced by Cyanobacteria as N/P increases (De Tezanos Pinto and Litchman, 2010a; b; Liu et al., 2021; Teubner and Dokulil, 2002). In May 2021, the results showed that a higher proportion of non-nitrogen-fixing cyanobacteria (Groups M and S1) were present than nitrogen-fixing Cyanobacteria (group SN) when N/P was higher, as found in other studies (Carey et al., 2012; Chislock et al., 2014; Liu et al., 2021; Scott et al., 2019). There was no significant correlation between TN and phytoplankton functional groups and the contribution rate was also the lowest, indicating that TN concentration in phosphorus-limited water had no significant effect on phytoplankton community structure.
In summary, the dynamic changes in the phytoplankton functional group structure during different periods in Xikeng Reservoir were jointly determined by WT, Zmix, N/P, and TN. Additionally, the dynamics of the phytoplankton functional groups were found to be more complex in the 2021 stratification period compared to the 2020 stratification period, as WT, Zmix, and N/P underwent significant changes simultaneously.
Evaluation of ecological state
Previous studies (Isabwe et al., 2018; Wu et al., 2019; Yan et al., 2014) have shown that phytoplankton diversity was a valid indicator of aquatic ecosystem status. However, the study revealed that the Margalef richness index yielded different results to the Shannon-Wiener diversity index and the Pielou evenness index, due to the proximity of the sampling site to the diversion area and the dynamic water diversion process (short hydraulic residence times) that may have reduced the phytoplankton species richness and abundance. Among the three indices, the decrease in the number of species (S) had the greatest impact on the Margalef richness index, indicating the limitation ofthis index in evaluating the water body's ecological state. The study did not detect any significant changes in the diversity index in different periods (Fig. 5), which supports the findings of other studies (Ochieng et al., 2022). On the one hand, the reservoir is situated in the warm subtropics, and WT was around 20°C during the mixing period, which provided favourable conditions for a considerable proportion of phytoplankton to survive. On the other hand, stratification is often accompanied by hypoxia in the hypolimnetic, leading to the release of nutrients (mainly N and P) from the sediment; then the reservoir mixing process causes and increase in the nutrient concentrations in the surface water column, promoting phytoplankton blooms (Chen et al., 2018). Consequently, the diversity index during the mixing period was not significantly lower than that during the stratification period and was even slightly higher. Overall, using phytoplankton diversity indices as indicators of ecosystem state in complex water bodies under changing environmental conditions may have some limitations, and a similar conclusion was reached for the study by Ding et al. (2021).
Given the limitation of the phytoplankton diversity index, the TLI index and Q index were used to assess the trophic and ecological status of the water bodies, respectively. The results showed that the two assessments were consistent, indicating that the trophic status of the water bodies was either medium or good, and the ecological status was moderate. Besides, the ecological condition of the water column during the mixing period was better than that of the stratification period. Similar observations have been reported for other studies (Dembowska et al., 2015; Wen et al., 2022). Therefore, it is crucial to extend the mixing period to enhance the ecological status of the reservoir. A practical application of this principle is for, reservoir managers to perform artificial mixing through water-lifting aerators (WLAs) at an appropriate time to extend the mixing period (Li et al., 2020; Wen et al., 2022).
CONCLUSION
The study explored the effects of stratification and mixing on phytoplankton community structure and diversity. The main findings were as follows:
• The stratification and mixing of the reservoir caused the phytoplankton community to display obvious differences: Chlorophyta or Cyanobacteria were dominant during the stratification period, corresponding to phytoplankton functional groups X1 or M; Bacillariophyta composed of functional groups P and D were the main functional groups in the mixing period.
• Consistent with the Q index, the phytoplankton diversity index was higher in the mixing period compared to the stratification period, indicating better ecological conditions in the mixing period. However, the Margalef richness index may be inadequate and unconvincing as an indicator of the ecological state of water bodies in Xikeng Reservoir, and it is necessary to combine it with the Q index to better evaluate ecological status.
• Under lower N/P mass ratio and higher mixing depth conditions, phytoplankton functional group X1 was favoured more than M, while functional group D was advantaged relative to P in low-temperature conditions. Moreover, the dynamic changes of phytoplankton functional groups were mainly influenced by WT, Zmix, N/P, and TN, as indicated by the RDA results.
• In addition, future research should investigate the complex effects of changing hydrodynamic conditions (e.g., flow velocity and Reynolds number) on phytoplankton communities resulting from dynamic water diversion processes. For the stratification periods with poor ecological conditions, especially in the southern subtropics where water stratification lasts for a longer time, reservoir managers should consider vertical monitoring and enhance the frequency of monitoring to prevent phytoplankton blooms.
ACKNOWLEDGMENTS
This work was supported by the National Natural Science Foundation of China (No. 51979217) and the Shaanxi Provincial Key Research and Development Project (No. 2022ZDLSF06-08).
AUTHOR CONTRIBUTIONS
Yunhao Bai: conceptualization; methodology; writing - original draft; writing-review and editing. Tinglin Huang: conceptualization; visualization; investigation. Pengcheng Yang: data curation; investigation.
CONFLICTS OF INTEREST
The authors declare no conflict of interest.
REFERENCES
BECKER V, CAPUTO L, ORDONEZ J, MARCÉ R, ARMENGOL J, CROSSETTI LO and HUSZAR VLM (2010) Driving factors of the phytoplankton functional groups in a deep Mediterranean reservoir. Water Res. 44 (11) 3345-3354. https://doi.org/10.1016/j.watres.2010.03.018 [ Links ]
BECKER V, HUSZAR VLM and CROSSETTI LO (2009) Responses of phytoplankton functional groups to the mixing regime in a deep subtropical reservoir. Hydrobiologia 628 (1) 137-151. https://doi.org/10.1007/s10750-009-9751-7 [ Links ]
BRACHT BB, STONE JR and FRITZ SC (2008) A diatom record of late Holocene climate variation in the northern range of Yellowstone National Park, USA. Quatern. Int. 188 (1) 149-155. https://doi.org/10.1016/j.quaint.2007.08.043 [ Links ]
CAO J, HOU ZY, LI ZK, CHU ZS, YANG PP and ZHENG BH (2018) Succession of phytoplankton functional groups and their driving factors in a subtropical plateau lake. Sci. Total Environ. 631-632 1127-1137. https://doi.org/10.1016/j.scitotenv.2018.03.026 [ Links ]
CAREY CC, IBELINGS BW, HOFFMANN EP, HAMILTON DP and BROOKES JD (2012) Eco-physiological adaptations that favour freshwater cyanobacteria in a changing climate. Water Res. 46 (5) 1394-1407. https://doi.org/10.1016/j.watres.2011.12.016 [ Links ]
CHEN SY, CAREY CC, LITTLE JC, LOFTON ME, MCCLURE RP and LEI CW (2018) Effectiveness of a bubble-plume mixing system for managing phytoplankton in lakes and reservoirs. Ecol. Eng. 113 43-51. https://doi.org/10.1016/j.ecoleng.2018.01.002 [ Links ]
CHISLOCK MF, SHARP KL and WILSON AE (2014) Cylindrospermopsis raciborskii dominates under very low and high nitrogen-to-phosphorus ratios. Water Res. 49 207-214. https://doi.org/10.1016/j.watres.2013.11.022 [ Links ]
CUI GY, WANG BL, XIAO J, QIU XL, LIU CQ and LI XD (2021) Water column stability driving the succession of phytoplankton functional groups in karst hydroelectric reservoirs. J. Hydrol. 592 125607. https://doi.org/10.1016/j.jhydrol.2020.125607 [ Links ]
DE TEZANOS PINTO P and LITCHMAN E (2010a) Eco-physiological responses of nitrogen-fixing cyanobacteria to light. Hydrobiologia 639 (1) 63-68. https://doi.org/10.1007/s10750-009-0014-4 [ Links ]
DE TEZANOS PINTO P and LITCHMAN E (2010b) Interactive effects of N:P ratios and light on nitrogen-fixer abundance. Oikos 119 (3) 567-575. https://doi.org/10.1111/j.1600-0706.2009.17924.x [ Links ]
DEMBOWSKA EA, NAPIÓRKOWSKI P, MIESZCZANKIN T and JÓZEFOWICZ S (2015) Planktonic indices in the evaluation of the ecological status and the trophic state of the longest lake in Poland. Ecol. Indic. 56 15-22. https://doi.org/10.1016/j.ecolind.2015.03.019 [ Links ]
DENG YB, ZHANG YL, LI DP, SHI K and ZHANG YB (2017) Temporal and spatial dynamics of phytoplankton primary production in Lake Taihu derived from MODIS data. Remote Sens. 9 (3) 195. https://doi.org/10.3390/rs9030195 [ Links ]
DIATTA J, WARACZEWSKA Z, GRZEBISZ W, NIEWIADOMSKA A and TATUSKO-KRYGIER N (2020) Eutrophication induction via N/P and P/N ratios under controlled conditions-effects of temperature and water sources. Water Air Soil Pollut. 231 (4) 149. https://doi.org/10.1007/s11270-020-04480-7 [ Links ]
DING YT, PAN BZ, ZHAO GN, SUN CS, HAN X and LI M (2021) Geo-climatic factors weaken the effectiveness of phytoplankton diversity as a water quality indicator in a large sediment-laden river. Sci. Total Environ. 792 148346. https://doi.org/10.1016/j.scitotenv.2021.148346 [ Links ]
FU H, YUAN GX, ÖZKAN K, JOHANSSON LS, S0NDERGAARD M, LAURIDSEN TL and JEPPESEN E (2020) Seasonal and longterm trends in the spatial heterogeneity of lake phytoplankton communities over two decades of restoration and climate change. Sci. Total Environ. 748 141106. https://doi.org/10.1016/j.scitotenv.2020.141106 [ Links ]
GOGOI P, DAS SK, DAS SARKAR S, CHANU TN, MANNA RK, SENGUPTA A, RAMAN RK, SAMANTA S and DAS BK (2021) Environmental factors driving phytoplankton assemblage pattern and diversity: insights from Sundarban eco-region, India. Ecohydrol. Hydrobiol. 21 (2) 354-367. https://doi.org/10.1016/j.ecohyd.2020.09.005 [ Links ]
HUANG YW, YANG C, WEN CC and WEN G (2019) S-type dissolved oxygen distribution along water depth in a canyon-shaped and algae blooming water source reservoir: reasons and control. Int. J. Environ. Res. Public Health 16 (6) 987. https://doi.org/10.3390/ijerph16060987 [ Links ]
ISABWE A, YANG JR, WANG YM, LIU LM, CHEN HH and YANG J (2018) Community assembly processes underlying phytoplankton and bacterioplankton across a hydrologic change in a human-impacted river. Sci. Total Environ. 630 658-667. https://doi.org/10.1016/j.scitotenv.2018.02.210 [ Links ]
JAKOBSEN HH, BLANDA E, STAEHR PA, H0JGÀRD JK, RAYNER TA, PEDERSEN MF, JEPSEN PM and HANSEN BW (2015) Development of phytoplankton communities: Implications of nutrient injections on phytoplankton composition, pH and ecosystem production. J. Exp. Mar. Biol. Ecol. 473 81-89. https://doi.org/10.1016/j.jembe.2015.08.011 [ Links ]
JENSEN JP, JEPPESEN E, OLRIK K and KRISTENSEN P (1994) Impact of nutrients and physical factors on the shift from cyanobacterial to chlorophyte dominance in shallow Danish lakes. Can. J. Fish. Aquat. Sci. 51 (8) 1692-1699. https://doi.org/10.1139/f94-170 [ Links ]
JIA JJ, GAO Y, ZHOU F, SHI K, JOHNES PJ, DUNGAIT JAJ, MA MZ and LU Y (2020) Identifying the main drivers of change of phytoplankton community structure and gross primary productivity in a river-lake system. J. Hydrol. 583 124633. https://doi.org/10.1016/j.jhydrol.2020.124633 [ Links ]
JIANG YJ, HE W, LIU WX, QIN N, OUYANG HL, WANG QM, KONG XZ, HE QS, YANG C, YANG B and XU FL (2014) The seasonal and spatial variations of phytoplankton community and their correlation with environmental factors in a large eutrophic Chinese lake (Lake Chaohu). Ecol. Indic. 40 58-67. https://doi.org/10.1016/j.ecolind.2014.01.006 [ Links ]
KIM HG, HONG S, KIM D-K and JOO G-J (2020) Drivers shaping episodic and gradual changes in phytoplankton community succession: Taxonomic versus functional groups. Sci. Total Environ. 734 138940. https://doi.org/10.1016/j.scitotenv.2020.138940 [ Links ]
LI CC, FENG WY, CHEN HY, LI XF, SONG FH, GUO WJ, GIESY JP and SUN FH (2019) Temporal variation in zooplankton and phytoplankton community species composition and the affecting factors in Lake Taihu-a large freshwater lake in China. Environ. Pollut. 245 1050-1057. https://doi.org/10.1016/j.envpol.2018.11.007 [ Links ]
LI N, HUANG TL, LI Y, SI F, ZHANG HH and WEN G (2020) Inducing an extended naturally complete mixing period in a stratified reservoir via artificial destratification. Sci. Total Environ. 745 140958. https://doi.org/10.1016/j.scitotenv.2020.140958 [ Links ]
LIE AAY, WONG CK, LAM JYC, LIU JH and YUNG YK (2011) Changes in the nutrient ratios and phytoplankton community after declines in nutrient concentrations in a semi-enclosed bay in Hong Kong. Mar. Environ. Res. 71 (3) 178-188. https://doi.org/10.1016/j.marenvres.2011.01.001 [ Links ]
LIU L, LIU DF, JOHNSON DM, YI ZQ and HUANG YL (2012) Effects of vertical mixing on phytoplankton blooms in Xiangxi Bay of Three Gorges Reservoir: Implications for management. Water Res. 46 (7) 2121-2130. https://doi.org/10.1016/j.watres.2012.01.029 [ Links ]
LIU SY, CUI ZM, ZHAO YF and CHEN NS (2022) Composition and spatial-temporal dynamics of phytoplankton community shaped by environmental selection and interactions in the Jiaozhou Bay. Water Res. 218 118488. https://doi.org/10.1016/j.watres.2022.118488 [ Links ]
LIU XM, CHEN LW, ZHANG GX, ZHANG JJ, WU Y and JU HY (2021) Spatiotemporal dynamics of succession and growth limitation of phytoplankton for nutrients and light in a large shallow lake. Water Res. 194 116910. https://doi.org/10.1016/j.watres.2021.116910 [ Links ]
NOORI R, ANSARI E, BHATTARAI R, TANG Q, ARADPOUR S, MAGHREBI M, TORABI HAGHIGHI A, BENGTSSON L and KL0VE B (2021) Complex dynamics of water quality mixing in a warm mono-mictic reservoir. Sci. Total Environ. 777 146097. https://doi.org/10.1016/j.scitotenv.2021.146097 [ Links ]
OCHIENG B, MBAO EO, ZHANG Z, SHI LD and LIU QG (2022) Phytoplankton community structure of Tang-Pu Reservoir: status and ecological assessment in relation to physicochemical variability. Environ. Monit. Assess. 194 (5) 382. https://doi.org/10.1007/s10661-022-09958-x [ Links ]
PADISÁK J, BORICS G, GRIGORSZKY I and SORÓCZKI-PINTÉR É (2006) Use of phytoplankton assemblages for monitoring ecological status of lakes within the Water Framework Directive: the assemblage index. Hydrobiologia 553 (1) 1-14. https://doi.org/10.1007/s10750-005-1393-9 [ Links ]
PAERL HW, HALL NS and CALANDRINO ES (2011) Controlling harmful cyanobacterial blooms in a world experiencing anthropogenic and climatic-induced change. Sci. Total Environ. 409 (10) 1739-1745. https://doi.org/10.1016/j.scitotenv.2011.02.001 [ Links ]
PAERL HW and HUISMAN J (2008) Blooms like it hot. Science 320 (5872) 57-58. https://doi.org/10.1126/science.1155398 [ Links ]
RAO K, ZHANG X, WANG M, LIU JF, GUO WQ, HUANG GW and XU J (2021) The relative importance of environmental factors in predicting phytoplankton shifting and cyanobacteria abundance in regulated shallow lakes. Environ. Pollut. 286 117555. https://doi.org/10.1016/j.envpol.2021.117555 [ Links ]
REYNOLDS CS, HUSZAR V, KRUK C, NASELLI-FLORES L and MELO S (2002) Towards a functional classification of the freshwater phytoplankton. J. Plankton Res. 24 (5) 417-428. https://doi.org/10.1093/plankt/24.5.417 [ Links ]
ROLLAND A, BERTRAND F, MAUMY M and JACQUET S (2009) Assessing phytoplankton structure and spatio-temporal dynamics in a freshwater ecosystem using a powerful multiway statistical analysis. Water Res. 43 (13) 3155-3168. https://doi.org/10.1016/j.watres.2009.03.049 [ Links ]
RUEDA F, MORENO-OSTOS E and ARMENGOL J (2006) The residence time of river water in reservoirs. Ecol. Modell. 191 (2) 260-274. https://doi.org/10.1016/j.ecolmodel.2005.04.030 [ Links ]
SCOTT JT, MCCARTHY MJ and PAERL HW (2019) Nitrogen transformations differentially affect nutrient-limited primary production in lakes of varying trophic state. Limnol. Oceanogr. Lett. 4 (4) 96-104. https://doi.org/10.1002/lol2.10109 [ Links ]
SIEGEL DA, BEHRENFELD MJ, MARITORENA S, MCCLAIN CR, ANTOINE D, BAILEY SW, BONTEMPI PS, BOSS ES, DIERSSEN HM, DONEY SC and co-authors (2013) Regional to global assessments of phytoplankton dynamics from the SeaWiFS mission. Remote Sens. Environ. 135 77-91. https://doi.org/10.1016/j.rse.2013.03.025 [ Links ]
SILVA LHS, HUSZAR VLM, MARINHO MM, RANGEL LM, BRASIL J, DOMINGUES CD, BRANCO CC and ROLAND F (2014) Drivers of phytoplankton, bacterioplankton, and zooplankton carbon biomass in tropical hydroelectric reservoirs. Limnologica 48 1-10. https://doi.org/10.1016/j.limno.2014.04.004 [ Links ]
SU XM, STEINMAN AD, XUE QJ, ZHAO YY, TANG XM and XIE LQ (2017) Temporal patterns of phyto- and bacterioplankton and their relationships with environmental factors in Lake Taihu, China. Chemosphere 184 299-308. https://doi.org/10.1016/jxhemosphere.2017.06.003 [ Links ]
SUN X and WANG W (2021) The impact of environmental parameters on phytoplankton functional groups in northeastern China. Ecol. Eng. 164 106209. https://doi.org/10.1016/j.ecoleng.2021.106209 [ Links ]
TEUBNER K and DOKULIL MT (2002) Ecological stoichiometry of TN : TP : SRSi in freshwaters: nutrient ratios and seasonal shifts in phytoplankton assemblages. Fundam. Appl. Limnol. 154 (4) 625-646. https://doi.org/10.1127/archiv-hydrobiol/154/2002/625 [ Links ]
WANG JL, FU ZS, QIAO HX and LIU FX (2019) Assessment of eutrophication and water quality in the estuarine area of Lake Wuli, Lake Taihu, China. Sci. Total Environ. 650 1392-1402. https://doi.org/10.1016/j.scitotenv.2018.09.137 [ Links ]
WANG ZS, AKBAR S, SUN YF, GU L, ZHANG L, LYU K, HUANG Y and YANG Z (2021) Cyanobacterial dominance and succession: Factors, mechanisms, predictions, and managements. J. Environ. Manage. 297 113281. https://doi.org/10.1016Aj.jenvman.2021.113281 [ Links ]
WEN CC, HUANG TL, WEN G, LI K, YANG SY, ZHANG HH, XU J and WANG Z (2022) Controlling phytoplankton blooms in a canyon-shaped drinking water reservoir via artificial and induced natural mixing: Taxonomic versus functional groups. Chemosphere 287 131771. https://doi.org/10.1016/jxhemosphere.2021.131771 [ Links ]
WU ZS, KONG M, CAI YJ, WANG XL and LI KY (2019) Index of biotic integrity based on phytoplankton and water quality index: Do they have a similar pattern on water quality assessment? A study of rivers in Lake Taihu Basin, China. Sci. Total Environ. 658 395-404. https://doi.org/10.1016/j.scitotenv.2018.12.216 [ Links ]
YAN JX, LIU JL and MA MY (2014) In situ variations and relationships of water quality index with periphyton function and diversity metrics in Baiyangdian Lake of China. Ecotoxicology 23 (4) 495-505. https://doi.org/10.1007/s10646-014-1199-5 [ Links ]
YANG Y, PAN JY, HAN BP and NASELLI-FLORES L (2020) The effects of absolute and relative nutrient concentrations (N/P) on phytoplankton in a subtropical reservoir. Ecol. Indic. 115 106466. https://doi.org/10.1016/j.ecolind.2020.106466 [ Links ]
YAO LG, ZHAO XM, ZHOU GJ, LIANG RC, GOU T, XIA BC, LI SY and LIU C (2020) Seasonal succession of phytoplankton functional groups and driving factors of cyanobacterial blooms in a subtropical reservoir in South China. Water 12 (4) 1167. https://doi.org/10.3390/w12041167 [ Links ]
YU Q, LIU ZW, CHEN YC, ZHU DJ and LI N (2018) Modelling the impact of hydrodynamic turbulence on the competition between Microcystis and Chlorella for light. Ecol. Modell. 370 50-58. https://doi.org/10.1016/j.ecolmodel.2018.01.004 [ Links ]
YU Z, YANG J, AMALFITANO S, YU X and LIU L (2014) Effects of water stratification and mixing on microbial community structure in a subtropical deep reservoir. Sci. Rep. 4 (1) 5821. https://doi.org/10.1038/srep05821 [ Links ]
YUAN YX, JIANG M, LIU XT, YU HX, OTTE ML, MA CX and HER YG (2018) Environmental variables influencing phytoplankton communities in hydrologically connected aquatic habitats in the Lake Xingkai basin. Ecol. Indic. 91 1-12. https://doi.org/10.1016/j.ecolind.2018.03.085 [ Links ]
ZHANG HH, LIU KW, HUANG TL, LI N, SI F, FENG J, HUANG X and MIAO YT (2021) Effect of thermal stratification on denitrifying bacterial community in a deep drinking water reservoir. J. Hydrol. 596 126090. https://doi.org/10.1016/j.jhydrol.2021.126090 [ Links ]
ZHANG SS, XU HZ, ZHANG YF, LI YZ, WEI JL and PEI HY (2020) Variation of phytoplankton communities and their driving factors along a disturbed temperate river-to-sea ecosystem. Ecol. Indic. 118 106776. https://doi.org/10.1016/j.ecolind.2020.106776 [ Links ]
ZHONG YP, SU YP, ZHANG DY, SHE CX, CHEN NW, CHEN JX, YANG H and BALAJI-PRASATH B (2022) The spatiotemporal variations in microalgae communities in vertical waters of a subtropical reservoir. J. Environ. Manage. 317 115379. https://doi.org/10.1016/j.jenvman.2022.115379 [ Links ]
 Correspondence:
Tinglin Huang
Email: huangtinglin@xauat.edu.cn
Received: 19 October 2022
Accepted: 6 September 2023

