


Services on Demand
Article
 English (pdf)
 Article in xml format
 Article references
Indicators

Related links
-
 Cited by Google
 -
 Similars in Google
Share

 Permalink
Water SA
On-line version ISSN 1816-7950
Print version ISSN 0378-4738
Water SA vol.49 n.4 Pretoria Oct. 2023
http://dx.doi.org/10.17159/wsa/2023.v49.i4.4009
RESEARCH PAPER
Experimental study on optimum performance of two-stage air-heated bubble-column humidification-dehumidification system
Majid Khan; M Faizan; Mohamed A Antar; Atia E Khalifa
Department of Mechanical Engineering, King Fahd University of Petroleum and Minerals, Dhahran 31261, Saudi Arabia
ABSTRACT
An experimental investigation of a small-scale air-heated humidification-dehumidification (HDH) desalination system with bubble-column humidification and dehumidification units was conducted. The study addressed the performance of the multistage air-heated bubble-column HDH system, which has limited coverage in the literature, by operating two bubble-column humidifiers in series for the air humidification process with air reheating. The effect of operating parameters such as airflow rate, air temperature, and saline water levels in both humidifiers on the performance metrics of the system were investigated. The product distillate rate, energy consumption, gain output ratio (GOR), and specific energy consumption (SEC) are the main indicators of performance for the proposed desalination system. Response surface methodology (RSM) was applied to the current system using the design of experiment (DoE) for the prediction of variables that greatly affect productivity and energy input. The airflow rate, air temperature, and water level of the second humidifier have a favourable effect on the distillate rate and GOR of the system. In contrast, the effect of the water level inside the first humidifier is insignificant. Furthermore, the RSM optimization approach was used to obtain the optimum distillate productivity. An optimized distillate rate of 0.45 L/h and a GOR of 0.4 are achieved at 1.5 SCFM (standard cubic feet per minute) of airflow rate, and 6.5 cm of water level in the second humidifier with 140°C air inlet temperature. The numerical optimization reveals the optimal operating parameters, that correspond to maximum distillate production of 0.3 L/h with minimum input energy of 0.71 kW, to be 139°C air temperature, 1.13 SCFM of airflow rate, 6.5 cm and 3 cm water levels of second and first humidifier, respectively.
Keywords: thermal desalination, two-stage HDH, bubble column humidifier and, dehumidifier, response surface methodology, optimization
INTRODUCTION
The demand for potable water has exceeded its supply in many regions around the world, especially in arid zones. It is expected that this imbalance of supply and demand of drinking water will also expand to affect other parts of the world in the future. Hence, to meet freshwater demand against its rising consumption, desalination and reuse of various water sources have become essential solutions.
Currently, different desalination technologies are available, among which some have been commercialized, while others are still under development. Among available desalination processes, humidification-dehumidification (HDH) is considered a promising approach for small- to medium-scale systems suitable for arid regions. The HDH process has many advantages over other purification methods, such as simple design, low material and maintenance cost, and low operating temperature, in addition to its adaptable nature for utilizing low-grade energy. HDH technology was originally designed for water desalination systems, and found an effective place in the market for commercial water treatment and reuse systems for fresh water known for extremely high salinity (Garg, 2023). The design and configuration of the humidifier and dehumidifier used in HDH systems greatly affects the performance of the system. The conventional humidifiers and dehumidifiers used in HDH systems are associated with some shortcomings. For example, spray tower humidifiers have low efficiency due to lower water hold-up and large pressure drop, because of spray nozzles on the water side (Dahiru and Qasem, 2020). On the other hand, the packed bed humidifier requires a large packing volume for achieving high heat and mass transfer rate, which results in expensive and large-sized equipment (Narayan and Sharqawy, 2013). Narayan et al. (2010) reviewed several packing materials (honeycomb paper, plastic, wood, ceramic, etc.) and showed that performance, durability, and efficiency are sacrificed in one or another configuration due to fouling, poor contact area, and substantial pressure drop. Similarly, finned heat exchangers as dehumidifiers generally need to be large in size to achieve reasonable effectiveness. In addition, substantial pressure drop has been noted in tubes of shell and tube heat exchangers. Similarly, all conventional dehumidifiers have low heat and mass transfer coefficients due to the presence of non-condensable gases (Tow and Lienhard, 2013).
Recent studies on HDH desalination mainly focus on achieving high heat and mass transfer coefficients in humidifiers and dehumidifiers (Faegh et al., 2019; Schmak et al., 2013). Researchers have investigated several direct contact types of humidifiers and dehumidifiers to avoid additional resistances due to non-condensable gases, and to reduce equipment size and cost while still achieving high effectiveness. In this regard, bubble-column humidifiers and dehumidifiers have been found to be among the ground-breaking techniques in the field of HDH systems (Taseidifar et al., 2018; Abd-ur Rahman and AlSulaiman, 2017; Ahmaditaba et al., 2018). Bubble-column humidifiers and dehumidifiers are capable of providing high heat and mass transfer coefficients with small equipment sizes (Antar et al., 2016; Gao et al., 2018). Francis and Pashley (2010) presented the concept of utilization of non-boiling bubble-column components in the field of thermal desalination.
They discovered that saline water inhibits the coalescence of air bubbles and proposed that water vapour can be captured, transported, and collected via a bubble column operating at moderate temperatures with low thermal energy input and without the requirement for boiling. Rajaseenivasan and Srithar (2017) analysed a bubble-column humidification and dehumidification system with and without preheated air supply in their proposed system. The effect of operational parameters on system performance was studied using the Taguchi optimization method (Khalifa and Lawal, 2016). The highest distillate rate obtained was 6.1 kg/h with 0.0133 USD/kg production cost. Halima et al. (2017) studied an experimentally modified solar still through the bubbling effect in its basin, along with the estimation of the heat and mass transfer coefficient between air and water. Humidification efficiency was found to be slightly affected by water level while moderately affected by water temperature and airflow rate. Patel et al. (2020) experimentally studied a bubble-column humidifier and a thermoelectric cooler as a dehumidifier for air-heated and water-heated systems. The productivity obtained was 7 to 13 L/day for different operating conditions, while optimum productivity and GOR were 12.91 L/day and 0.8, respectively. Abdelkader et al. (2020) investigated a single-stage HDH bubble-column system for air- and water-heated cycles for three different water levels (4.5 to 6 cm), water temperature (65 to 85°C) and flow rates (0.15 to 0.35 SCFM (standard cubic feet per minute; 1 SCFM = 0.000472 m3/s or 28.3 L/min). A maximum GOR for the water-heated cycle was achieved as 0.95, while for the air-heated cycle it was 0.12. However, the productivity of the system was 0.35 L/h. It was especially limited for the air-heated cycle, due to the lower temperature of air leaving the humidifier. Eder and Preifiinger (2020) studied an HDH system with a bubble-column humidifier and shell and tube heat exchanger (HX) as an air dehumidifier for a water-heated cycle. They analysed the humidification efficiency by varying liquid column height (60 to 378 mm), superficial velocity (0.5 to 5 cm/s), and orifice sieve plate diameters (1 to 3 mm). They concluded that superficial velocity has a significant effect on productivity, among other mentioned parameters.
Table 1 shows a detailed review of previous studies and their findings related to bubble-column components in HDH systems. It appears that researchers have used bubble columns as either humidifiers or dehumidifiers, separately (Khalifa and Lawal, 2015, 2017). To the best of the authors' knowledge, no published work has included bubble-column humidifiers and dehumidifiers together in a single system for a two-stage humidifier having an air-heated cycle. Moreover, most of the experimental work to date has focused on the water-heated cycle, despite its high thermal energy consumption (Sharqawy et al., 2014).
Hence, to further investigate HDH systems, the present study analysed a novel configuration of an air-heated cycle through the use of a two-stage bubble-column humidifier and a single dehumidifier. The experimental setup consisted of a two-stage bubble-column humidifier with reheating of air and a single-stage bubble-column dehumidifier. The airflow rate, air temperature, and saline water level of both humidifiers were varied as operating parameters to study the distillate rate, energy consumption and GOR as performance measures.
Furthermore, the design of experiment (DOE) approach was implemented to find the minimum number of observations/ datasets needed for operating parameters and their interaction in order to study their influence on response and performance. Hence, DOE enabled the effective analysis of the huge dataset of operating variables and reduced experimentation time and number of runs. In addition, this study also aimed at the optimization of productivity using the response surface methodology (RSM) and Taguchi optimization technique. Once the results of the dataset of different operating parameters and their interactions was obtained, an optimization method was applied to determine the highest productivity achievable with minimum operating parameters. Optimization also provides an analytical solution based on given operating parameters. The operating parameters under consideration were airflow rate, air inlet temperature, and water level in the second humidifier.
METHODOLOGY
Experimental setup
Figure 1 shows a schematic of the experimental setup of the two-stage humidification bubble-column HDH system with air heating. The first stage of humidification consists of a box-type air heater and the first bubble-column humidifier. The second stage of humidification contains another air-heating unit (reheating process) with the second bubble-column humidifier. The dehumidification section consists of a single bubble-column dehumidifier equipped with a cooling pipe fed by a chiller that circulates cold water for effective condensation. A compressor supplies air at the desired flow rates through a control valve. A flow meter with a range of 0.4 to 4.5 SCFM is installed after the air supply for measuring the airflow rate. During the experiment, air at a desired flow rate is heated to a certain temperature in the box-type heater, which is controlled using a thermostat. Hot air enters the first humidifier from the bottom through a perforated plate. The perforated plate creates pressurized air bubbles and distributes air uniformly. Air bubbles pass through the saline water column, which is located above the perforated plate.
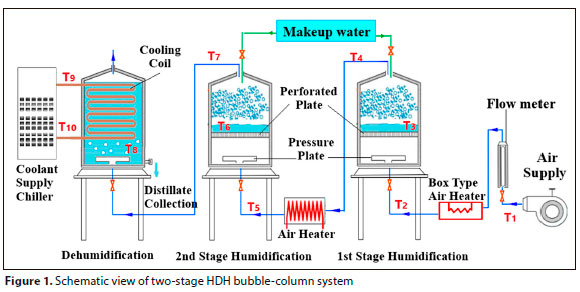
Hot air is humidified while it transfers heat to colder saline water. Humid air leaves through the top of the first bubble-column humidifier and is reheated before flowing into the second stage of humidification.
Water levels in both bubble-column humidifiers are maintained through a make-up water tank. Hot and humid air after the second humidifier stage flows into the bubble-column dehumidifier through a sparger plate. The bubble-column dehumidifier contains a pool of cold freshwater whose temperature is maintained by a coolant circulated inside an immersed copper coil. A Chiller (model Accel 500LC) circulates the coolant at a rate of 4.2 L/min. Water vapour in the humid air condenses inside the dehumidifier in a liquid column. The increase in water level inside the dehumidifier column represents the distillate formed, while the decrease in water levels inside the humidifiers is an indication of the evaporation process.
Materials and specification
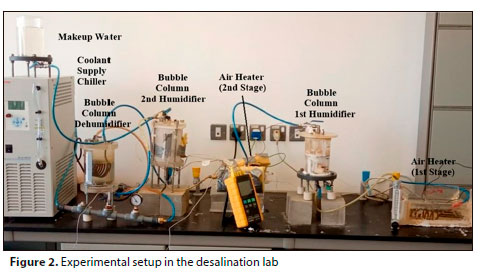
All bubble columns were constructed from plexiglass cylinders, whereas the perforated plates were made from acrylic sheets. Pressure plates were made of stainless steel. The first humidifier had an internal diameter of 11.5 cm with a total column height of 16 cm. The sparger plates (perforated plates) installed inside the first humidifiers include 66 holes with a diameter of 5 mm each. The diameter of the second humidifier was 13.5 cm and its sparger contains 60 holes with a diameter of 2 mm. Similarly, the dehumidifier has a 12.5 cm diameter with 156 sparger holes. The copper cooling coil had a diameter of 0.5 cm. A photograph of the experimental setup is presented in Fig. 2.
Measurement and instrumentation
Measurements were recorded once the system reached steady state operation, as indicated by stable temperatures at different locations in the system. Ten thermocouples, as shown in Fig. 1, were placed at different locations to measure the temperatures of air, saline water, and cooling water. All bubble columns were marked with calibrated scales to measure the incremental changes in water levels. The relative humidity of air at the outlet of the humidifiers and dehumidifiers was measured using a hygrometer. Flow meters measured the volume flow rate of incoming air while a stopwatch was used to measure the time of observations.
Standard uncertainties and accuracies of measuring instruments calculated (Kirkup and Frenkel, 2006) are shown in Table 2.
Performance metrics
Distillate rate ( md )
The rate of distillate production is calculated for each test as:
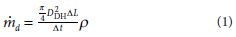
where AL is the level increment of water inside the dehumidifier, and Af is the time needed to achieve that level increment (product collection time) (Abdelkader et al., 2020).
Energy input (Qin)
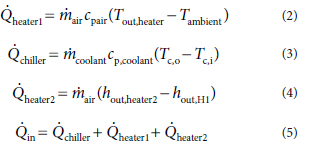
Here, energy input involves energies of three components including (i) energy of the air heater named heater1 (it is expressed in Eq. 2), (ii) energy supplied to the chiller (which is described in Eq. 3), (iii) energy consumed by the box-type heater named as heater2 (which is present in Eq. 4) (Abdelkader et al., 2020). It is worth mentioning that the specific enthalpy represents the enthalpy per unit mass of dry air.
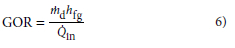
Gain output ratio (GOR)
Gain output ratio (GOR) is defined as a ratio between energy utilized to evaporate distillate and energy input. This expression is well-known for the assessment of the HDH system based on productivity obtained from energy input. The enthalpy of vaporization is taken as the temperature of the distillate because condensation is an isothermal process (Abdelkader et al., 2020).
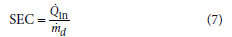
Specific energy consumption (SEC)
The specific energy consumption (SEC, kWh/L) represents the required energy input per unit production of distillate. It is evaluated based on thermal energy and expressed as (Abdelkader et al., 2020):
RESULTS AND DISCUSSION
Design of experiment
Experiments included variations of 4 operating parameters - air inlet temperature to the first-stage humidifier, airflow rate, and water levels in the two humidification stages - that were studied for their effect on the system's productivity and input energy requirement. Typical air temperatures measured at various locations are given in Table 3. Ambient air (T1) flows into the first air heater where it is sensibly heated to relatively high values (T2). Then, it enters the first humidifier where it is cooled to a lower temperature (T3) due to its interaction with colder water in the first humidifier. When air cools, its ability to carry moisture decreases. So, it is re-heated in the second heater to the maximum temperature (T5) before it enters the second humidifier where it would be humidified again at T7. Finally, humid air flows into the dehumidifier which has pure water on the top of the perforated plate. Water vapour carried by the air is condensed and air leaves the dehumidifier at temperature To.
In this regard, response surface methodology (RSM) was chosen to evaluate the effects of the mentioned multiple factors on two responses (productivity and input energy). Design Expert software was employed to apply the response surface methodology. Each operational variable was varied within 3 interaction levels: air temperatures were 140°C, 130°C and 120°C, airflow rates were 1.5 SCFM, 1.25 SCFM, and 1 SCFM, with the water level in the first humidifier at 5 cm, 4 cm and 3 cm, whereas water level in the second humidifier was set to 6.5 cm, 5.5 cm, and 4.5 cm. Water levels in the second humidifier are different from the first humidifier because of the different diameters of each humidifier. The range of each design variable (the design space) and response used as per the central composite design (CCD) of the RSM method are shown in Table 4.
Response surface methodology (RSM) analysis
Response surface methodology can be defined as a statistical approach that utilizes the quantitative data from the design of experiments to determine and simultaneously solve multi-variable equations. It involves a collection of mathematical and statistical techniques for the construction of an empirical model, the purpose of which is to optimize the responses. Primarily, RSM was developed to model the experimental responses and then migrated into the modeling of numerical experiments.
Face-centred central composite design (FCCD) was further selected as a sub-design option of RSM. It is employed when the domain of operation encloses the full region of interest described by the variable ranges. Moreover, it is the least sensitive to experimental error associated with setup and operation. It is also the simplest methodology, since it requires only 3 levels of each experimental variable. FCCD is used with a value of a = 0.05 (threshold of statistical significance, p < 0.05) and the number of centre points = 1 (value of a variable is taken halfway between low and high). This greatly reduces the number of observations required for analysing the system variables and their interaction with each other. The factorial design in Minitab/Design Expert depicted that a total number of 25 runs with 1 centre point and 24 non-centre points (8 axial and 16 cube points) can predict the whole system performance of the given experimental operating variables.
RSM initializes the operation by fitting a first-order polynomial equation, assuming white noise. RSM allows significant terms to change in the next step. But there are no general guidelines for determining the appropriate size of the local area in each step (Chang and Wan, 2014). Moreover, RSM uses an iterative approach to confirm the optimization value and controls the computational time burden by eliminating non-significant terms/ interactions.
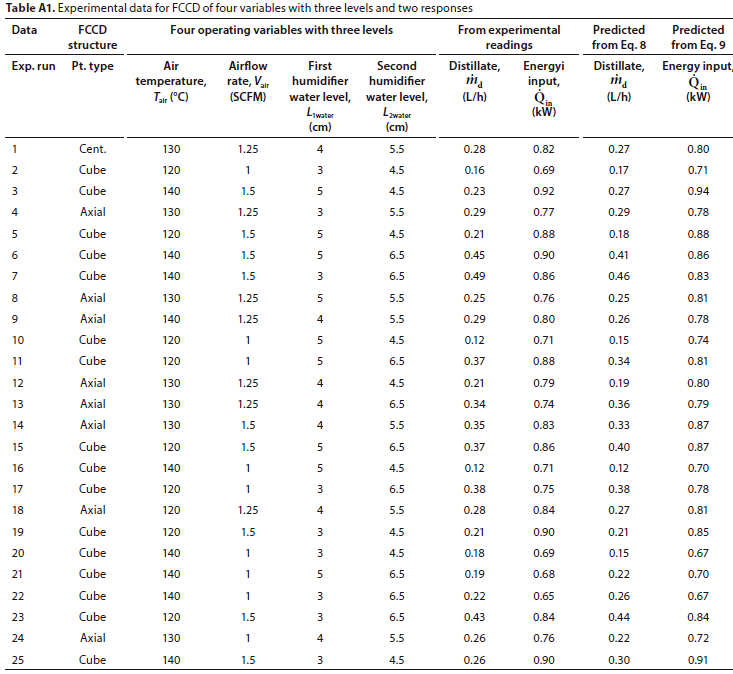
Table 4 shows the layout of the response surface factorial design method in which 4 operating parameters were used. The results of distillate and heat input were obtained from the experiments conducted according to the RSM design layout (Table A1, Appendix). The nature and range of obtained experimental data demanded the transformation of the model. First, the model analysis for productivity was executed each time based on adjusted R2 criteria for finding the best response equation. Analysis of variance (ANOVA) with R2, adjusted R2, and predicted R2 was utilized each time to decide the significant factor that affects the productivity equation. Hence, square root transformation with R2of 92%, adjusted R2 of 90% and predicted R2 of 81% were obtained as best-fit statistics for the case of distillate.
Equation 8 is used to estimate productivity in terms of input variables and their interaction.
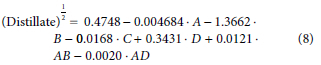
where A is inlet air temperature (°C), B is airflow rate (SCFM), C is water level in the first humidifier (cm), D is water level in the second humidifier (cm), AB is the interaction of inlet air temperature and airflow rate, and AD is the interaction of inlet air temperature and water level in the second humidifier. Equation 8 shows the regression equation in uncoded units which resulted in the dataset of experimental runs.
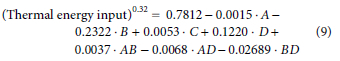
Similarly, for thermal input energy, the power model with A = 0.32 yields the best statistical results based on experimental data. Equation 9 shows thermal input energy with dependent variables and their interaction level.
The ANOVA results for the distillate are shown in Table 5. The model P-value of 34.88 implies that the model is significant and accurate. For the present study, B, C, D, AB and AD terms are significant model terms because the p-values of these terms are less than 0.05. Moreover, it can be observed that the model has an adjusted R2 of 92%, which means that 92% of the variation in productivity is captured by variations in airflow rate, air temperature, and the humidifier's water level. The model also has a standard deviation estimate of 0.0309, which measures the variation in the observed productivity from the regression line. The model predicted R2 of 81% measures the accuracy of the model. The model predicted a residual sum of squares (PRESS) of 0.39. PRESS is an overall measurement of the discrepancy between data and model estimation. The coefficient terms of the RS model (Eq. 8) show that the second humidifier's water level had the greatest positive effect on productivity, while the first humidifier's water level had a negative contribution to productivity. This contribution was mainly because air possesses less specific heat capacity than diffusivity which leads to rapid loss of heat compared to heat gain. In the same manner, Eq. 9 shows that airflow rate has the greatest effect on thermal energy while the first and second humidifier's water levels have modest effects on thermal energy input with a direct contribution. Productivity and thermal energy input calculated from response equations are compared with the experimental results in Fig. 3, indicating a very good match. The results are also tabulated in Table 4.
Effect of operating conditions on distillate production
The combined effects of airflow rate and air temperature on the distillate production rate are depicted in Fig. 4 (left) for a water level of 4 cm in the first humidifier and 5.5 cm in the second humidifier. Surface plot and contours show that the amount of freshwater increases with airflow rate since a higher mass flow rate of air can carry more vapour to condense in the dehumidifier. This is observed by the rise of the curve of distillate from 0.5 SCFM to 1.5 SCFM (maximum limit of the used air supply) for any value of air temperature. It is important to note that the effect of airflow rate on the rate of distillate production is more pronounced at high air temperatures. For example, when airflow rates increase from 1 SCFM to 1.5 SCFM, distillate production enhances by 4%, 18%, and 60% for air temperatures of 120°C, 130°C, and 140°C, respectively. Similarly, air temperature has a noticeable effect on distillate production, mostly at high airflow rates. The distillate rate is increasing proportionally with incoming air temperature for airflow rates above 1.1 SCFM. Increasing the temperature allows air to hold a higher amount of water vapour, which in turn increases the humidity of air leaving the humidifier. For an airflow rate of 1.5 SCFM, system productivity enhances by 24% with a temperature increment of 20°C. Thus, the higher temperature in combination with high airflow rates enhances the distillate production rate.
Figure 4 (right) indicates the combined effects of air temperature and water column level in the second humidifier on the distillate rate at an airflow rate of 1.5 SCFM and water column level of 4 cm in the first humidifier. The water level in the second humidifier has the greatest effect on freshwater production. Production is increasing quadratically from 0.22 L/h to 0.38 L/h with an increment of water level in the second humidifier from 4.5 cm to 6.5 cm. The higher water level in the humidifier is associated with the proper mixing of warm air with saline water and provides more contact time for the bubbles with the water column. So, a higher level of water in the humidifier improves mass transfer. Hence, efficient heat and mass transfer between heated air and water improves productivity with variations of water level inside the humidifier as explained earlier. The maximum distillate rate of 0.45 L/h is achieved for the two-stage HDH bubble-column system at 140°C air temperature and 6.5 cm of water level in the second humidifier with the airflow rate of 1.5 SCFM.
From the model equation of productivity (Eq. 8), the negative coefficient of water level in the first humidifier with productivity is monitored and depicts the adverse but insignificant effect on productivity. Due to the absence of the interaction term of water level of the first humidifier with other variables, single factorial plots are generated instead of surface plots, to analyse its effect on productivity, as shown in Fig. 5. From the productivity model and single factorial plots, it is observed that the variation of water level in the first humidifier is the factor that has the least effect on system performance. This is because reheating air in the second stage in a closed cylindrical heater has diminished its effect. However, a lower water level in the first humidifier results in a minute increment in distillate rate. At low water levels, air leaves at higher temperatures. Then, it is heated again in the second stage where its temperature increases to higher values which leads to a higher distillate rate. Hence, keeping the water level low in the first humidifier increases the distillate as well as reduces the pressure drop of the air supply.
Effect of operating conditions on thermal energy input
Equation 9 predicts the effect of operating parameters on the thermal energy input of the system. It shows that thermal energy consumed by the system is affected by all parameters considered in this study (air temperature, water levels of both humidifiers, and airflow rate). The combined effects of airflow rate and air temperature on thermal energy input are presented in Fig. 6 (left), for fixed water levels inside both humidifiers. Total heat input increases almost linearly with airflow rate and exhibits a modest rise with air temperature. This is because a large volume of air requires more energy for a fixed outlet temperature. Hence, energy increases from 0.71 to 0.85 kW for an airflow rate of 0.5 SCFM increment. It is worth mentioning that energy input from the chiller is more than the energy required to heat air, because of the high mass flow rate of cooling water and its higher specific heat capacity compared to air. Therefore, the energy required for cooling (chiller) is dominant in the total heat input. The energy increment is about 15% for an air temperature rise of 20°C. Similarly, Fig. 6 (right) depicts the effect of changing the water level in the second humidifier on the required energy for different values of air temperature. At a low water level in the second humidifier, of 4.5 cm, air leaves the humidifier at a higher temperature. Therefore, the chiller exhibits higher energy consumption to keep the dehumidifier liquid column at a constant temperature. This is the reason why energy consumption is greater in magnitude at lower water levels inside the second humidifier.
The design of experiment with RSM helped to identify the important parameters to be considered for further analysis of system performance. Since the water level of the first humidifier, among other considered parameters, affects performance the least, further experiments were conducted by keeping the first humidifier water level constant at 5 cm. This has reduced the experimental time and data. GOR and SEC are analysed for airflow rates ranging from 0.5 SCFM to 1.5 SCFM, for 4 values of water level of the second humidifier (3.5 cm to 6.5 cm) at 4different air temperatures ranging from 110°C to 140°C.
Effect of operating conditions on GOR and SEC
Figure 7a and 7b present the GOR and SEC of the system plotted against the water level of the second humidifier (L2 water) ranging from 3.5 cm to 6.5 cm for fixed air temperature (Tair) of 140°C and water level of the first humidifier (L1water) at 5 cm. Since the high water level inside the second humidifier results in a higher rate of distillate, GOR is also higher at higher water levels and increases with the airflow rate. The maximum GOR is 0.4 for 1.5 SCFM at 6.5 cm water level. In addition, SEC exhibits a declining trend with airflow rates because of productivity. This trend may be attributed to the fact that at a high water level of the second humidifier, distillate production is higher and energy input is lower. At an airflow rate of 0.5 SCFM, SEC is 10 kWh/L, 11 kWh/L, and 22 kWh/L for water levels of 6.5 cm, 5.5 cm, and 4.5 cm, respectively. Since the SEC is defined as the ratio of energy input to distillate production rate, the highest value of distillate decreased the SEC by 81% (as compared to the maximum SEC) which is obtained at a flow rate of 1.5 SCFM and water level of 3.5 cm. The reduction of SEC is found to be significantly lower, by 29% and 22%, when the water level was at 5.5 and 6.5 cm - respectively having flow rates of 0.5 to 1.5 SCFM.
Similarly, Figs 7c and 7d depict the variations of GOR and SEC of the system against air temperature (Tair) ranging from 110°C to 140°C at a water level of the second humidifier (L2water) of 5.5 cm and a water level of the first humidifier (L1water) of 5 cm. GOR is greater at an air temperature of 140°C compared to 110°C because of higher yield at higher air temperatures. Maximum GOR of 0.3 is achieved at 1.5 SCFM and 140°C, and is 20% higher than the GOR achieved for 110°C at 1.5 SCFM. Variation of specific energy consumption against air temperature is significant for low airflow rates. No significant difference was observed in terms of magnitude of SEC for air temperatures of 120°C to 140°C. This is because of similar values for distillate and input energy measured at the three considered air temperatures. However, in general, lower temperature corresponds to lower energy input and less productivity, leading to higher SEC.
Optimum performance parameters
After identifying the significant operating parameters of the two-stage humidifier HDH system, it is essential to find the optimum conditions for a given range of datasets to identify maximum productivity for minimum thermal energy input. Numerical optimization is performed using Design-Expert software. Results are presented in the form of a ramp function as shown in Fig. 8a. Numerical optimization maximizes and minimizes the targeted response subject to upper and lower boundaries based on operating variables. Graphical representation of the ramp function indicates the value of operating conditions that yield maximum distillate rate along with requiring minimum thermal energy input. This feature combines individual graphs for easier interpretation. The dot on each ramp of operating parameters presents a response prediction of the present solution and the height of the dot indicates the desirability of factors. Results indicate that optimum operating parameters are: Tair = 139.9 °C, L2 water = 6.5 cm, L1water = 3 cm and Vair = 1.13 SCFM for optimum productivity of 0.3 L/h with energy consumption of 0.71 kW. The corresponding values of GOR and SEC for optimum operating parameters are 0.33 and 2.36 kWh/L, respectively. Similarly, Fig. 8b presents the desirability bar graph. The simulation program combines the individual desirabilities into a single number for prediction of the greatest overall desirability.
This simulation is based on 5 possibilities for a 'goal' to construct desirability indices (d). The goals are: maximize, minimize, target, in range, and, equal to (factors only). The present case's objective was to obtain maximum productivity and reduce energy consumption. A desirability value of '1' represents the ideal case, while that of 'zero' indicates that one or more responses fall outside desirable limits. Air temperature and water level in the second humidifier need to be maximized whereas airflow rate and water level in the first humidifier need to be minimized to obtain the desired optimum freshwater production and thermal energy input. Table 6 shows the optima for this study using design space.
CONCLUSION
The performance of a novel two-stage humidification HDH air-heated cycle with bubble-column humidifier and dehumidifier was investigated experimentally and optimized to achieve the best productivity with lowest possible energy input. Effects of operating parameters such as air temperature, airflow rate, and water level inside the humidifiers on the system's freshwater productivity, energy input, GOR, and SEC were analysed in order to choose significant parameters for optimization. Response surface methodology was utilized for the design of experiments and data analysis. Prediction of distillate and input energy through regression showed an excellent match with experimental data. Among the considered operating parameters, air temperature and the water level inside the second humidifier show significant and positive effects on the distillate production rate. However, no significant effect was observed for the variation of water level inside the first humidifier. The maximum distillate collected is 0.45 L/h at 140°C air temperature and 6.5 cm of water level in the second humidifier with an airflow rate of 1.5 SCFM. Heat input increases linearly with airflow rate, but has a modest increment with air temperature. Nevertheless, the water level inside the second humidifier has an adverse effect on energy input. The maximum energy consumption of the system is 0.93 kW at 4.5 cm of water level inside the second humidifier and 140°C with an airflow rate of 1.5 SCFM. GOR increases with the increase in airflow rate, second humidifier water level, and air temperature, while SEC decreases with these conditions. The maximum GOR of the system, of 0.4, is achieved at 1.5 SCFM and 6.5 cm of water level at 140°C. Through optimization, optimum operating parameters are 139°C air temperature, 6.5 cm of water level of the second humidifier, 3 cm of water level of the first humidifier, and airflow rate of 1.13 SCFM. These optimum conditions give maximum distillate of 0.3 L/h with minimum energy consumption of 0.71 kW.
AUTHOR CONTRIBUTIONS
Majid Khan, conducting the experiments, and writing paper draft.
M Faizan, writing paper drafts, review part, and presentation of results.
Mohamed A Antar, supervising the work, discussion of results, revision of the paper.
Atia E Khalifa, sharing in the supervision of the experimental work, uncertainty analysis, and shared writing the manuscript.
CONFLICT OF INTEREST
The Authors would like to declare that this work has no conflict of interest with any entity.
SYMBOLS
cp Specific heat capacity (J/(kg ■ K))
p Water density (kg/m3)
D Bubble-column diameter (m)
H Specific enthalpy (J/kg)
hfg Enthalpy of vaporization (J/kg)
L Water level (m)
m Mass flow rate (kg/s)
Q Heat flow/heat input (kW)
T Temperature (°C)
T Time (s)
SUBSCRIPTS
2 Second bubble-column humidifier
1 First bubble-column humidifier
DH Dehumidifier
H Humidifier
ACRONYMS
ANOVA Analysis of variance
BC Bubble column
CCD Central composite design
FS Full scale
GOR Gained output ratio
HE Heat exchanger
HDH Humidification dehumidification
PRESS Predicted residual sum of squares
RSM Response surface methodology
SEM Specific energy consumption (kWh/L)
REFERENCES
ABDELKADER B, KHAN M and ANTAR MA (2020) Performance of bubble column humidification-dehumidification (HDH) desalination system. Desalin. Water Treat. 181 101-112. https://doi.org/10.5004/dwt.2020.25105 [ Links ]
ABD-UR-REHMAN HM and AL-SULAIMAN FA (2017) A novel design of a multistage stepped bubble column humidifier for the humidification of air. Appl. Therm. Eng. 120 530-536. https://doi.org/10.1016/j.applthermaleng.2017.04.021 [ Links ]
AHMADITABA AH, AFSHARI E and ASGHARI S (2018) An experimental study on the bubble humidification method of polymer electrolyte membrane fuel cells. Energ. Source Part A 40 1508-1519. https://doi.org/10.1080/15567036.2018.1477877 [ Links ]
ANTAR MA, ABD-UR-REHMAN H and AL-SULAIMAN FA (2016) Experimental analysis of solar driven multi stage stepped bubbler humidifier for humidification dehumidification (HDH) water desalination system. Proceedings of the ASME 201610th International Conference on Energy Sustainability collocated with the ASME 2016 Power Conference and the ASME 2016 14th International Conference on Fuel Cell Science, Engineering and Technology. Volume 1, 2016. https://doi.org/10.1115/ES2016-59209 [ Links ]
BEHNAM P and BEHSHAD M (2016) Examination of a solar desalination system equipped with an air bubble column humidifier, evacuated tube collectors and thermosyphon heat pipes. Desalination 397 30-37. https://doi.org/10.1016/j.desal.2016.06.016 [ Links ]
BEN HALIMA H, FRIKHA N and GABSI S (2017) Experimental study of a bubble basin intended for water desalination system. Desalination 406 10-15. https://doi.org/10.1016/j.desal.2016.08.003 [ Links ]
CHANG KH, LI MK and WAN H (2014) Combining STRONG with screening designs for large-scale simulation optimization. IIE Trans. 46 357-373. https://doi.org/10.1080/0740817X.2013.812268 [ Links ]
EDER E and PREIfiINGER M (2020) Experimental analysis of the humidification of air in bubble columns for thermal water treatment systems. Exp. Therm. Fluid Sci. 115 110063. https://doi.org/10.1016/j.expthermflusci.2020.110063 [ Links ]
EL-AGOUZ SA (2010) Desalination based on humidification-dehumidification by air bubbles passing through brackish water. Chem. Eng. J. 165 413-419. https://doi.org/10.1016/j.cej.2010.09.008 [ Links ]
FAEGH M, BEHNAM P and SHAFII MB (2019) A review on recent advances in humidification-dehumidification (HDH) desalination systems integrated with refrigeration, power and desalination technologies. Energ. Convers. Manage. 196 1002-1036. https://doi.org/10.1016/j.enconman.2019.06.063 [ Links ]
FRANCIS MJ and PASHLEY RM (2010) Thermal desalination using a non-boiling bubble column. Desalin. Water Treat. 12 155-161. https://doi.org/10.5004/dwt.2009.917 [ Links ]
GAO P, ZHANG M, DU Y, CHENG B and ZHANG D (2018) Study on bubble column humidification and dehumidification system for coal mine wastewater treatment. Water Sci. Technol. 77 1909-1919. https://doi.org/10.2166/wst.2018.072 [ Links ]
GHAZAL MT, ATIKOL U and EGELIOGLU F (2014) An experimental study of a solar humidifier for HDD systems. Energ. Convers. Manage. 82 250-258. https://doi.org/10.1016/j.enconman.2014.03.019 [ Links ]
LAWAL DU and QASEM NA (2020) Humidification-dehumidification desalination systems driven by thermal-based renewable and low-grade energy sources: A critical review. Renew. Sust. Energ. Rev. 125 109817. https://doi.org/10.1016/j.rser.2020.109817 [ Links ]
GARG K, BENIWAL R, DAS SK and TYAGI H (2023) Experimental investigation of a low-cost humidification-dehumidification desalination cycle using packed-bed humidifier and finned-tube heat exchanger. Thermal Sci. Eng. Progress 41 2023 101858. https://doi.org/10.1016/j.tsep.2023.101858 [ Links ]
KHALIFA AE and LAWAL DU (2015) Performance and optimization of air gap membrane distillation system for water desalination. Arab. J. Sci. Eng. 40 3627-3639. https://doi.org/10.1007/s13369-015-1772-0 [ Links ]
KHALIFA A and LAWAL DU (2016) Application of response surface and Taguchi optimization techniques to air gap membrane distillation for water desalination-A comparative study. Desalin. Water Treat. 57 1-18. https://doi.org/10.1080/19443994.2016.1189850 [ Links ]
KHALIL A, EL-AGOUZ SA, EL-SAMADONY YA and ABDO A (2015) Solar water desalination using an air bubble column humidifier. Desalination 372 7-16. https://doi.org/10.1016/j.desal.2015.06.010 [ Links ]
KIRKUP L and FRENKEL R (2006) An Introduction to Uncertainty in Measurement: Using the GUM (Guide to Expression of Uncertainty Measurement). Cambridge University Press, New York. 229 pp. [ Links ]
NARAYAN GP and SHARQAWY MH (2013) Bubble columns for condensation at high concentrations of noncondensable gas: heattransfer model and experiments. AIChE J. 59 215-228. https://doi.org/10.1002/aic.13944 [ Links ]
NARAYAN GP, SHARQAWY MH, SUMMERS AK, LIENHARD JH, ZUBAIR SM and ANTAR MA (2010) The potential of solar-driven humidification-dehumidification desalination for small-scale decentralized water production. Renew. Sust. Energ. Rev. 14 11871201. https://doi.org/10.1016/j.rser.2009.11.014 [ Links ]
PATEL V, PATEL R and PATEL J (2020) Theoretical and experimental investigation of bubble column humidification and thermoelectric cooler dehumidification water desalination system. Int. J. Energy Res. 44 890-901. https://doi.org/10.1002/er.4931 [ Links ]
RAJASEENIVASAN T, SHANMUGAM RK, HAREESH VM and SRITHAR K (2016) Combined probation of bubble column humidification dehumidification desalination system using solar collectors. Energy 116 459-469. https://doi.org/10.1016/j.energy.2016.09.127 [ Links ]
RAJASEENIVASAN T and SRITHAR K (2017) An investigation into a laboratory scale bubble column humidification dehumidification desalination system powered by biomass energy. Energ. Convers. Manage. 139 232-244. https://doi.org/10.1016/j.enconman.2017.02.043 [ Links ]
SCHMACK M, HO G and ANDA M (2013) A novel passive condenser for small-scale water desalination. Ozwater'13, Perth, 7-9May 2013. Australian Water Association. [ Links ]
SHARQAWY MH, ANTAR MA, ZUBAIR SM and ELBASHIR AM (2014) Optimum thermal design of humidification dehumidification desalination systems. Desalination 349 10-21. https://doi.org/10.1016/j.desal.2014.06.016 [ Links ]
SRITHAR K and RAJASEENIVASAN T (2017) Performance analysis on a solar bubble column humidification dehumidification desalination system. Process Saf. Environ. Prot. 105 41-50. https://doi.org/10.1016/j.psep.2016.10.002 [ Links ]
TASEIDIFAR M, SHAHID M and PASHLEY RM (2018) A study of the bubble column evaporator method for improved thermal desalination. Desalination 432 97-103. https://doi.org/10.1016/j.desal.2018.01.003 [ Links ]
TOW EW and LIENHARD JH (2013) Heat flux and effectiveness in bubble column dehumidifiers for HDH desalination. IDA World Congr. Desalin. Water Reuse. 14. [ Links ]
ZHANG L, CHENG G and GAO S (2011) Experimental study on air bubbling humidification. Desalin. Water Treat. 29 258-263. https://doi.org/10.5004/dwt.2011.1958 [ Links ]
 Correspondence:
Mohamed A Antar
Email: antar@kfupm.edu.sa
Received: 31 July 2022
Accepted: 13 September 2023
APPENDIX

