


Servicios Personalizados
Articulo
 Inglés (pdf)
 Articulo en XML
 Referencias del artículo
Indicadores

Links relacionados
-
 Citado por Google
 -
 Similares en Google
Compartir

 Permalink
Water SA
versión On-line ISSN 1816-7950
versión impresa ISSN 0378-4738
Water SA vol.49 no.4 Pretoria oct. 2023
http://dx.doi.org/10.17159/wsa/2023.v49.i4.3935
RESEARCH PAPER
The effects of deficit irrigation on water use efficiency, yield and quality of drip-irrigated tomatoes grown under field conditions in Zimbabwe
Godfrey MuroyiwaI; Emmanuel MashonjowaI; Teddious MhizhaI; Maud MuchuwetiII
IDepartment of Space Science and Applied Physics, University of Zimbabwe, Harare, Zimbabwe
IIDepartment of Biotechnology and Biochemistry, University of Zimbabwe, Harare, Zimbabwe
ABSTRACT
Water availability in the root zone directly affects the yield and quality of tomatoes yet in most cases in sub-Saharan Africa water is either expensive or scarce. It is therefore important to establish and utilise suitable irrigation strategies in order to produce the crop in a sustainable way. In this study the effect of conventional and deficit irrigation treatments on yield, fruit quality and water use efficiency (WUE) were determined. Four trials were conducted at the University of Zimbabwe Farm from 2014-2017 with four treatments per trial: T1 = 100%, T2 = 80%, T3 = 60%, and T4 = 50% of crop water requirements (ETc). Treatments had equal number of plants per trial with an in-row plant spacing of 0.3 m and 0.5 m between adjacent rows. ETc was determined daily for each treatment and the corresponding volume applied through one drip emitter per plant. Fruits from each treatment were gathered while ripening and the total yield obtained. WUE was calculated by dividing the total fresh yield by total irrigation water applied. Maximum yield was obtained where 100% ETc was applied, with no significant difference between yield of plants at 80% and 60% ETc, except in 2016. Yield decreased with 50% ETc in 2014, 2015, and 2017 with no significant difference in yield between 60% and 50% ETc treatments in 2016. The 2015 season recorded the highest yield when compared to other trials showing that we can save 40% of water resulting in high WUE with minimum loss in yield. Deficit irrigation reduced fruit water but increased fruit soluble solids (°brix), vitamin C and fruit acid concentrations. Firmness was best when 60% ETc was applied. These results show that deficit irrigation is feasible for crop water management options for the production of high-quality field-grown tomatoes without major yield reductions.
Keywords: tomato, deficit irrigation strategies, quality, yield, water use efficiency
INTRODUCTION
A significant challenge for agriculture is to provide the world's growing population with a sustainable and secure supply of sufficient, safe, nutritious food that meets dietary needs and food preferences for an active and healthy life (Taisheng et al., 2015). Tomatoes are one of the most consumed vegetables worldwide because of their high nutritional value (Opiyo and Ying, 2005). It is a rich source of minerals, vitamins, organic acids, essential amino acids and antioxidants (Toor et al., 2006; SaviC et al., 2008; Erba et al., 2013). Tomatoes are considered a 'super food' because they are nutrient dense but also are a naturally low-calorie food. Firstly, 110 g tomato supplies about one-third of the recommended daily allowance for vitamin C, and contains beta-carotene, potassium, folic acid, vitamin B2, iron, and fibre. In recent years, studies have suggested that since tomatoes are the leading source of lycopene, (a powerful antioxidant), their consumption may lower the risk of many forms of cancer and protects against oxidative damage to lipids, proteins, and DNA in the human body (De Pascale et al., 2001; Massot et al., 2010; Al-Amri, 2013). Tomatoes do not lose their health benefits as they are processed and cooked. In fact, lycopene in cooked and processed tomatoes (sauce, paste, salsa, canned tomatoes) is more easily absorbed than from fresh tomatoes. This fact, along with its popularity as a high value monetary crop, makes the crop a potential leading nutritional source in the Zimbabwean diet, while also offering great potential to create employment opportunities and increase the income of participants involved in the tomato value chain through commercialization.
Water plays a crucial role in determining the yield and quality of tomato and good productivity requires availability of water throughout the cycle, as the crop is very sensitive to water stress (Lopes et al., 2005). The seasonal water requirement for tomatoes is 300-600 mm (Schwah et al., 1993). In Zimbabwe the crop is cultivated where climatic conditions are favourable, and to a large extent by smallholder farmers under rain-fed production systems. However, the agriculture sector in Zimbabwe has been affected by the increasing scarcity of water due to global climate change, induced variability in rainfall patterns, the increasing competition for water resources between agriculture and other sectors and rising cost of water utilization (Brown et al., 2012). Adoption of water-saving strategies and new innovations to produce the best fruit quality and yield with the use of minimum amounts of water is therefore needed. Amongst the various irrigation practices, deficit irrigation seems to have the most important role for crop production under water shortage. Deficit irrigation, defined as the application of water below full crop-water requirements (Ferreres et al., 2007), is one strategy that has been suggested to have potential for maintaining crop yields and total soluble solids (TSS) using less water, and hence maximizing water use efficiency (WUE, kg/m3), defined as the crop evapotranspiration (ETc) divided by the total amount of water supplied through irrigation and rainfall, i.e., irrigation water productivity = yield/irrigation applied (Fernandez et al., 2020). Deficit irrigation can be used for tomato without reduction in yield and also improves fruit quality parameters, such as the content of sugar and antioxidant components (Favati et al., 2009; Monte et al., 2013).
When deficit irrigation is properly applied, the technique shows a greater potential to increase WUE, especially in areas of low water availability (Meric et al., 2011; Lorite et al., 2007). Furthermore, Ripoll et al. (2014) noted that temporary stresses from water shortage through deficit irrigation applied near fruit ripening stage had the greatest positive influence on glucose and fructose accumulation in tomato fruits. Appropriate deficit irrigation has also been found to increase contents of lycopene, vitamin C and beta-carotenoid in tomato fruits (Favati et al., 2009; Patanè and Cosentino, 2010). Research has shown that when deficit irrigation compared to full or sprinkler irrigation is applied together with N-fertilizer in solution, an increase in total soluble solids (TSS) in tomato is observed (Wang et al., 2015) and the drip irrigation favours more uniform water distribution in the tomato plant, increased plant yield and reduced evapotranspiration (Ozbahce and Tari, 2010). In addition, the pumping under drip irrigation unlike full or sprinkler irrigation requires less energy and potentially minimizes negative irrigation impacts on soil such as waterlogging or erosion and facilitates the use of fertigation (Nascimento et al., 2009). Grewal et al. (1990) showed that the difference between soil moisture held at field capacity and the wilting point (total available soil water), governs amongst other factors, the growth of a plant. Hence knowledge of the soil water content at field capacity and wilting point becomes important for the assessment of plant water requirements, irrigation scheduling and the prediction of crop responses to irrigation (Grewal et al., 1990).
In this study the effect of deficit irrigation versus conventional irrigation on crop water stress, fruit growth, yield, fruit quality and WUE were determined for a drip-irrigated tomato crop under field conditions in Zimbabwe.
MATERIALS AND METHODS
Experimental site
The field trials were conducted from 2014 to 2017 at the University of Zimbabwe Farm Teaching and Research Site (Thornpark Station), located 20 km north of Harare at coordinates 17° 42' S and 31° 04' E and 1 479 m asl. The site falls into Natural Region Ila of the agro-ecological zones of Zimbabwe and receives a mean annual rainfall of 800-1 000 mm (Mhizha, 2010). Data from the Zimbabwe Meteorological Services Department for Harare (37 years from 1981-2018 (ZMSD, 2018)) gives a mean monthly minimum temperature of 7°C for July and June, and mean monthly maximum temperature of 28°C for November (Table 1). Rainfall occurs mainly from November to March. The other months are relatively dry.
The land is relatively flat with slopes of 2% or less. It has deep to moderately deep well-drained red soils. The soil type is coarse sandy clay loam and has a water-holding capacity of about 704 mm up to a depth of 0.8 m. The total available water is 12% (v/v) (Mhizha et al., 2014).
Rainfall and temperature pattern during the trial period
From an automatic weather station at the experimental site, analysis of the data for the 4 years from 2014-2017 showed the trends in the mean monthly maximum and minimum temperatures, monthly average rainfall, the growing degree days for the month and the mean monthly evapotranspiration (ETo) (Table 2).
Planting material
The plants selected for the trials were commercial tomato (Solatium lycopersicum L.) of the variety Galina for Trials 1, 3 and 4, and the variety Shanty for Trial 2 (Table 3). The crops were planted with a spacing of 0.3 m between plants and 0.5 m between rows.
Treatments and irrigation scheduling
Four irrigation trials were applied with 4 treatments in each trial for 2014, 2015, 2016 and 2017 (Table 3). Each treatment had an equal number of plants per trial, but the total number of plants differed for each trial in successive years. This was due to a number of problems encountered during trials, such as disease outbreak, and some of the trials could not be completed. Comparisons were therefore only done between treatments and not between trials for different years. A minimum of 3 replicates per irrigation treatment were done in order to enable statistical analysis for significant differences.
Treatments received different amounts of irrigation, based on the percentage of crop water requirement (ETc), namely, Treatment 1: 100% ETc (full irrigation), Treatment 2: 80% ETc, Treatment 3: 60% ETc, Treatment 4: 50% ETc. A minimum of 3 replications per treatment was done. The crop water requirements are defined as the depth of water needed to meet the water loss from the ETo in mm/day (Brouwer and Heibloem, 1986).
The estimation of crop water requirements for the day during growing seasons was determined from the crop evapotranspiration (ETc) that was calculated from reference evapotranspiration (ETo) and the recommended crop coefficient for tomato (Allen et al., 1998; Brouwer and Heibloem, 1986; Doorenbos and Pruitt, 1977). The FAO 56 Penman-Monteith equation was used to calculate ETo. The ETo was multiplied by the published crop coefficient (Kc) for tomato crops (Table 4) to determine the daily ETc:

The ETo was computed using standard climatological records of solar radiation, air temperature, humidity and wind speed measured by an automatic weather station (AWS) set up in the centre of an open space at the experimental site. The AWS components included a rain gauge, pyranometer, wind speed and direction, and temperature and relative humidity sensors (Table 5).
All the measurements were automatically recorded by the data logger (model CR23X, Campbell Scientific Ltd., Shepshed, UK) every 5 s and averaged over 30 min. At the beginning of each day the crop water requirement of the previous day determined for each treatment was given according to each treatment and applied using a single dripper line with emitters spaced 30 cm apart and with one drip emitter per plant.
A customised drip irrigation system was used with one drip emitter per plant. The emitter rate was obtained for each treatment by placing four 1 000 mL measuring cylinders at random along the length of each drip line and determining the volume obtained after 1 h. All water valves were opened at once and the drip rate was determined for 1 h, then 3 treatments were closed and 1 was left open and, finally, 2 treatments were closed and the other 2 left open as the drip rate was determined. The emitter rate was used to determine the time needed to give each treatment its crop water requirement. The drip emitter rate from the manufacturer's specifications was 1.7 L/h on a horizontal piece of land, but the average emitter rates for Treatments 1 and 2 were 1.3 and 1.2 L/h, respectively, due to the slope of the land, and Treatments 3 and 4 had lower drip rates, of 1.1 and 0.9 L/h, respectively, due to the land elevation, as water was pushing against gravity.
Irrigation and fertilization management was done through manual stop valves on each drip line and a fertigation station using electronic irrigation valves. Water was drawn from a 100 m deep borehole into a 1 000 L tank using a 100 m 3-phase borehole submersible high pressure water pump. From the 1 000 L tank, water would pass through a domestic water meter placed in the main irrigation line per treatment, where a record of the amount of water used for irrigation would be obtained in cubic metres.
Agronomie practices and disease management
Agronomic practices and pest and disease management were done according to grower recommendations (Tables 6 and 7).
From transplant to flowering, copper oxychloride and Dithane M-45 were alternated. This was repeated on a weekly basis until harvest. As a preventative measure before the start of a trial, copper oxychloride and Dithane M-45 were used.
Plant growth, yield and fruit quality
From transplant to harvest, the leaf to air temperature difference, canopy, shoot and fruit growth were monitored, whereas fruit mass was measured at harvest.
Canopy temperatures were measured with fine chromel-alumel thermocouples (Type K) and copper-constantan thermocouples (Type T) 0.2 mm in diameter attached to the 'under' side of the leaf by plastic paper clips. The thermocouples were calibrated against a platinum resistance thermometer in a constant temperature water bath model YCW-04M (11 L) manufactured by Gemmy Industrial Corporation and a Grant water bath type LTD8G from Thomas Scientific, over a temperature range of 2°C to 95°C at 5°C intervals. The measurements were performed randomly on 10 plants within each treatment at a height of about 300 mm from the soil on 3 leaves for each plant. The measurements obtained for each leaf were then used to calculate the average for each treatment to obtain the canopy to air temperature difference (CATD; Tc-Ta). All measurements were automatically recorded by a datalogger (model CR23X, Campbell Scientific Ltd., Shepshed, UK) every 5 sz and averaged over 30 min.
Canopy and shoot growth were monitored visually from photographs taken on a weekly basis on the trial and comparisons done to estimate the growth rate between the treatments. Fruit diameter for tomato (Galina variety) was measured once every week for 10 fruits tagged per treatment using digital Vernier callipers, and this was done for all of the trials. During the ripening period, the fruits were harvested from each treatment and the mass of fruit and total yield was recorded using an electronic balance with an accuracy of 0.01 decimal places. The WUE was calculated by dividing the total fresh yield by total water use or effective irrigation water applied, which is the amount of water that reaches the root zone and is available to the plant (Yang et al., 2017) and was calculated using Eq. 2:

Several fruit maturity indicators were determined at harvest. Twenty tomatoes were randomly selected from each treatment, placed in cheesecloth and pressed to obtain juice for chemical quality measurements. This process was carried out 3 times such that 3 replicates for each treatment were measured. The pH, vitamin C concentration, total soluble solids and total acidity of the juice was then determined according to the following procedures:
• pH: the meter was first calibrated with buffer solutions of pH 4 and pH 7. After calibration, readings were then taken.
• Vitamin C: volume of the tomato juice required to decolorize a solution of DCPIP was measured and the results calibrated by comparison with a known concentration of vitamin C.
• Total soluble solids (°Brix): Measurements were taken with a hand refractometer (N1, Atago, Tokyo, Japan). The refractometer was calibrated by placing a drop of distilled water on the rectangular area and closing it with a cover. A dark area was visible on the scale inside the eyepiece. The calibration screw was turned until the shadow fell on the zero mark. The juice extracted was filtered and a drop placed on the rectangular area and measurements were taken through a graduated eyepiece and read off as °Brix.
• Total acidity: was determined by titrating a known volume of tomato juice with 0.1 N NaOH (sodium hydroxide) to an end point of pH = 8.2, as indicated by phenolphthalein indicator. NaOH is added to the juice until the pH changes to 8.2. The millilitres of NaOH needed was then used to calculate the total acidity.
• Firmness: Random samples of uniform size and temperature were selected and measurements were obtained using a 5 mm flat-tipped probe. The probe is applied perpendicularly at 10 mm/s to the end of each fruit, using a rheometer (LF Plus, Lloyd Instruments Ltd., England). Firmness results are reported as the mean force (N) of penetration.
RESULTS AND DISCUSSION
Crop water stress
Figures 1, 2 and 3 show the canopy to air temperature difference (CATD) for 2014, 2015 and 2016 on selected days picked at random. Shoot growth and canopy development corresponded to water deficits and there was minimal development at 60% and 50% ETc, showing that at higher deficits vegetative growth is reduced, whilst there is an increase in fruit size and fruit number, as confirmed by Prichard et al. (2010), on the basis of successful deficit irrigation.
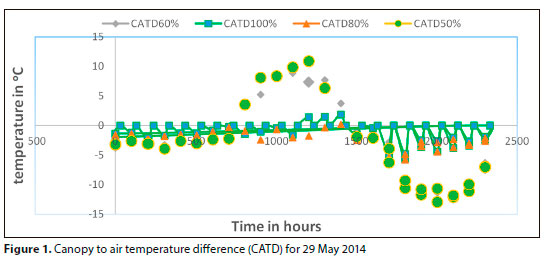


The CATD in Fig. 3 shows that deficits at 50% and 60% ETc exhibited a high rate of stress in contrast to treatments at 80% and 100% ETc, which showed minimum stress based on their response during the day and night, and this is similar to findings by Erdem et al. (2006).
Figures 4 to 6 show variations in vapour pressure deficit (VPD) plotted against CATD for different days: a cloudy day (Fig. 4), a partly cloudy day (Fig. 5) and a clear day (Fig. 6). Series 1 is CATD and Series 2 is VPD.
A plot of VPD versus CATD shows that the plants were highly stressed during a clear day; less stress was experienced on a partly cloudy day and no water stress on a cloudy day. Values of VPD greater than 1.5 kPa showed the potential of air for holding more water vapour, enabling plants to transpire more, but at very high VPD of between 3.0 kPa and 7.0 kPa the tomato plant displayed poor growth.
But on a typical hot day, as shown in Fig. 7, there is high evapotranspiration, as shown by a high VPD with a maximum of 4.92 kPa, with irradiance at 1.32 kW/m2 being obtained towards midday and values of CATD at -8.71°C obtained towards midday. The plants appeared to be highly stressed and transpiration almost came to standstill for 50% and 60% CWR. Iraqi et al. (1995) reported that a VPD of 0.8 kPa during the day and night increased photosynthetic rates and tomato fruit yields compared to plants grown with a VPD of 0.5 kPa.

Crop water stress derived from CATD (Tc-Ta), versus the VPD, was found to be a promising tool for quantifying crop water stress and hence the amount of water to be applied for irrigation (Jackson et al., 1981; Idso, 1982). The crop water stress is determined by empirical methods based on relating the leaf-air temperature difference (Tc-Ta) to the air vapour pressure deficit to develop a non-water-stressed baseline equation and consequently the crop water stress index (CWSI). The CWSI is calculated using Eq. 3:

where Tc is the canopy temperature, Tm is the minimum temperature (air temperature under well-watered conditions), Td is the maximum temperature (air temperature under completely stressed conditions.
To determine amount of water to be applied based on the CWSI, a critical threshold is established. This threshold represents the desired level of water stress that the crop can tolerate before experiencing significant yield reductions. If the CWSI exceeds the critical threshold, then the crop is under stress and, conversely, if it is below the threshold then the crop is well watered. Using the non-water-stressed baseline on data collected frequently through the growing season, CWSI values may provide a valuable tool for monitoring water status and planning irrigation scheduling, and hence farmers can make informed decisions on optimising irrigation scheduling and make use of water efficiently.
Therefore, CATD could be used as a guide to irrigation scheduling through the use of crop water stress index, which is a measure of the relative transpiration rate occurring for a plant at the time of measurement, and is calculated by using a measure of the canopy temperature of a plant (Tc) and the VPD (Jackson et al., 1981). The relationship between CATD (Tc-Ta) and VPD is then used to develop a non-stressed baseline equation and consequently the crop water stress index (CWSI) (Alderfasi et al., 2001).
Fruit growth measurements
The average fruit size obtained (Fig. 8) in all trials was similar for Treatments 1, 2 and 3 but with variation in Treatment 4. Highest fruit growth was shown at 100% ETc and treatments with deficit at 50% had the smallest fruit size. Deficits at 60% and 80% showed no significant difference in fruit size. The trial for 2016 showed slight deviations in growth, as shown by their coefficient of determination, but the 2015 and 2017 trials showed similar patterns for all their treatments. For the 2014 trial there was no significant difference between the results of the four treatments. Results for fruit growth showed maximal growth after 63 days from transplant in all treatments. Fruit growth at 100% ETc would be best for the consumer market with a preference for large size but the fruit with a smaller diameter at 50% may well be considered for the juice industry.
There was no significant difference in fruit growth for all the trials in 2014 according to Duncan's multiple range test (*) (p < 0.05) and the error bars showing overlapping standard errors..
Irrigation water applied
Seasonal cumulative water use (m3/ha) for each treatment from transplanting until late season stage of harvesting is shown in Table 8. The values tally with the seasonal volumes obtained by Favati et al. (2009), with values ranging from 2 155 to 4 645 m3/ha, and by Jintao et al. (2019), with values ranging from 106 to 203 cm3/single fruit. Due to the number of plants per treatment which differed between trials and the disease outbreaks the amount of water used for irrigation was not the same.
Yield
Table 9 shows the yield for the different treatments per trial. The fruit yield obtained ranged from 10.4 to 78.5 t/ha and was similar to values obtained by Favati et al. (2009), which ranged from 22.22 to 76.32 t/ha. Maximum yield was obtained where 100% ETc was applied, with no significant difference between yield of plants where 80% and 60% ETc was applied, except in 2016. A further reduction in yield occurred where irrigation was applied at 50% ETc in 2014, 2015 and 2017, with no significant difference between the 60% and -50% ETc treatments in 2016. The 2015 season had the highest yield when compared to other trials. This could have been attributed to the tomato variety (Shanty) which was used in 2015, whereas Galina was used for the other three trials.
Fruit quality parameters
With regards to the effect of different irrigation treatments on vitamin C content, no significant difference was observed between 50% and 80%, and with values at 60% and 100% not being significantly different but being lower than the vitamin C content for 50% and 80% (Table 10). Comparison of vitamin C for all the trials (Table 10) showed that vitamin C increases with an increase in water stress; other studies have shown that vitamin C increased as a result of soil water depletion, even if it seems to be cultivar dependent (Dumas et al., 2003; Mahajan and Singh, 2006; Mitchell et al., 1991b; Favati et al., 2009). The vitamin C content of tomatoes depends on the season, the nutrients available and the environment, and the mean values currently recorded range from 150 to 230 mg/kg (Dumas et al., 2003). There appears to be a relationship between high vitamin C levels and low crop water use (Favati et al., 2009).
The quality parameters (Table 10) tally well with those obtained by Favati et al. (2009), with the minor variations due to differences in the tomato variety.
Sugar accumulation (°Brix) dropped at Treatment 2, (80% deficit irrigation) then increased relative to increase in deficit irrigation. There was no significant difference in pH for all treatments, although there were minor differences for treatments at 50% and 60% as compared to 100% and 80% ETc. Some authors have also observed that there are no significant differences for pH in tomatoes under water deficit and well irrigated conditions (Tuzel et al., 1994; Favati et al., 2009).
Total acidity was observed to increase with an increase in water deficit (Table 10) and Favati et al. (2009) reported that generally there is an inverse relationship between pH and total acidity, although sometimes this relationship is imprecise (Garcia and Barret 2006a).
Severe deficit irrigation (50% ETc) increased the firmness of tomato fruit compared to mild deficit irrigation (80% ETc). There was no significant difference for deficit at 100% and 80%.
Water use efficiency
Table 11 shows the WUE for the different treatments in each trial. The highest WUE was obtained at 60% ETc for all the trials, with no significant difference at 80% ETc, and the lowest WUE was at 100% ETc. Seasons 2014 and 2017 had similar trends in significant differences, with no differences in 2016. The trend could have resulted from the outbreak of blight in the 2015 and 2016 seasons, and also the response of deficit irrigation to the environmental conditions of the particular year. These results tally with those obtained by Ahmed et al. (2015); Zegbe-Dominguez et al. (2006) and Saleh and Ozawa (2006) showing WUE of tomato reaching up to 65 kg/m3. Castilla (1996) reported WUE values of 34 kg/m3 for tomato production and Tuzel et al. (1994) reported WUE values ranging from 21.05 to 62.46 kg/m3.
CONCLUSIONS
Deficit irrigation treatments promoted an increase in WUE as compared with full irrigation and the differences between treatments were more marked under deficit conditions. For WUE, deficit at 60% ETc for all seasons would be an ideal for farmers to implement, and 50% would be good for income saving. Deficit irrigation showed that it could have positive effects on WUE, such as reduced water consumption and improved crop water productivity, and hence an improvement in the amount of agricultural output produced per unit of water consumed. There is stimulation of enhanced root development and stomatal control which reduces water loss through transpiration. While deficit irrigation may lead to a reduction in crop yields compared to full irrigation, it optimises yield per unit of water consumed and hence WUE can be achieved without a significant loss in yield and fruit quality. While yield of tomato is slightly affected by the irrigation treatments, the yield was higher for the treatment where the quantity of water applied was the greatest, i.e. 100% ETc, but proved to be costly in terms of the use of more water. Although deficit irrigation did not result in many significant differences in fruit quality parameters, it had some effects on pH, total acidity, vitamin C, firmness and Brix. An overview of the different approaches aimed at increasing vitamin C level, which include bio-engineering, genotype selection and, in this research, 'water stress' has shown that plants can enhance vitamin C synthesis as part of their defence mechanism. WUE is possible and with a tolerable loss of yield it can be attained without spending much water. With treatments from 60-80% ETc, a good yield of up to 23.1 t/ha can be obtained with WUE values of 40.0 kg/m3 being possible. This study has shown that irrigation at a reduced rate (60-80% ETc), produced beneficial effects on tomato fruit quality and yield, mostly in terms of total soluble solids, with interesting implications for the industry as the controlled water stress can enhance the concentration of desirable compounds such as sugars and antioxidants, leading to improved flavour profiles and nutritional value.
AUTHOR CONTRIBUTIONS
Conceptualization: G Muroyiwa, E Mashonjowa, T Mhizha, M Muchuweti. Methodology: G Muroyiwa, E Mashonjowa, T Mhizha, M Muchuweti. Data analysis: G Muroyiwa. Original draft preparation and writing: G Muroyiwa. Review and editing: G Muroyiwa, E Mashonjowa, T Mhizha, M Muchuweti. Supervision: E Mashonjowa, T Mhizha, M Muchuweti.
REFERENCES
ALDERFASI AA and NIELSEN DC (2001) Use of crop water stress index for monitoring water status and scheduling irrigation in wheat. Agric. Water Manage. 47 (1) 69-75. https://doi.org/10.1016/S0378-3774(00)00096-2 [ Links ]
ALLEN RG, PEREIRA LS, RAES D and SMITH M (1998) Crop evapotranspiration (guidelines for computing crop water requirements). FAO Irrigation and Drainage Paper. No. 56. FAO, Rome. 326 pp. [ Links ]
AHMED MSM, FARAG AA, ABDRABBO MAA, RADWAN HA, EL-MARSAFY MY and HASHEM FA (2015) Utilization of rice straw in tomato production under different levels of water requirements. Egypt. J. Agric. Resour. 93 (5) (A) 377. [ Links ]
AL-AMRI SM (2013) Improved growth, productivity and quality of tomato (Solanum copersicum L.) plants through application of shikimic acid. Saudi J. Biol. Sci. 20 339-345. https://doi.org/10.1016/j.sjbs.2013.03.002 [ Links ]
BROUWER C and HEIBLOEM M (1986) Irrigation water management: irrigation water needs. Training manual. FAO, Rome. [ Links ]
BROWN D, CHANAKIRA RR, CHATIZA, DHLIWAYO M, DODMAN D, MASIIWA M, MUCHADENYIKA D, MUGABE P and ZVIGADZA S (2012) Climate change impacts, vulnerability and adaptation in Zimbabwe. International Institute for Environment and Development. IIED Climate Change Working Paper No. 3. URL: https://www.jstor.org/stable/resrep01235.6 [ Links ]
CASTILLA N (1996) Drip irrigation management and water saving in protected culture. Advanced short course. Irrigation Fertilizer Management and Soilless Culture Under Protected Agriculture, 10-17 October 1996, Agadir-Morocco. 83-112. [ Links ]
DE PASCALE S, MAGGIO A, FOGLIANO V, AMBROSINO P and RITIENI A (2001) Irrigation with saline water improves carotenoids content and antioxidant activity of tomato. J. Hortic. Sci. Biotechnol. 76 (4) 447-453. https://doi.org/10.1080/14620316.2001.11511392 [ Links ]
DOORENBOS J and PRUIT WO (1977) Guidelines for predicting crop water requirements. FAO Irrigation and Drainage Paper 24. FAO, Rome. [ Links ]
DUMAS Y, DADOMO M, DI LUCCA G and GROLIER P (2003) Effects of environmental factors and agricultural techniques on antioxidant content of tomatoes. J. Sci. Food Agric. 83 369-382. https://doi.org/10.1002/jsfa.1370 [ Links ]
ERBA D, CASIRAGHI MC, RIBAS-AGUSTÍ A, CÁCERES R, MARFÀ O and CASTELLARI M (2013) Nutritional value of tomatoes (Solanum lycopersicum L.) grown in greenhouse by different agronomic techniques. J. Food Compos. Anal. 31 (2) 245-251. https://doi.org/10.1016/j.jfca.2013.05.014 [ Links ]
ERDEM Y, ERDEM T, ORTA AH and OKURSOY H (2006) Canopy-air temperature differential for potato under different irrigation regimes. Acta Agric. Scan. B Soil Plant Sci. 56 (3) 206-216. https://doi.org/10.1080/09064710510029187 [ Links ]
FAO (Food and Agriculture Organization of the United Nations) (1986) Influence of crop type on crop water needs (Kc). Chapter 3.2. Irrigation Water Management Training Manual No. 3. FAO, Rome. [ Links ]
FAVATI F, LOVELLI S, GALGANO F, MICCOLIS V, DI TOMMASO T and CANDIDO V (2009) Processing tomato quality as affected by irrigation scheduling. Sci. Hort. 122 562-571. https://doi.org/10.1016/j.scienta.2009.06.026 [ Links ]
FERNÁNDEZ JE, ALCON F, DIAZ-ESPEJO A, HERNANDEZ-SANTANA V and CUEVAS MV (2020) Water use indicators and economic analysis for on-farm irrigation decision: A case study of a super high density olive tree orchard. Agric. Water Manage. 237 106074. https://doi.org/10.1016/j.agwat.2020.106074 [ Links ]
GARCIA E and BARRETT DM (2006) Peelability and yield of processing tomatoes by steam or lye. J. Food Process. Preserv. 30 (1) 3-14. https://doi.org/10.1111/j.1745-4549.2005.00042.x [ Links ]
GREWAL KS, BUCHAN GD and TONKIN PJ (1990) Estimation of field capacity and wilting point of some New Zealand soils from their saturation percentages, N. Zeal. J. Crop Hort. Sci. 18 241-246. https://doi.org/10.1080/01140671.1990.10428101 [ Links ]
IDSO SB (1982) Non-water stressed baselines. A key to measuring and interpreting plant water stress. Agric. Meteorol. 27 59-70. https://doi.org/10.1016/0002-1571(82)90020-6 [ Links ]
IRAQI D, GAGNON S, DUBE S and GOSSELIN A (1995) Vapor pressure deficit (VPD) effects on the physiology and yield of greenhouse tomato. Am. Soc. Hort. Sci. 30 (4). https://doi.org/10.21273/HORTSCI.30.4.846E [ Links ]
JACKSON RD, IDSO SB, REGINATO RJ and PINTER PJ (1981) Canopy temperature as a crop water stress indicator. Water Resour. Res. 17 (4) 1133-1138. https://doi.org/10.1029/WR017i004p01133 [ Links ]
JINTAO CUI, GUANGCHENG SHAO, JIA LU, LARONA KEABETSWE and GERRIT HOOGENBOOM (2019) Yield, quality and drought sensitivity of tomato to water deficit during different growth stages. J. Sci. Agric. 77 (2). https://doi.org/10.1590/1678-992x-2018-0390 [ Links ]
LOPES CA, ÁVILA AC, REIS A, INOUENAGATA A, QUEZADO-DUVAL AM HENZ GP, CHARCHAR JM, BOITEUX LS, GIORDANO LB and MELO PCT (2005) Doenças do Tomateiro (2nd edn). Embrapa Hortaliças, Brasília. 151 pp. [ Links ]
LORITE IJ, MATEOS L, ORGAZ F and FERERES E (2007) Assessing deficit irrigation strategies at the level of an irrigation district. Agric. Water Manage. 91 51-60. https://doi.org/10.1016/j.agwat.2007.04.005 [ Links ]
LOVELLI S, POTENZA G, CASTRONUOVO D, PERNIOLA M and CANDIDO V (2017) Yield, quality and water use efficiency of processing tomatoes produced under different irrigation regimes in Mediterranean environment. Ital. J. Agron. 12 (1) https://doi.org/10.4081/ija.2016.795 [ Links ]
MAHAJAN G and SINGH KG (2006) Response of greenhouse tomato to irrigation and fertigation. Agric. Water Manage. 84 202-206. https://doi.org/10.1016/j.agwat.2006.03.003 [ Links ]
MASSOT CM, GENARD R, STEVENS and GAUTIER H (2010) Fluctuations in sugar content are determinant in explaining variations in vitamin C in tomato fruit. Plant Physiol. Biochem. 48 751-757. https://doi.org/10.1016/j.plaphy.2010.06.001 [ Links ]
MERIC MK, TUZEL IH, TUZEL Y and OZTEKIN GB (2011) Effects of nutrition systems and irrigation programs on tomato in soilless culture. Agric. Water Manage. 99 19-25. https://doi.org/10.1016/j.agwat.2011.08.004 [ Links ]
MHIZHA T, GEERTS S, VANUYTRECHT E, MAKARAU A and RAES D (2014) Use of the FAO AquaCrop model in developing sowing guidelines for rainfed maize in Zimbabwe. Water SA 40 (2) 233-243. https://doi.org/10.4314/wsa.v40i2.5 [ Links ]
MITCHELL JP, SHENNAN C and GRATTAN SR (1991) Developmental changes in tomato fruit composition in response to water deficit and salinity. Plant Physiol. 83 177-185. https://doi.org/10.1111/j.1399-3054.1991.tb01299.x [ Links ]
MONTE AJ, De CARVALHO DF, MEDICI LO, DASILVA LD B and PIMENTEL C (2013) Growth analysis and yield of tomato crop under different irrigation depths. Rev. Bras. Eng. Agric. Ambiental 17 (9) 926-931. https://doi.org/10.1590/S1415-43662013000900003 [ Links ]
NANGARE DD, SINGH Y, KUMAR PS and MINHAS PS (2016) Growth, fruit yield and quality of tomato (Lycopersicon esculentum Mill.) as affected by deficit irrigation regulated on phenological basis. Agric. Water Manage. 171 C 73-79. https://doi.org/10.1016/j.agwat.2016.03.016 [ Links ]
NASCIMENTO JMS, LIMA LA, CARARO DC, CASTRO EM and SILVA MVG (2009) Assessment of uniformity of application of water in a drip system for small properties. Sci. Agrotechnol. 33 1728-1733. https://doi.org/10.1590/S1413-70542009000700005 [ Links ]
OPIYO AA and YING TJ (2005) The effect of 1-methylcycopropene treatment on the shelf life and quality of chary tomato (Lycopersicon esculentum varcerasiforme) fruit. Int. J. Food Sci. Technol. 40 665-673. https://doi.org/10.1111/j.1365-2621.2005.00977.x [ Links ]
OZBAHCE A and TARI AF (2010) Effects of different emitter space and water stress on yield and quality of processing tomato under semi-arid climate conditions. Agric. Water Manage. 97 1405-1410. https://doi.org/10.1016/j.agwat.2010.04.008 [ Links ]
PATANÈ C and COSENTINO SL (2010) Effects of soil water deficit on yield and quality of processing tomato under a Mediterranean climate. Agric. Water Manage. 97 131-138. https://doi.org/10.1016/j.agwat.2009.08.021 [ Links ]
PRICHARD TL, BATTANY M, SMITH R and SCHWANKL L (2010) Winegrapes: irrigation management of winegrapes with a limited water supply. In: Schwankl L and Prichard T (eds) UC drought management. URL: http://ucmanagedrought.ucdavis.edu/wineGrapes.cfm [ Links ]
RIPOLL J, URBAN L, STAUDT M, LOPEZ-LAURI F, BIDEL LPR and BERTIN N (2014) Water shortage and quality of fleshy fruits-making the most of the unavoidable. J. Exp. Bot. 65 (15) 4097-4117. https://doi.org/10.1093/jxb/eru197 [ Links ]
SALEH MI and OZAWA K (2006) Improvement of crop yield, soil moisture distribution and water use efficiency in sandy soils by clay application. Proc. Tenth International Water Technology Conference, Alexandria, Egypt. 797-811. [ Links ]
SAVIC S, STIKIC R, RADOVIC BV, BOGICEVIC B, JOVANOVIC Z and SUKALOVIC VH-T (2008) Comparative effects of regulated deficit irrigation (RDI) and partial root-zone drying (PRD) on growth and cell wall peroxidase activity in tomato fruits. Sci. Hortic. 117 15-20. https://doi.org/10.1016/j.scienta.2008.03.009 [ Links ]
SCHWAH GO, FANGMEIER DD, ELLIOT WJ and FREVERT RK (1993) Soil and Water Conservation Engineering (4th edn). Wiley and Sons Inc., New York. [ Links ]
TAISHENG D, SHAOZHONG K, JIANHUA Z and WILLIAM JD (2015) Deficit irrigation and sustainable water-resource strategies in agriculture for China's food security. J. Exp. Bot. 66 (8) 2253-2269. https://doi.org/10.1093/jxb/erv034 [ Links ]
TOOR RK, SAVAGE GP and HEEB A (2006) Influence of different types of fertilizers on the major antioxidant components of tomatoes. J. Food Components 19 20-27. https://doi.org/10.1016/j.jfca.2005.03.003 [ Links ]
TUZEL Y, UI MA and TUZEL IH (1994) Effects of different irrigation intervals and rates on spring season glasshouse tomato production: II. Fruit quality. Acta Hortic. 366 389-396. https://doi.org/10.17660/ActaHortic.1994.366.48 [ Links ]
WANG C, FENG G, CHEN J, YANG H, JIANGJ, DU T and ZHANG J (2015) Assessing the response of yield and comprehensive fruit quality of tomato grown in greenhouse to deficit irrigation and nitrogen application strategies. Agric. Water Manage. 161 9-19. https://doi.org/10.1016Zj.agwat.2015.07.010 [ Links ]
YANG H, DU T, QIU R, CHEN J, WANG F, LI Y, WANG C, GAO L and KANG S (2017) Improved water use efficiency and fruit quality of greenhouse crops underegulated deficit irrigation in northwest China. Agric. Water Manage. 179 193-204. https://doi.org/10.1016/j.agwat.2016.05.029 [ Links ]
ZEGBE-DOMINGUEZ JA, BEHBOUDIAN MH and CLOTHIER BE (2006) Responses of 'Petopride' processing tomato to partial rootzone drying at different phenological stages. Irrig. Sci. 24 203-210. https://doi.org/10.1007/s00271-005-0018-4 [ Links ]
ZMSD (Zimbabwe Meteorological Services Department) (2018) Climate data for Harare, Zimbabwe (Version 1.0). URL: http://www.msd.org.zw [ Links ]
 Correspondence:
Teddious Mhizha
Email: tmhizha@science.uz.ac.zw
Received: 4 August 2021
Accepted: 11 September 2023

