


Servicios Personalizados
Articulo
 Inglés (pdf)
 Articulo en XML
 Referencias del artículo
Indicadores

Links relacionados
-
 Citado por Google
 -
 Similares en Google
Compartir

 Permalink
Water SA
versión On-line ISSN 1816-7950
versión impresa ISSN 0378-4738
Water SA vol.49 no.4 Pretoria oct. 2023
http://dx.doi.org/10.17159/wsa/2023.v49.i4.4019
RESEARCH PAPER
Assessment of long-term water demand for the Mgeni system using Water Evaluation and Planning (WEAP) model considering demographics and extended dry climate periods
Vernon NaganI; Mohammed SeyamI; Taher AbunamaII
IDepartment of Civil Engineering and Geomatics, Durban University of Technology, Durban 4001, KwaZulu-Natal, South Africa
IIInstitute of Water and Wastewater Technology, Durban University of Technology, Durban 4001, KwaZulu-Natal, South Africa
ABSTRACT
The Mgeni System is recognised as the main source of water supply for the Durban and Pietermaritzburg region in South Africa. This area is regarded as the primary economic hub of KwaZulu-Natal Province, and this brings about a high level of demographic pressure, with potential water supply problems in the future. This study investigates the water resource situation in the Mgeni System and evaluates future supply and demand accounting based on the (Water Evaluation and Planning) WEAP software. WEAP was used to analyse the study area for the period 2009-2050 to assess the impacts of various scenarios on future water supply shortfalls. Four scenarios were used, which take into account changing population growth rates and extended dry climates. The study found that the catchment is relatively sensitive to changes in population growth and extended dry climates, and this will alter the water availability significantly, causing a water supply deficit. In response to the projected future water demands, one technique to overcome the unmet demand is by introducing water conservation and demand management (WC/DM) strategies to reduce the water losses and shortfall encountered. By implementing adequate measures, water losses can be reduced, preventing water scarcity and giving decision makers time to provide further solutions to water supply problems.
Keywords: water demand, water supply, water resources, water consumption, water allocation
INTRODUCTION
South Africa (SA) is a semi-arid country characterised by spatial and temporal variability of rainfall and is considered a water-stressed country (DWAF, 2004). SA has an average annual precipitation of 500 mm/yr, which is well below the world average of about 860 mm/yr; therefore, water conservation and management is of critical strategic importance (Dennis and Dennis, 2012).
The population within KwaZulu-Natal Province is estimated to have grown from 9 584 129 to 11 531 628 from 2001 to 2020, respectively (Stats SA, 2020), which is an approximately 20% increase, or an annual increase of about 1.1%. One of the consequences of the high increase in population is the pressure it induces on the water sector. Although the challenge is to provide the future population with sufficient clean potable water to meet their basic needs, effective water conservation and demand management strategies need to be implemented to combat the impacts of population growth.
Water conservation and demand management (WC/DM) is becoming a pivotal intervention in balancing water supply with future increases in demand, brought on by high population growth and potentially also climate change. South Africa is a developing country still facing the challenge of providing basic water services to a significant proportion of the population. Water security is increasingly a matter of major concern, with most of the surface water resources fully allocated, and poor water quality downstream of urban areas (Fisher-Jeffes et al., 2017). The surge in population growth leads to increases in water demand for domestic, industrial, agricultural, and municipal needs.
The principle of water conservation and demand management (WC/DM) is critical to ensuring adequate water supply for future sustainability. WC/DM initiatives are the most efficient measures available to lower the demand curve. South Africa is the world's 30th driest country and could be facing water scarcity by the year 2025 (McDonald and Pape, 2002). With the increase in population growth, and if the current rate of water usage and wastage continues, demand is likely to exceed supply in the near future. The high population growth rate in South Africa is putting pressure on the local resources available to sustain communities, especially since climatic conditions are becoming more unpredictable (Kotzé, 2018). As a water-scarce country, strict implementation of water conservation and demand management should take precedence.
The Water Evaluation and Planning (WEAP) model was developed by the Stockholm Environment Institute (SEI) in 1988. WEAP is a water resources planning software which operates on the basic principle of a water balance and can be applied to municipal and agricultural systems, a single watershed or complex transboundary river basin systems. WEAP also allows user to analyse various scenarios, such as varying population growth, potential climate change impacts such as extended periods of dry or wet climates, along with assumptions towards water demand, infrastructure, and regulation. All parameters can be incorporated to predict water shortages and water quality based on a model scenario (Sieber and Purkey, 2011).
WEAP has been used in the African continent for hydrological modelling, water use studies and effects of climate change and population growth impacts on water resources. Furthermore, WEAP was applied to evaluate the water supply and demand of the Yala Catchment in Kenya. The study (Okungu et al., 2017) was conducted using three scenarios, similarly to the current study. The model was developed to evaluate past trends and simulate current demand scenarios for the purpose of planning by authorities for future use. WEAP was also used in a study conducted in the Perkerra catchment in Kenya (Akivaga et al., 2010), whereby WEAP was utilised to perform hydrological and water management analysis of the catchment.
WEAP has also been used to develop and assess the future water demands in the Niger Republic. An application of the WEAP system was developed to study the impact of varying population growth and climate change on agricultural water management and the potential for adaptation in the Niger River Basin (Mounir et al., 2011). In Nigeria, the WEAP model was used to analyse the hydrological and meteorological data of the study area to ascertain the water allocations for different purposes. The model was applied to analyse the management of transboundary water resources in the Hadeja Jama'are River Basin which is a very complex situation due to political conflicts in the region of the Tiga Dam (Mohammed et al., 2020). Furthermore, WEAP was used to analyse a baseline water supply and demand model in the Great Ruaha River Basin in Tanzania, and project the future water supply and demand gap under socio-economic and climate change (Simkonda et al., 2020).
Research work carried out in South Africa using WEAP analysis for water demand management has been limited. One of the studies in South Africa has been in the Olifants River basin, which was conducted to assess the WEAP model as a means of addressing water allocation in the water-stressed Steelpoort river basin (Levite et al., 2003).
Table 1 shows WEAP-related studies carried out within the African continent. The current study is the first application of the WEAP model in the KwaZulu-Natal region and specifically on the Mgeni System.
The WEAP software was proficient to provide reliable analysis in locations with varying climate and demographical factors. From the review of the various applications of WEAP as described above, it was concluded that the WEAP model is suitable for developing water conservation and demand management plans in countries where water is scarce.
A study carried out by the water utility Umgeni Water and the national Department of Water and Sanitation in 2021 found that the water losses in KwaZulu-Natal equate to approximately 36.8% of the total water supplied to the area (Moodley, 2021).
The objectives of the current study were to examine the projections of water supply for the Mgeni system catchment, and to examine the water resources with reference to different scenarios such as low population growth rate, high population growth rate and potential climate change impacts of increased dry periods. This study also evaluates the impacts of the water losses on future supply and demand by determining the quantity of losses that can be avoided in the system. One of the techniques to prevent severe water scarcity is to manage the water resources adequately to decrease water losses. Solutions to water problems depend not only on freshwater availability, but also on how the water is managed by both the water authority as well as the consumer. Development and management processes and practices, supply management, appropriateness and implementation status of the existing legal frameworks are also key to adequate water conservation and management.
METHODOLOGY
Study area
The study area is the Mgeni system situated in KwaZulu-Natal, South Africa, which is bounded by the uThukela River in the north, the Mtamvuna River in the south, the Indian Ocean in the east, and the Drakensberg Mountains in the west, and covers a total of 21 155 km2 with a population of approximately 11 million people. Figure 1 illustrates the study area.
This study focuses mainly on the Mgeni system which consists of The Upper Mgeni system, which supplies potable water to the uMgungundlovu District Municipality, Msunduzi Municipality, and eThekwini Municipality's Outer West area, and the Lower Mgeni System, which supplies potable water to the coastal areas and hinterland of the eThekwini Municipality. Water is supplied to these regions by 4 dams:Inanda Dam, Midmar Dam, Albert Falls Dam and Nagel Dam. The Mearns Weir and Spring Grove Dam, situated on the Mooi River, augment the Mgeni River supply. The water resources of the Upper and Lower Mgeni systems are located on the same river system and are highly inter-dependent (Umgeni Water, 2020).
As the population constantly increases, KwaZulu-Natal has reached a stage where demand exceeds the water availability. This is a serious concern as the shortfall of potable water could bring about negative social and economic impacts.
Data collection
To set-up the WEAP model for the study area, meteorological and hydrological data, such as rainfall and evaporation, were obtained from various sources for the year 2009-2020. The model is based on the period 2009-2050. Table 2 indicates the datasets and sources of the data used.
WEAP model
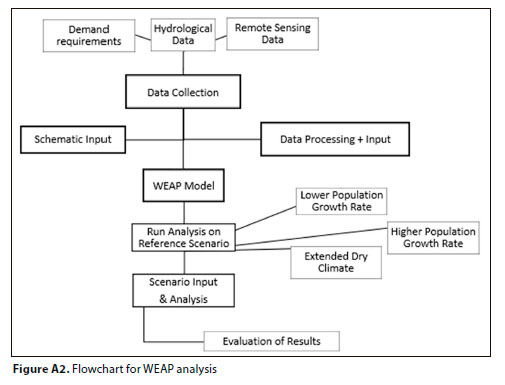
WEAP is a water resources modelling and planning tool, developed by the Stockholm Environment Institute, and is widely used worldwide (Sieber and Purkey, 2011). In this study, the primary objective was to investigate the future supply and demand for the water resources within the study area. The study focuses on the analysis of the WEAP model and the calibration and validation of the two sub-catchments, V20 and U20. WEAP is a unique water resources and planning software which simulates the hydrologic pattern based on climatic input. The main elements used to set up the WEAP model are demand sites, rivers, reservoirs, transmission links, catchments and streamflow gauges. Figure 2 shows the schematic inputs to the WEAP model.
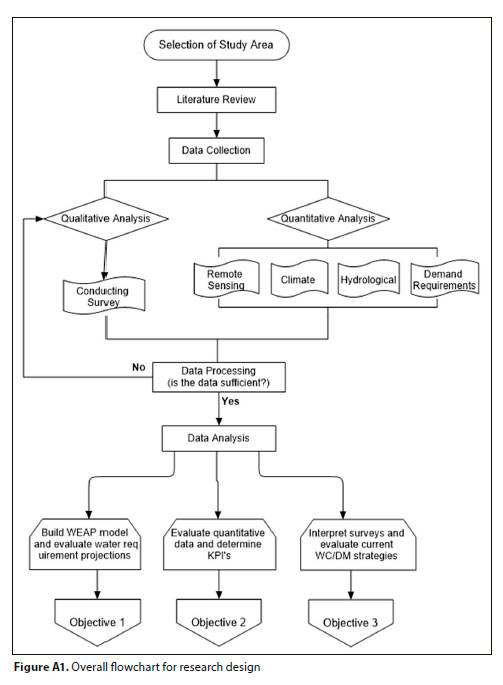
The application of the WEAP model in this study follows the typical methodology, as shown in Figs A1 and A2 (Appendix). The steps in setting up the WEAP model were as follows:
• Study Definition: The study definition consists of the study area and network configuration. In this step, data can be inputted and used to configure the position of rivers, boundaries, gauges, catchment areas, etc. This study used data obtained from WRC2012.
• Current Accounts: is a baseline representation of the system and includes the demand data, river naturalised flows, catchment characteristics, etc.
• Scenarios: are used to evaluate different outcomes of the study. These scenarios can be demographic, water use patterns, water system infrastructure, hydrology, etc.
• Evaluation: this involves the investigation of the different outcomes in relation to the scenario inputs.
Demand sites
The WEAP model focuses on three 'Demand Sites': eThekwini, uMgungundlovu and Msunduzi. The current water demand for the demand sites is shown in Table 3.
Over the decade from 2009 to 2020, the population ofthe study area has been increasing at 1.1% per annum. The major site contributing to the increase is eThekwini, where the population increased from 3 442 070 to 3 825 754 from 2009 to 2019, respectively. Table 4 shows the Annual Activity Level', which is the population of each area, and Annual Water Use Rate' used in setting up the model. As shown in Table 4, both the population and annual water use rates increased year-on-year and are forecasted to increase for years to come. In the analysis, the current population and annual water use rates from 2009-2019 were inputted in the WEAP model and this predicts the future population and annual water use rates for the study period and finally calculates the predicted total water demands under the various scenarios of population growth and an extended dry climatic period.
Supply and resources
Reservoirs
There are 6 reservoirs located within the study area (Fig. 3). Two reservoirs fall within the Mooi River catchment which augments the Mgeni River supply. Four reservoirs fall within the Mgeni River.
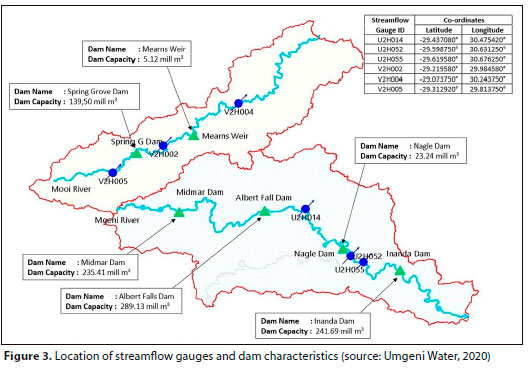
Spring Grove Dam and Mearns Weir are located on the Mooi River and have a catchment area of 339 km2 and 887 km2, respectively. Spring Grove Dam was completed in 2013 and Mearns Weir was completed in 2003, for the purpose of water supply augmentation of the Mgeni System. Spring Grove Dam is a concrete with earth embankment dam with a spillway height of 26.4 m and a crest length of 231 m along the non-spillway section. Mearns Weir is a concrete weir with a spillway height of 6.89 m and a crest length of 165 m.
Midmar Dam, Albert Falls Dam, Nagel Dam and Inanda Dam are located along the Mgeni River and have a catchment area of 926 km2, 1 654 km2, 2 539 km2 and 4 082 km2, respectively. Midmar Dam was completed in 1963, Albert Falls Dam in 1976, Nagel Dam in 1948 and Inanda Dam in 1989. Midmar Dam is a concrete with earth embankment dam with a spillway height of 26.4m and a crest length of 1 283 m along the non-spillway section. Albert Falls Dam is a concrete with earth embankment dam with a spillway height of 21.6 m and a crest length of 1 930 m along the non-spillway section. Nagel Dam is a concrete with earth dam with a spillway height of 24.1 m and a crest length of 272 m along the non-spillway section. Inanda Dam is a concrete with earth embankment dam with a spillway height of 31.2 m and a crest length of 468 m along the non-spillway section.
Streamflow
Streamflow data were sourced from the WR2012 website (WRC, 2021). The area has total of 6 streamflow gauge stations identified for this study (Fig. 3).
Rainfall and temperature
All data for rainfall and temperature were collected from the South African Weather Service (SAWS) for sites depicted with asterisks in Fig. 4. The area has a total of 7 rainfall and temperature stations that were used in this study.
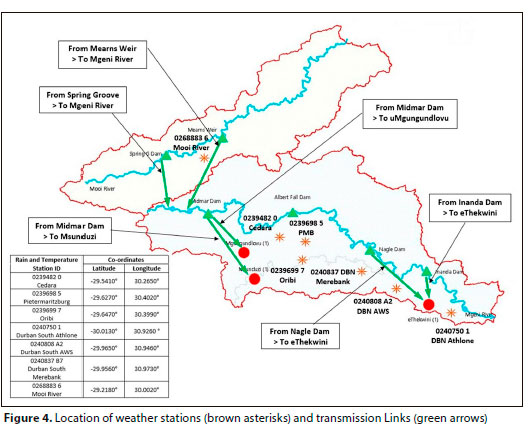
Connecting supply with demand
To ensure demand for the study area is satisfied in the WEAP model, the demand sites need to be connected to the supply system. The transmission link is used to connect the supply to the demand. These can be accomplished in the schematic view where transmission link is added. The link is routed from the river/reservoir to the demand node. The study area includes 6 transmission links (Fig. 4).
Analysis of development scenarios
This section indicates the scenarios implemented in the WEAP model to assess the water resources within the study area. The year 2009-2050 was chosen as the analysis period for all information on the system such as the current consumption, abstraction volumes, rainfall, temperature, etc. The other scenarios for the analysis involve parameters such as population, potential climate change impacts of extended dry climatic periods and water usage.
• Scenario 1: Reference scenario (1.1% growth rate)
• Scenario 2: Low population growth (0.75%)
• Scenario 3: High population growth (2.5%)
• Scenario 4: Extended dry climate sequence
A 'scenario' is derived from the current account in which all basic data is inputted in the model. The 'scenario' covers the period 2009-2050 and it reflects the projection of water demands considering the varying population growth rates and extended dry climate sequence. Implementing various scenarios serves as a point of comparison in which some changes in the system data can be made.
RESULTS AND DISCUSSION
The WEAP model was developed by computing all of the parameters of the model in 'Current Accounts' for the base period 2009 and the Reference Scenario information for the period of 2010 to 2050. The comparative scenarios were then set in the model and the model was run to generate results for the different scenarios.
Scenario 1: Reference Scenario (1.1% growth rate)
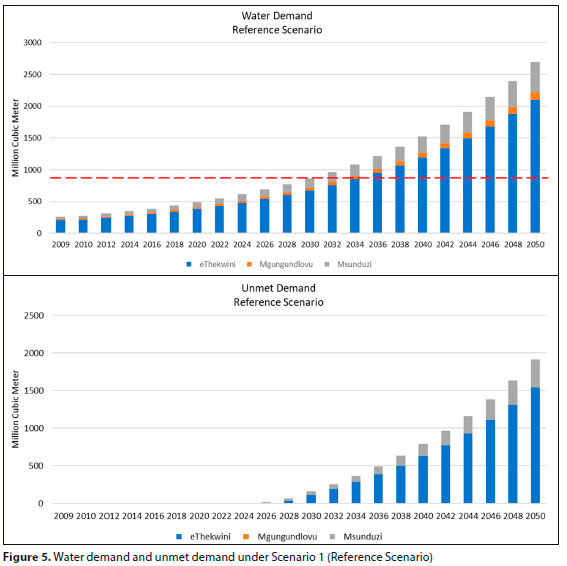
The Reference Scenario is based on the Current Accounts with a population growth rate of 1.1%. The population growth rate was determined to be 1.1% during the study reference period. The WEAP model calculated the projected population using exponential functions. Projected population figures for a 1.1% growth rate are shown in Table A1 (Appendix). Table 5 indicates the water demand as well as unmet demand for each demand site under the Reference Scenario.
Under Scenario 1 (Reference Scenario) the total water demand for the period 2009-2050 is projected to be 34 695 million m3 for eThekwini, 7 390 million m3 for Msunduzi, and 2 125 million m3 for uMgungundlovu. The total unmet water demand for the entire period is 14 780 million m3 for eThekwini, 3 900 million m3 for Msunduzi, and 0 million m3 for uMgungundlovu. The evaluation of the Reference Scenario shows that with a constant growth in population of 1.1%, the water availability is relatively sufficient until 2024 for Msunduzi and 2026 for eThekwini (Fig. 5).
Scenario 2: Low population growth (0.75%)
According to a study of the anticipated population growth for future years produced by World Population Review (World Population Review, 2022) it is noted that the population growth is expected to continue but it will gradually decrease to below 1% by 2026. Therefore, for this study we decided to use a population growth rate of 0.75% to determine the impacts of a lower growth rate than that recorded currently (1.1%). To evaluate the impacts of 0.75% population growth, a new scenario was created with this modified population growth, as shown in Table A2 (Appendix).
Figure 6 illustrates the projected water demand and unmet demand for the lower population growth rate (0.75%) of Scenario 2. The total water demand for the period 2009-2050 is 31 495 million m3 for eThekwini, 6 700 million m3 for Msunduzi, and 1 934 million m3 for uMgungundlovu. It is noted that Scenario 2 produces approximately 10% less water demand compared to Scenario 1 (Reference Scenario).
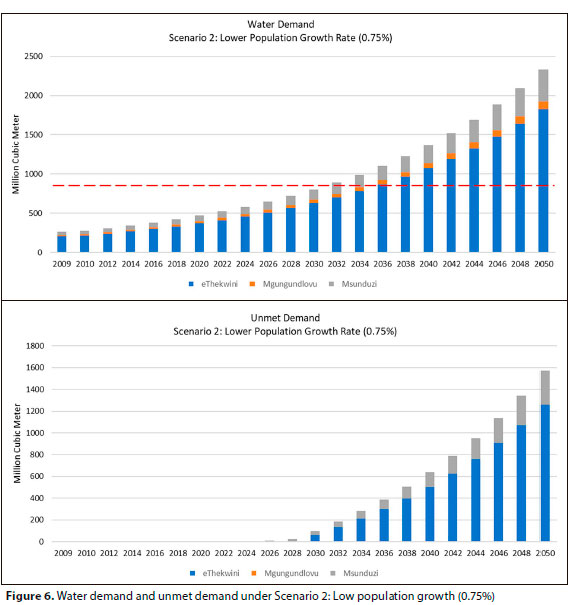
The total unmet water demand for the entire period is 11 825 million m3 for eThekwini, 3 235 million m3 for Msunduzi, and 0 million m3 for uMgungundlovu. The evaluation of Scenario 2 shows that with a constant growth in population of 0.75%, water availability is relatively sufficient until 2026 for Msunduzi and 2030 for eThekwini.
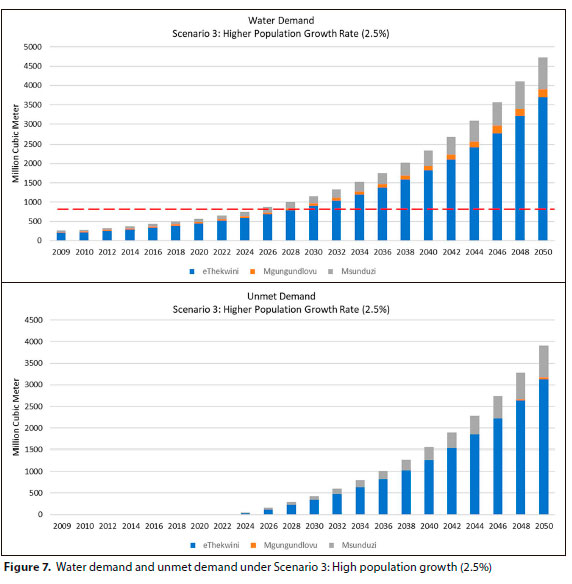
Scenario 3: High population growth (2.5%)
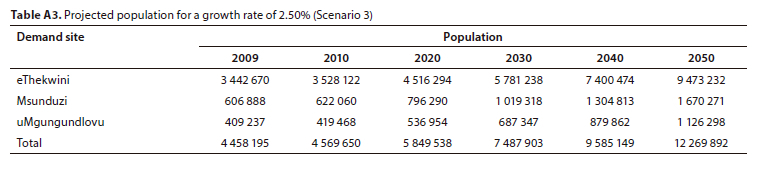
Scenario 3 was used is to evaluate the impact of a population growth increase from the reference 1.1% to 2.5% for the period of2009-2050. The population for 2.5% growth is shown in Table A3 (Appendix).
A new scenario was added to the WEAP model using the 'Manage Scenario' function and was given the alias 'Population growth 2.5%'. Figure 7 shows the projected results for water demand and unmet demand with a population growth rate for the study area of 2.5%. It is noted that Scenario 3 produces approximately 50% more water demand compared to Scenario 1 (Reference Scenario). Under Scenario 3, water availability is relatively sufficient until 2022 for Msunduzi and until 2024 for eThekwini.
Scenario 4: Extended dry climate sequence
Climate change is already a measurable reality posing significant social, economic, and environmental risks and challenges globally. Like many other developing countries, South Africa is especially vulnerable to the impacts of climate change (Kreft, 2017). Scenario 4 was developed to understand how climate change, specifically an extended period of dry climate, will affect water supply for the study area.
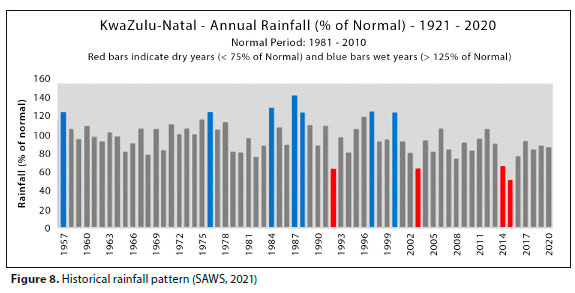
A new scenario with alias 'extended dry climate' was created from the Reference Scenario, and the climate variation modified to evaluate the impact on water supply. For Scenario 4 (Extended dry climate sequence) the variation assigned is shown in Table 6. The climate variation was selected based on the historical annual rainfall data from 1990-2010 (SAWS, 2021). As illustrated in Fig. 8, KwaZulu-Natal experienced a dry climate from 2000-2020, with 2003, 2014 and 2015 experiencing extreme dry climates. Furthermore, coupled with climate change and global warming, it has been predicted that the future years will follow a dry to very dry pattern with short wet periods occasionally.
In addition to the climate variation shown in Table 6, this scenario uses the 1.1% population growth of Scenario 1 (Reference Scenario) to determine the impacts on the water demand and supply. Under Scenario 4, the unmet demand is significant and varies in accordance with the climate (Fig. 9). This indicates that the water demand and supply is highly dependent on the climatic conditions.
Overall results
Under the Reference Scenario, the water demand steadily increases between 2010 and 2050. It increased from approximately 280 million m3 in 2010 to approximately 2 695 million m3 in 2050. Under Scenario 2 it increased from approximately 280 million m3 in 2010 to a total of about 2 335 million m3 by 2050. A comparison between Scenario 1 (Reference Scenario) and Scenario 2 (population growth of 0.75%) indicates that with reduced population growth the water demand is sufficient to cater for the population till 2025. This allows time for policymakers, engineers, and stakeholders to implement WC/DM strategies.
Water demand under Scenario 3 (population growth of 2.5%) increased from approximately 285 million m3 in 2010 to a total of about 4 730 million m3 by 2050. The comparison between Scenario 1 (Reference Scenario) and Scenario 3 indicates that there will be a severe shortfall of potable water should the growth rate increase.
Finally, water demand for Scenario 4 (extended dry climate sequence) increased from approximately 280 million m3 in 2010 to a total of about 2 695 million m3 by 2050. The water demand and supply for this scenario varies as the climate changes. This shows that the study area is highly affected by climate change and long periods of dry climates will bring about a severe water shortfall.
Figure 10 and Table 7 indicate that the study area is highly influenced by population growth and potential climate change impacts of extended dry periods. Due to the current water situation, an increase in the population growth rate (from the current 1.1%) will only worsen the water demand problems.
The 'unmet demand' illustrated in Table 7 is determined to occur in year 2025 for the Reference Scenario; in 2026 for Scenario 2; in 2022 for Scenario 3; and in 2025 for Scenario 4 (this fluctuates with the change in climate).
Possible solutions to water supply issues under various scenarios
As indicated by these results, the study area faces water resource problems under all four scenarios. One of the most efficient ways to overcome these problems is to reduce water losses, which are estimated to be approximately 36% of the total water supplied. By determining the relevant key performance indicators (KPIs), one can estimate the possible reduction in the water losses which will decrease the water demand and unmet demand.
Unavoidable Annual Real Loss (UARL) is the amount of water loss that is 'unavoidable' in the system. To succeed in WC/DM, one needs to determine these UARL and compare them to the Current Annual Real Loss (CARL). An estimate of UARL can help to evaluate the feasibility to minimise real loss, which provides a better understanding of real loss components.
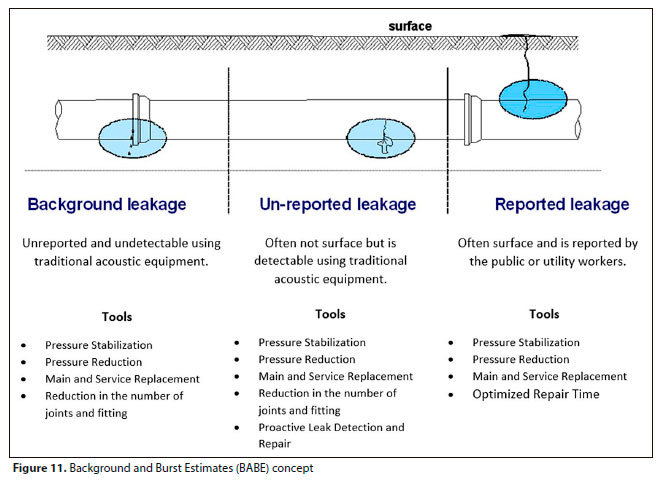
The UARL can be calculated (Eq. 1) based on the Background and Burst Estimates (BABE). Leakages can be categorised in three ways, as indicated in Fig. 11. Firstly, 'background leakages' cannot be seen from the surface, and are not reported. These leaks occur when pressure is very low in a system or if the pipe infrastructure damage is small. Secondly, 'unreported leakages' are leakages that also cannot be seen on the surface but can be detected using acoustic equipment. Finally, 'reported leakages' are leakages that are big enough to surface and are visible to the public.

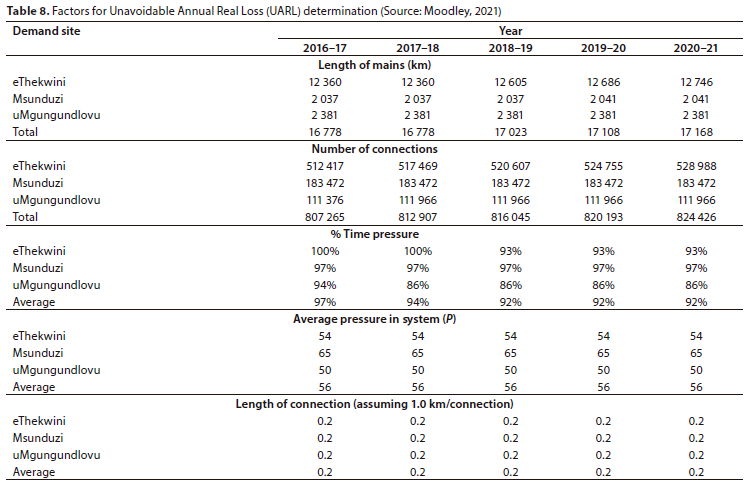
where Lm = length of mains in km, Nc = number of service connections, Lp = total length in km of underground connection pipes (between the edge of the street and customer meters), and P = average operating pressure in m.
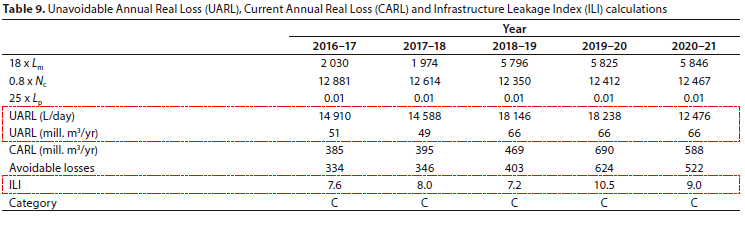
Table 8 indicates the parameters used to determine the KPIs of the study area. Using Eq. 1 to calculate UARL, the researcher can determine the amount of water loss that is unavoidable and avoidable. Table 9 shows the calculated values for UARL and CARL for the study area.
As shown in Table 9, the Current Annual Real Loss (CARL) have been obtained from relevant reports, and can be used to determine the Infrastructure Leakage Index (ILI) as follows (Moodley, 2021):
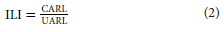
Table 10 gives the ILI and the Technical Performance Category of the study area. The Technical Performance Category indicates the current WC/DM implemented and the nature of the current infrastructure.
• Category A: Further loss reduction may be uneconomic unless there are shortages; thus, careful analysis needed to identify cost-effective improvement.
• Category B: Potential for marked improvements if consider pressure management, better active leakage control practices and better network maintenance.
• Category C: Poor leakage record, tolerable only if water is plentiful and cheap; even then, analyse level and nature of leakage and intensify leakage reduction efforts.
• Category D: Highly inefficient, leakage reduction programmes are imperative and have high priority (Liemberger, 2005).
As shown in Table 10, the study area falls within a Category C. As stated by Liemberger, Category C indicates poor leakage control, tolerable only if water is plentiful and cheap.
Apparent losses
Apparent losses are losses that occur due to unauthorised consumption such as theft or illegal usage, inaccurate meter reading, etc. As shown in Table 11, eThekwini is one of the highest water loss areas in South Africa, registering approximately 8.9 to 18.2 million m3/yr.
The Apparent Loss Index (ALI) has been recommended by the IWA task force to investigate current apparent losses and categorise them, similarly to the ILI. The concepts for apparent losses are similar to those already defined for real losses, whereby the Current Annual Apparent Loss (CAAL) is similar to Current Annual Real Loss (CARL), and the Apparent Loss Index (ALI) is similar to Infrastructure Leakage Index (ILI) (Vermersch et al., 2016).
The ALI can be determined by:
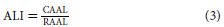
where RAAL (Real Annual Apparent Loss) = 5% x water supplied, excluding water exported.
CAAL, RAAL and ALI for this study are given in Table 12.
In countries with poor management of water resources, it was determined that the ALI is extremely high, i.e., higher than 5. In countries with ALI lower than 1, this is regarded as an indication that water resources are under control, and proper techniques are followed. In cases where ALI is lower than 1, it is important to check that the default values used are valid and supported by appropriate field and lab surveys. An ALI lower than 1.0, similarly to an ILI lower than 1.0, can occur in some circumstances. An ALI lower than 1.0 can be accepted if (Vermersch et al., 2016):
• Validation of the volume components of RAAL has been sufficient to justify the calculation of ALI.
• It has been recently validated that the use of defaults lower than a RAAL of 5% of billed metered consumption is justified.
• New metering techniques are used.
However, if only a limited or cursory check on RAAL components has been done, further control and monitoring are required, especially if no measures were previously put in place to reduce this value to less than unity.
Evaluation of future demand with avoidable losses
The UARL for the 2020-21 financial year was estimated at approximately 66 million m3/yr, with the CARL estimated at approximately 588 million m3/yr, giving an Avoidable Real Loss of approximately 522 million m3/year. The CAAL was determined to be 23.8 million m3/yr and RAAL 24.4 million m3/yr, giving an Avoidable Apparent Loss estimate of approximately 1 million m3/yr. Hence, the total Avoidable Loss equates to 523 million m3/yr. If the study area achieves a 50% and 100% reduction in water losses, the unmet demand will be as shown in Figs 12 and 13 below.
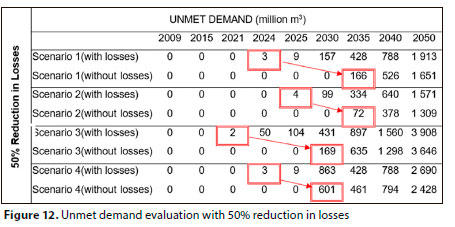
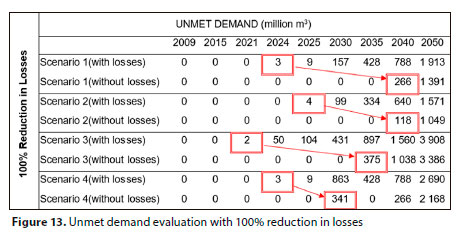
Under Scenario 1 and Scenario 2, the study area will only encounter water problems in 2035 with a 50% water loss reduction and in 2040 with a 100% water loss reduction. In Scenario 3, the study area will only encounter water problems in 2030 with a 50% water loss reduction and in 2035 with a 100% water loss reduction.
Finally, in Scenario 4, the study area will only encounter water problems in 2030 with a 50% and 100% water loss reduction with varying unmet demand due to the varying dry climate.
In summary, by introducing WC/DM to eliminate the water losses encountered, the study area would delay water scarcity problems by a few years, which can be used to develop future solutions to the water problems. Water losses can be reduced by WC/DM strategies such as pressure management, active leak detection and testing, etc.
CONCLUSIONS AND RECOMMENDATIONS
This study was conducted to evaluate the water availability in the Mgeni System using the Water Evaluation and Planning (WEAP) model for the year 2009. Four scenarios were modelled and analysed for the Mgeni System, considering the impacts of growth of the population within the study area, as well as climate change. The period of the analysis in WEAP was 2009-2050, and the naturalised flow data was readily available for the base period. The study used historical population growth to determine the current growth rate of the study area as illustrated in Scenario 1. Furthermore, the annual water use rates were based on the previous year's data.
The results for Scenario 1 (Reference Scenario) with population growth at 1.1% indicate that there will be sufficient water supply up to the year 2024, with 9 million m3 of unmet demand in 2025. However, the results for Scenario 2 (Low population growth of 0.75%) indicate that the water supply can accommodate demand up to the year 2025, with 9 million m3 of unmet demand in 2026. For Scenario 3 (high population growth at 2.5%), it is noted that the unmet demand is encountered in year 2022 with 9 million m3 unmet. Finally, Scenario 4 (extended dry climate sequence) was compared to the Reference Scenario to investigate the impacts in relation to the current population growth rate. These results show that with an extended dry climate period, severe water shortages are experienced and at a high rate, and unmet demand begins in 2025.
In conclusion, the results of the WEAP model for the Mgeni System show that water scarcity is a real challenge. The impacts of climate change and population growth indicate various water shortages in certain years. It can be seen from Scenario 1 (Reference Scenario) and Scenario 3 (population growth of 2.5%) that more needs to be done to speed up the increase in water availability as the population increases. In Scenario 2 (population growth of 0.75%), it can be seen that there is a delay in the unmet demand which allows time for action by the water authorities. The status of the water resources in KwaZulu-Natal calls for solutions and interventions from decision-makers, consumers, and all stakeholders. The water shortage can be solved by implementation of water conservation and demand management. Solutions to water problems depend not only on freshwater availability, but also on how the water is managed by both the water authority as well as the consumer. Development and management processes and practices, supply management, appropriateness and implementation status of the existing legal frameworks are also key to adequate water conservation and management.
Stakeholders such as water service authorities, water users, professional organisations, academics, government institutions and members of parliament have the power to regulate and action strategies that can conserve and manage the water supply to cater for future demands. The implementation and regularisation of WC/DM strategies such as rainwater harvesting, greywater reuse, education and awareness, pressure management and active leakage control will be highly beneficial in combating future unmet demand.
Finally, this study gives an indication of the water resource situation within the Mgeni system and can be used as a baseline for further research. It is highly recommended that further studies be carried out with the WEAP model.
ORCIDS
Vernon Nagan: https://orcid.org/0000-0002-8864-9220
Mohammed Seyam: https://orcid.org/0000-0001-6831-3239
Taher Abunama: https://orcid.org/0000-0002-8588-898X
REFERENCES
AKIVAGA EM, OTIENO FA, KIPKORIR EC, KIBIIY J and SHITOTE S (2010) Impact of introducing reserve flows on abstractive uses in water stressed Catchment in Kenya: Application of WEAP21 model. Int. J. Phys. Sci. 5 (16) 2441-2449. https://doi.org/10.2495/WS110401 [ Links ]
DENNIS I and DENNIS R (2012) Climate change vulnerability index for South African aquifers. Water SA 38 (3) 417-426. https://doi.org/10.4314/wsa.v38i3.7 [ Links ]
DWAF (Department of Water Affairs and Forestry, South Africa) (2004) National Water Conservation and Demand Management Strategy. DWAF, South Africa. [ Links ]
FISHER-JEFFES L, CARDEN K and ARMITAGE N (2017) A water sensitive urban design framework for South Africa. Town and Regional Planning 710 1-10. [ Links ]
HUGHES CJ, DE WINNAAR G, SCHULZE RE, MANDER M and JEWITT GPW (2018) Mapping of water-related ecosystem services in the uMngeni catchment using a daily time-step hydrological model for prioritisation of ecological infrastructure investment -Part 1: Context and modelling approach. Water SA 44 (4) 577-589. https://doi.org/10.4314/wsa.v44i4.07 [ Links ]
IVEY JL, SMITHERS J, DE LOË RC and KREUTZWISER RD (2004) Community capacity for adaptation to climate-induced water shortages: Linking institutional complexity and local actors. Environ. Manage. 33 (1) 36-47. https://doi.org/10.1007/s00267-003-0014-5 [ Links ]
JAZI HH (2021) Integrated water resources management: a tool for sustainable development. Future Eng. J. 2 (1) 1. [ Links ]
KOTZE P (2018) Two thirsty cities' successful attempts to consume less water. The Water Wheel 17 (4) 17-21. [ Links ]
KREFT E (2017) South Africa's Second National Climate Change Report 2017. Department of Environmental Affairs, Pretoria. [ Links ]
LIEMBERGER R and MCKENZIE R (2005) Accuracy Limitations of the ILI - is it an appropriate indicator for developing countries. In Conference Proceedings, IWA Leakage 2005 Conference, Halifax, Nova Scotia. [ Links ]
LÉVITE H, SALLY H and COUR J (2003) Water demand management scenarios in a water-stressed basin in South Africa. Proc. 3rd WARFSA/WaterNet Symp. 15-17. [ Links ]
MCDONALD A, GRAY I and TAYLOR T (2015). Optimising your water and sanitation assets: infrastructure asset management. IMIESA 40 (8) 56-61. [ Links ]
MOHAMMED A, MUHAMMAD MM, ADEOGUN BK, ARGUNGU AS and IDRIS UD (2020) Application of the WEAP model for future water allocation from Tiga Dam. Nig. J. Eng. 27 (2) 45-54. [ Links ]
MOODLEY T (2021) The Status of Non-Revenue Water in the Province of KwaZulu-Natal as of end of the 2020/21 Financial Year. Department of Water and Sanitation, Pretoria. [ Links ]
MOUNIR ZM, MA CM and AMADOU I (2011) Application of Water Evaluation and Planning (WEAP): A model to assess future water demands in the Niger River (in Niger Republic). Modern Appl. Sci. 5 (1) 38. https://doi.org/10.5539/mas.v5n1p38 [ Links ]
OKUNGU J, ADEYEMO J and OTIENO F (2017) Scenario analysis of water supply and demand using WEAP model: a case of Yala Catchment, Kenya. Am. J. Water Resour. 5 (4) 125-131. https://doi.org/10.31219/osf.io/vawqm [ Links ]
RAMNATH A (2020) Umgeni Water Infrastructure Master Plan 2020/2021 - 2050/51, Vol 1 - 10. Umgeni Water, Pietermaritzburg. [ Links ]
SHARMA S (2008) Performance indicators of water losses in distribution system. UNESCO-IHE Institute for Water Education, Delft. [ Links ]
SIEBER J and PURKEY D (2011) WEAP: Water Evaluation and Planning System. User guide. Stockholm Environment Institute, US Centre, Somerville, MA. [ Links ]
SIMKONDA GD and KANSAL ML (2020) Integrated water resources management under socio-economic and climate change of Great Ruaha Catchment In Tanzania using the WEAP Model. Int. J. Sci. Dev. Res. 5 (10) 57-68. [ Links ]
SAWS (South African Weather Service) (2021) Annual State of the Climate of South Africa 2020. SAWS, Pretoria. [ Links ]
UMGENI WATER (2020) Infrastructure Master Plan 2020, Volume 2: Mgeni System. South Africa. URL: www.umgeni.co.za/wpcontent/uploads/2020/07/UW_IMP_2020_Vol_2_Mgeni_Signed.pdf (Accessed 21 September 2021). [ Links ]
STATS SA (Statistics South Africa) (2020) Statistical Release P0302: Mid-year population estimates 2020. Statistics South Africa, Pretoria. [ Links ]
VAN KOPPEN B, HOFSTETTER M, NESAMVUNI AE and CHILUWE Q (2020) Integrated management of multiple water sources for multiple uses: rural communities in Limpopo Province, South Africa. Water SA 46 (1) 1-11. https://doi.org/10.17159/wsa/2020.v46.i1.7870 [ Links ]
VERMERSCH M, CARTEADO F, RIZZO A, JOHNSON E, ARREGUI F and LAMBERT A (2016) Guidance notes on apparent losses and water loss reduction planning. LeaksSuit Library, UK. [ Links ]
WRC (Water Research Commission, South Africa) (2012) Water Resources of South Africa, 2012 Study (WR2012) (dataset). URL: https://waterresourceswr2012.co.za/ (Accessed 6 July 2021). [ Links ]
WEGELIN WA and JACOBS HE (2013) The development of a municipal water conservation and demand management strategy and business plan as required by the Water Services Act, South Africa. Water SA 39 (3) 415-422. https://doi.org/10.4314/wsa.v39i3.11 [ Links ]
WORLD POPULATION REVIEW (2022) World Population Review Online (dataset). URL: https://worldpopulationreview.com/ (Accessed 18 June 2022). [ Links ]
YAO AB, MANGOUA OMJ, GEORGES ES, KANE A and GOULA BTA (2021) Using "Water Evaluation and Planning" (WEAP) Model to Simulate Water Demand in Lobo Watershed (Central-Western Cote d'Ivoire). J. Water Resour. Protect. 13 (3) 216. https://doi.org/10.4236/jwarp.2021.133013 [ Links ]
 Correspondence:
Mohammed Seyam
Email: mohammeds@dut.ac.za
Received: 7 September 2022
Accepted: 14 October 2023
APPENDIX


